Model Tumor Systems
▪ TRANSPLANTABLE SOLID TUMOR SYSTEMS IN EXPERIMENTAL ANIMALS
A wide range of experimental tumors of various histologic types have been developed for radiobiologic studies. To produce a large number of virtually identical tumors, propagation by transplantation from one generation of animals to the next is used, which makes it mandatory that the animals be isologous. In practice, pure inbred strains of rats or mice are used and are maintained by brother-sister mating, which also serves the function of reducing the variability among animals to a minimum.
The tumor from a donor animal is removed aseptically and, if possible, prepared into a singlecell suspension; this is accomplished by separating the cells with an enzyme such as trypsin and then forcing them through a fine wire mesh. To effect a transplant, 104 to 106 cells are inoculated subcutaneously into each of a large group of recipient animals of the same strain. The site of transplantation varies widely; the flank or back is commonly used, but sometimes a special tumor requires a particular site, such as the brain. Some tumors cannot be handled in this way and must be propagated by transplanting a small piece of tumor rather than a known number of single cells; this is obviously less quantitative. Within days or weeks, depending on the type of tumor and the strain of animals, palpable tumors appear in the recipient animals that are uniform in size, histologic type, and so on. Hundreds to thousands of animals can be used, which makes it possible to design highly quantitative studies of tumor response to different radiations, fractionation regimens, sensitizers, and combinations of radiation and chemotherapeutic agents.
There are five commonly used techniques to assay the response of solid tumors to a treatment regimen:
Tumor growth measurements
Tumor cure (TCD50) assay
Tumor cell survival determined in vivo by the dilution assay technique
Tumor cell survival assayed by the lung colony assays
Tumor cell survival using in vivo treatment followed by in vitro assay
Each of these methods is discussed briefly in this chapter. These assays take into account both intrinsic cell sensitivity to ionizing radiation as well as the influence of the microenvironment. Before we discuss the techniques used to assess tumor response to radiation, we should briefly revisit how the type of cell death and the tumor microenvironment can affect tumor response to therapy, in particular the role of apoptotic cell death.
▪ APOPTOSIS IN TUMORS
It is generally thought that irradiated cells die in attempting the next or a subsequent mitosis. However, this is not the only form of cell death. Programmed cell death, or apoptosis, also occurs in both normal tissues and tumors, spontaneously,
because of irradiation, and can be triggered by changes in the tumor microenvironment.
because of irradiation, and can be triggered by changes in the tumor microenvironment.
In Chapter 22, it is pointed out that tumors grow much more slowly than would be predicted from the cell cycle time of the individual cells and the fraction of cells actively dividing. One of the reasons for this “cell loss,” as it is called, is random cell death resulting from apoptosis.
Studies with transplanted mouse tumors, as well as human tumors growing as xenografts in nude mice, have shown that the importance of apoptosis as a mechanism of cell death after x-irradiation varies substantially. Apoptosis was most important in lymphomas, essentially absent in sarcomas, and intermediate and very variable in carcinomas. In a mouse lymphoma, for example, 50% to 60% of the cells may show signs of dying an apoptotic death by 3 hours after irradiation, whereas in a sarcoma, there may be so few apoptotic cells that the process is of little significance. If a tumor responds rapidly to a relatively low dose of radiation, it generally means that apoptosis is involved, because the process peaks at 3 to 5 hours after irradiation.
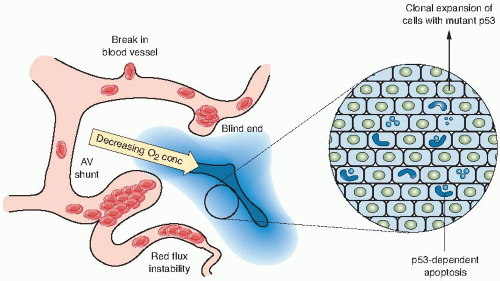 FIGURE 21.1 Regions of hypoxia form within solid tumors as a result of the inefficient and disorganized vasculature. Hypoxic regions represent a gradient of oxygen concentrations, the highest being nearest the vessels and the lowest being the farthest away. In the most hypoxic regions, p53 is stabilized and induces apoptosis. A selection pressure therefore exists to loose p53 and allows the clonal expansion of cells. These cells are also resistant to chemotherapy and radiotherapy, both of which require an efficient blood supply. (From Hammond EM, Giaccia AJ. Hypoxia-inducible factor-1 and p53: friends, acquaintances, or strangers? Clin Cancer Res. 2006;12:5007-5009, with permission.) |
Susceptibility to the induction of apoptosis also may be an important factor determining radiosensitivity, because programmed cell death appears to be a prominent early effect in radiosensitive mouse tumors and essentially absent in radioresistant tumors. In particular, the transformation of mouse cells of different histologic origins with oncogenes in cell culture makes them particularly sensitive to DNA damage-induced apoptosis. The concern with using cell lines that are highly susceptible to apoptosis is that cell culture will act as a selective pressure over time to select for variants of these cells that have lost their apoptotic sensitivity, thus changing their in vivo sensitivity to radiation and cytotoxic drugs used in cancer therapy.
Changes in the microenvironment can also influence the sensitivity of tumor cells to therapy (Fig. 21.1). Studies have shown that changes in tumor oxygenation, pH, and growth factors can induce apoptotic cell death in a subset of tumor cells that represent a therapeutically resistant population. Therefore, cells that are sensitive to apoptosis will be more susceptible to killing by
the environmentally restrictive conditions in experimental tumors and will be better able to be controlled by radiotherapy and chemotherapy. Cells with diminished apoptotic potential, which represent most tumor cell lines maintained in culture, will have lost this rapid response to radiotherapy but can still die by a mitotic cell death. Cells with diminished apoptotic sensitivity caused by genetic mutations in critical apoptotic pathways, such as the p53 tumor suppressor gene or the Bcl-2 oncogene (see Chapter 18), are probably more reflective of human solid tumors that are treated clinically.
the environmentally restrictive conditions in experimental tumors and will be better able to be controlled by radiotherapy and chemotherapy. Cells with diminished apoptotic potential, which represent most tumor cell lines maintained in culture, will have lost this rapid response to radiotherapy but can still die by a mitotic cell death. Cells with diminished apoptotic sensitivity caused by genetic mutations in critical apoptotic pathways, such as the p53 tumor suppressor gene or the Bcl-2 oncogene (see Chapter 18), are probably more reflective of human solid tumors that are treated clinically.
▪ TUMOR GROWTH MEASUREMENTS
Tumor growth measurement is possibly the simplest end point to use and involves the daily measurement of each tumor to arrive at a mean diameter. For tumor growth experiments, a large number of transplanted tumors are prepared as previously described. When they have grown to a specified size (e.g., a diameter of 8 to 10 mm in rats or 2 to 4 mm in mice), they are treated according to the plan of the particular experiment. Figure 21.2 illustrates the variation of tumor size with time for unirradiated controls and tumors given a single dose of x-rays. The untreated tumors grow rapidly at a relatively uniform rate; the radiation treatment causes a temporary shrinkage of the tumor, followed by regrowth.
 FIGURE 21.2 The pattern of response of a tumor to a dose of x-rays. The size of the tumor, either the mean diameter or the volume, is plotted as a function of time after irradiation. Two different indices of tumor responses have been used by different investigators. Growth delay represents the time after irradiation that it takes for the tumor to regrow to the size at the time of irradiation. Alternatively, the index of radiation damage may be the time taken for the tumor to grow from a specified size A at the time of irradiation to some specified larger size B. Typically, this may be from 9 to 25 mm in diameter for rat tumors. This quantity is shown as TCON for unirradiated control animals and Tx-ray for tumors irradiated with a dose (D) of x-rays. Either index of tumor response may be plotted as a function of radiation dose. |
Two different methods have been used to score the tumor response. Barendsen and his colleagues have used growth delay, illustrated in Figure 21.2, as the time taken after irradiation for the tumor to regrow to the size it was at the time of irradiation. Clearly, this index of response is only suitable for tumors that shrink significantly after irradiation. For tumors that do not shrink so obviously, a more convenient index of growth delay is the time taken for the irradiated tumor to grow to some specified size after exposure, compared with controls. Either index of growth delay increases as a function of radiation dose. Figure 21.3A shows growth curves for a rat rhabdomyosarcoma irradiated with various doses of x-rays or fast neutrons. In Figure 21.3B, growth delay is expressed as a function of radiation dose.
▪ TUMOR CURE (TCD50) ASSAY
Tumor control provides data of most obvious relevance to radiotherapy. In experiments of this kind, a large number of animals with tumors of uniform size are divided into separate groups, and the tumors are irradiated locally with graded doses. The tumors subsequently are observed regularly for recurrence or local control. The proportion of tumors that are locally controlled can be plotted as a function of dose, and data of this kind are amenable to a sophisticated statistical analysis to determine TCD50,
the dose at which 50% of the tumors are locally controlled. This quantity is highly repeatable from one experiment to another in an inbred strain of animals.
the dose at which 50% of the tumors are locally controlled. This quantity is highly repeatable from one experiment to another in an inbred strain of animals.
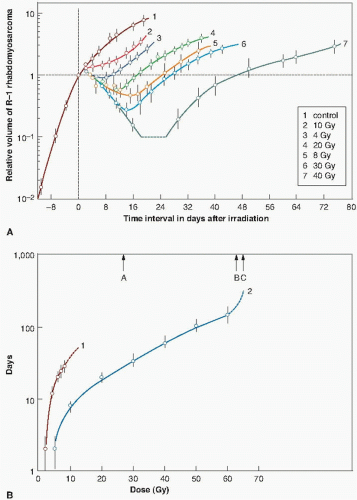 FIGURE 21.3 A: Volume changes of rhabdomyosarcomas in rats after irradiation. Curve 1 represents the growth of the unirradiated control tumors. Curves 2, 4, 6, and 7 refer to tumors irradiated with 10 to 40 Gy of 300-kV x-rays. Curves 3 and 5 refer to tumors irradiated with 4 and 8 Gy of 15-MeV d+ →T fast neutrons. B: Growth delay of rhabdomyosarcomas in rats as a function of dose of x-rays (curve 2) or fast neutrons (curve 1). A and C indicate the doses of neutrons and x-rays, respectively, required to “cure” 90% of the tumors, calculated based on the cell survival curves. B indicates the observed TCD90 for x-rays. Note the good agreement between calculated and observed values of the TCD90 for x-rays. (Adapted from Barendsen GW, Broerse JJ. Experimental radiotherapy of a rat rhabdomyosarcoma with 15 MeV neutrons and 300 kV x-rays. I. Effects of single exposures. Eur J Cancer. 1969;5:373-391, with permission.) |
 FIGURE 21.4 Percentage of mouse mammary tumors locally controlled as a function of x-ray dose for single exposures and for two different fractionation patterns. The tumors were isotransplants derived from a spontaneous mammary carcinoma in a C3H mouse. The transplantation was made into the outer portion of the ear with 4 × 10⁴ viable cells. The tumors were treated when they reached a diameter of 2 mm (i.e., a volume of about 4 mm3). (Adapted from Suit HD, Wette R. Radiation dose fractionation and tumor control probability. Radiat Res. 1966;29:267-281, with permission.) |
Suit and his colleagues, over a period of more than 30 years, have made an extensive study of the response to radiation of a mammary carcinoma in C3H mice. Data from a typical experiment are presented in Figure 21.4. Tumors were propagated by transplanting 4 × 10⁴ cells into the outer portion of the mouse ear, and irradiations were performed when the tumors had grown to a volume of about 4 mm3. A brass circular clamp was fitted across the base of the ear and maintained for at least a minute before the initiation of the irradiation, so that the tumors were uniformly hypoxic. Single-dose, two-dose, and ten-dose experiments were performed, with a 24-hour interval between dose fractions. Tumor control results are shown in Figure 21.4. The TCD50 for a single treatment is 45.75 Gy, rising to 51.1 Gy for 2 fractions and to 84 Gy if the radiation is delivered in 10 equal fractions. This indicates that a marked and extensive repair of sublethal damage has taken place during a multifraction regimen.
▪ DILUTION ASSAY TECHNIQUE
The dilution assay technique was devised by Hewitt and Wilson, who used it to produce the first in vivo survival curve in 1959. They used a lymphocytic leukemia of spontaneous origin in mice. A single-cell suspension can be prepared from the infiltrated liver of an animal with advanced disease and the tumor transplanted by injecting known numbers of cells into the peritoneal cavities of recipient mice, which subsequently develop leukemias. The leukemia can be transmitted, on average, by the injection of only two cells; this quantity—the number of cells required to transmit the tumor to 50% of the animals—is known
as TD50. The dilution assay technique became the basis for obtaining an in vivo cell survival curve.
as TD50. The dilution assay technique became the basis for obtaining an in vivo cell survival curve.
The procedure used, illustrated in Figure 21.5, is as follows. An animal containing the tumor may be irradiated to a given dose of radiation, for example, 10 Gy. A single-cell suspension is then prepared from the infiltrated liver, the cells are counted and diluted, and various numbers of these cells are injected intraperitoneally into groups of recipient animals. It is then a matter of observation and calculation to determine how many irradiated cells are required to produce a tumor in half of the animals inoculated with that given number of cells. Suppose, for instance, that it takes 20 irradiated cells, on average, to transmit the tumor; because it is known that only 2 clonogenic cells are needed to transmit the tumor, it is a simple matter to decide that in the irradiated population of cells,
2 of 20, or 10%, were clonogenic and survived the dose of 10 Gy. That is,
2 of 20, or 10%, were clonogenic and survived the dose of 10 Gy. That is,

 FIGURE 21.5 Schematic representation to show the general features of the dilution assay technique. Various numbers of tumor cells from the donor animal are injected into groups of recipients, and a determination is made of the number of cells required for a tumor to take in half of the animals of the group (TD50). The ratio of this quantity for control and irradiated donors is the surviving fraction. (Adapted from Andrews JR, Berry RJ. Fast neutron irradiation and the relationship of radiation dose and mammalian tumor cell reproductive capacity. Radiat Res. 1962;16:76-81, with permission.) |
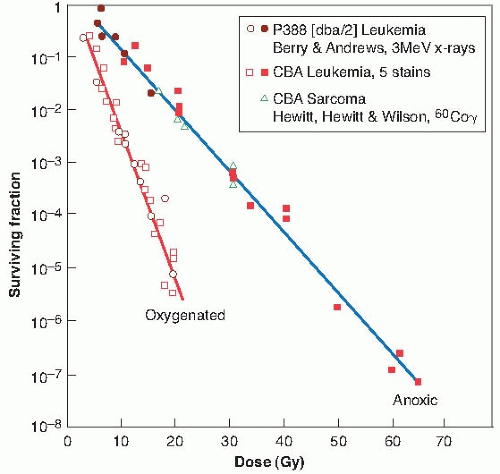 FIGURE 21.6 Dose-response curves in vivo, using the dilution assay technique, for various murine tumors under oxygenated and hypoxic conditions. (Adapted from Berry RJ. On the shape of x-ray dose-response curves for the reproductive survival of mammalian cells. Br J Radiol. 1964;37:948-951, with permission.) |
If this process is repeated for several doses of radiation and the corresponding surviving fractions are determined by this assay technique, a survival curve for cells irradiated and assayed in vivo can be constructed.
This technique is a true in vivo system, but it involves a leukemia as opposed to a solid tumor. The cells, after reinoculation into the mouse, grow in the peritoneal cavity in much the same way that the cells grow in a petri dish in the in vitro


Related posts:
Stay updated, free articles. Join our Telegram channel
Full access? Get Clinical Tree
