Dose-Response Relationships for Model Normal Tissues
▪ DOSE-RESPONSE RELATIONSHIPS
Radiation biology applied to clinical radiotherapy is concerned with the relationship between a given absorbed dose of radiation and the consequent biologic response; of particular interest are factors that modify this relationship. With increasing radiation dose, radiation effects may increase in severity (i.e., grade), in frequency (i.e., incidence), or both. In most cases, it is the relationship between dose and incidence that is important. Such dose-response curves have a sigmoid (S) shape, with the incidence tending to zero as dose tends to zero and the incidence tending to 100% at very large doses. This applies to both tumor control and normal tissue complications.
A simple example is shown in Figure 19.1. Tumor control probability (TCP) is plotted as a function of total dose, and the incidence of normal tissue complications is also plotted as a function of dose. What is illustrated is a favorable situation where the tumor is more radiosensitive than the normal tissue. In the case of tumor control, the shape can be explained solely from the random nature of cell killing (or clonogen survival) after irradiation and the need to kill every single cell to achieve a cure.
For most normal tissue end points, the biologic interpretation of the S shape of the relationship is not obvious. Some researchers have evoked a hypothetical tissue rescue unit (TRU), arguing that tissue breakdown occurs when the number of TRUs falls below a critical level; however, this explanation is questionable.
Therapeutic Ratio (Therapeutic Index)
The ratio of the tumor response for a fixed level of normal tissue damage has been called either the therapeutic ratio or the therapeutic index. In the hypothetical example in Figure 19.1, there is a favorable therapeutic ratio, because a 30% probability of tumor control is possible for a 5% incidence of complications.
The time factor is the one parameter that has been most often manipulated to increase this ratio; hyperfractionation, for example, produces a greater sparing of late-responding normal tissue than tumor control. Another strategy often quoted, although seldom achieved in practice, is to add a drug or radiosensitizer that potentiates the tumor control without potentiating the radiation damage to normal tissue. In practice, it does not need to be as clear-cut as this; it would suffice for the drug to increase tumor control to a greater extent than it increases normal tissue damage. This would result in a therapeutic gain. This is illustrated in Figure 19.2. The addition of the drug moves the tumor control curve to the left farther than the normal tissue damage curve; that is, the drug has greater cytotoxic effect on the tumor than on the normal tissue. Consequently, with the combined modalities, an improved tumor control probability is possible for the same probability of normal tissue injury.
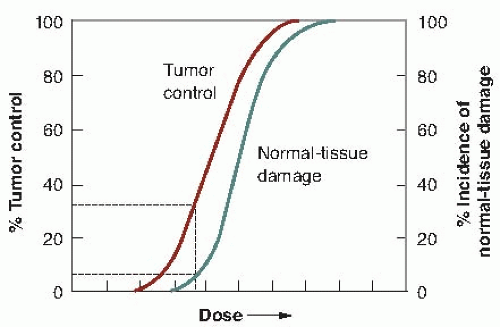 FIGURE 19.1 The dose-response relationship is sigmoid in shape for both tumor control and normal tissue damage. That for normal tissue damage may be steeper than for tumor control. The therapeutic ratio (or index) is the percent of tumor control that can be achieved for a given level of normal tissue damage. In this hypothetical example, about 30% tumor control can be achieved for a 5% incidence of normal tissue damage. |
▪ TYPES OF CELL DEATH: HOW AND WHY CELLS DIE
Mammalian cells exposed to ionizing radiation can die through various mechanisms: mitotic-linked cell death, necrotic cell death, apoptotic cell death, autophagic cell death, and bystander induced cell death. The underlying mechanisms and importance of each of these forms of cell death have been described in Chapters 3, 4, and 18 in detail and will only be briefly reviewed here. Regarding normal tissues that are exposed to ionizing radiation, mitotic-linked cell death and apoptotic cell death have been studied the most and are responsible for most cell killing by ionizing radiation. The other forms of cell death may also contribute to cell killing, but their mechanism and importance are still under investigation. One additional point to consider is that ionizing radiation also induces a form of senescence or permanent growth arrest in which cells are still metabolically active, but reproductively inhibited. This is best exemplified by fibroblasts that when irradiated in cell culture, stay attached to plates for weeks but never divide. However, they are able to secrete growth factors and mitogens that promote the growth of tumor cells. Senescence has been largely studied in cell culture in the laboratory, and only recently has evidence been accumulating that it occurs in tissues. Senescence is also discussed in more detail in Chapter 18.
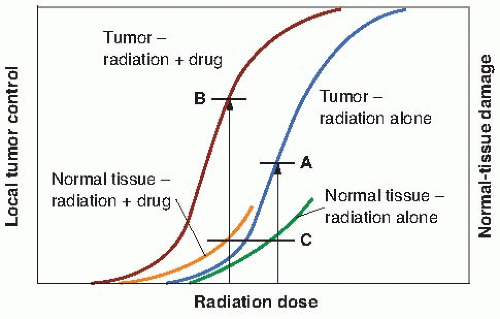 FIGURE 19.2 Illustrating how the addition of a drug, a chemotherapy agent, or a radiosensitizer may improve the therapeutic ratio (therapeutic index). With radiation alone, a given level (A) of tumor control is possible for a maximum tolerable level of normal tissue damage (C). The addition of the drug moves the dose-response curve for both tumor and normal tissue to the left. If the addition of the drug has a greater effect on tumor control than on normal tissue morbidity (i.e., it moves the curve further to the left), then a higher local tumor control (B) is possible for the same level of normal tissue injury (C). |
Most cell lines cultured in vitro die a mitotic death after irradiation; that is, they die attempting to divide. This does not necessarily occur at the first postirradiation mitosis; the cell may struggle through one, two, or more mitoses before the damaged chromosomes cause it to die, attempting the complex task of cell division. Time-lapse films of irradiated cells cultured in vitro clearly show this process of mitotic death, which is the dominant cause of death if reproductive integrity is assessed in vitro as described in Chapter 3.
It is not, however, the only form of cell death. Programmed cell death, or apoptosis, occurs in normal tissues and neoplasms, in mammals and amphibians, in the embryo, and the adult. It is implicated, for example, in tissue involution such as the regression of the tadpole tail during metamorphosis. It is the programmed cell death that is common during embryonic development. It also can occur after irradiation. Apoptosis, like mitosis, comes from the Greek word meaning “falling off,” as of petals from flowers or leaves from trees.
Apoptosis is characterized by a stereotyped sequence of morphologic events, which take place in two discrete phases. In the first phase, cells condense and bud to produce many membrane-enclosed bodies. In the second phase, these bodies are phagocytized and digested by nearby tissue cells. The characteristic “laddering” of DNA that occurs during apoptotic death is illustrated in Chapter 3. Apoptosis characteristically affects scattered individual cells. If apoptosis affects cells in tissues, the resulting apoptotic bodies are squeezed along the intercellular spaces and are either shed from the epithelial surface or rapidly phagocytized by nearby cells. The cells surrounding those being deleted merely close ranks, and there is no tissue disorganization that occurs after necrosis.
Autophagic cell death has been classified with apoptotic cell death but, in fact, is distinct and is controlled by a unique set of genes. Apoptosis and autophagy may be linked because cells defective in some forms of apoptosis exhibit increased levels of autophagy. The term implies that cells cannibalize themselves in the hope of generating adenosine triphosphate (ATP) and macromolecule precursors to survive. Growth factor withdrawal, inhibition of protein synthesis, hypoxia, and ionizing radiation are all potent inducers of autophagy. Although autophagy can be found in cells dying by stress, it is unclear whether it represents a drastic means for the cell to survive by digesting part of itself, or whether it actually promotes cell death. Evidences for both possibilities exist in different cell types and will require further studies to clarify its role in irradiated cells.
Necrotic cell death occurs when cells are devoid of precursors to generate energy, such as glucose, are exposed to decreased pH, or exhibit changes in osmolarity. Ionizing radiation is also able to induce necrotic cell death. It differs from other forms of cell death because it does appear to have a definitive genetic program that controls it, although there have been reports that prove otherwise.
The long-standing concept that ionizing radiation kills cells through direct exposure requires amendment. The demonstration that cells not exposed to ionizing radiation can be killed by being close to irradiated cells has coined the term “bystander induced cell death.” Therefore, the possibility exists that ionizing radiation can influence cell killing outside the field of radiation. This has been experimentally shown for tumors and is known as the abscopal effect. Such effects for normal tissues probably also exist in lymphopenia found after radiotherapy to nonlymphoid organs, and most probably represent an immune response.
▪ ASSAYS FOR DOSE-RESPONSE RELATIONSHIPS
Most experimental techniques are available to obtain dose-response relationships for the cells of normal tissues. First, there are a limited number of clonogenic assays—techniques in which the end point observed depends directly on the reproductive integrity of individual cells. These systems are directly analogous to cell survival in vitro. The techniques developed by Withers and his colleagues are based on their observation of a clone of cells regenerating in situ in irradiated tissue. Skin colonies, regenerating crypts in the jejunum, testes stem cells, and kidney tubules are described briefly later in this chapter. It is also possible to obtain dose-response curves for the cells of the epithelial lining of the colon or stomach, but the method used is essentially the same as for the jejunum. Kember described a system for scoring regenerating clones in cartilage at about the same time as Withers’ skin colony system, but it has not been used widely and is not discussed here.
The assay system for the stem cells in the bone marrow or cells of the thyroid and mammary gland depends on the observation of the growth of clones of cells taken from a donor animal and transplanted into a different tissue in a recipient animal. In Till and McCulloch’s bone marrow assay, colonies of bone marrow cells are counted in the spleens of recipient animals. Dose-response curves for mammary and thyroid cells have been obtained by Gould and Clifton by observing colonies growing from cells transplanted into the fat pads of recipient animals.
Second, dose-response relationships that are repeatable and quantitative, but that depend on functional end points, can be obtained. These include skin reactions in rodents or pigs (e.g., erythema and desquamation), pneumonitis or fibrosis in mouse lungs reflected in an increased breathing rate, myelopathy of the hind limbs from damage to the spinal cord, and deformities
to the feet of mice. The end points observed tend to reflect the minimum number of functional cells remaining in a tissue or organ, rather than the fraction of cells retaining their reproductive integrity.
to the feet of mice. The end points observed tend to reflect the minimum number of functional cells remaining in a tissue or organ, rather than the fraction of cells retaining their reproductive integrity.
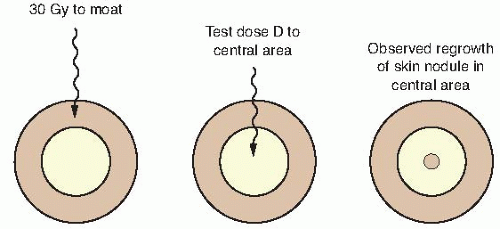 FIGURE 19.3 Technique used to isolate an area of skin for experimental irradiation. A superficial (30 kV) x-ray machine is used to irradiate an annulus of skin to a massive dose of about 30 Gy. An isolated island of intact skin in the center of this “moat” is protected from the radiation by a metal sphere. The intact skin is then given a test dose (D) and observed for nodules of regrowing skin. (Adapted from Withers HR. The dose-survival relationship for irradiation of epithelial cells of mouse skin. Br J Radiol. 1967;40:187-194, with permission.) |
Finally, one can infer a dose-response curve, for a tissue, which cannot be observed directly by assuming the form of the dose-response curve (linear quadratic) and performing a series of multifraction experiments. This procedure, first suggested by Douglas and Fowler, has been used widely to infer values for α and β in the dose-response relationships for normal tissues in which the parameters cannot be measured directly.
This chapter includes assays for both early- and late-responding tissues. The skin, intestinal epithelium, and bone marrow cells, for example, are rapidly dividing self-renewal tissues and respond early to the effects of radiation. The spinal cord, lung, and kidney, by contrast, are late-responding tissues. This reflects the current philosophy that the radiation response of all tissues results from the depletion of the critical parenchymal cells and that the difference in time at which early- and late-responding tissues express radiation damage is a function simply of different cell turnover rates. Many older papers in the literature ascribe the response of late- responding tissues to vascular damage rather than to depletion of parenchymal cells, but this thesis is becoming increasingly difficult to accept.
The various types of normal tissue assay systems are described briefly. The reader who is content with the summary already given may wish to skip the remainder of this chapter.
▪ CLONOGENIC END POINTS
Clones Regrowing In Situ
Skin Colonies
Withers developed an ingenious technique, shown in Figure 19.3, to determine the survival curve for mouse skin cells. The hair was plucked from an area on the back of the mouse, and a superficial x-ray machine was used to irradiate an annulus of skin to a massive dose of 30 Gy. This produced a “moat” of dead cells, in the center of which was an isolated island of intact skin that had been protected during the first exposure to low voltage x-rays by a small metal sphere. This small area of intact skin was then given a test dose (D) and subsequently observed for regrowth of skin. If one or more stem cells survived in this small area, nodules of regrowing skin could be seen some days later. If no cells survived in this small area, the skin would heal much later by infiltration of cells crossing the moat. Figure 19.4 shows nodules regrowing in mouse skin. To obtain a survival curve, it was necessary to repeat this operation with several different areas of skin. A range of ball bearings was used to shield a small area of skin in the middle of the “moat.” The resulting survival data are shown in Figure 19.5 in which the dose (D) to the control area is plotted against the number of surviving cells per square centimeter of skin.
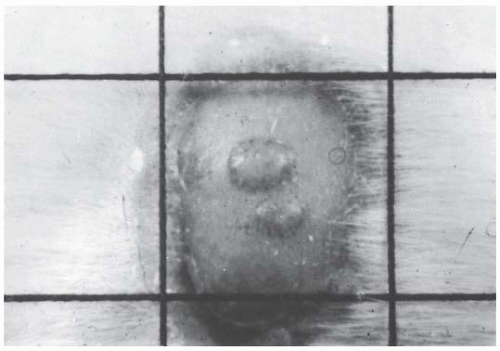 FIGURE 19.4 Photograph of nodules of mouse skin regrowing from a single surviving cell in the treated area. (Courtesy of Dr. H.R. Withers.) |
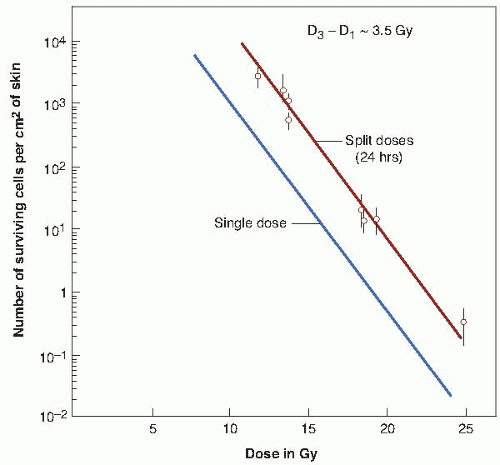 FIGURE 19.5 Single-dose and two-dose survival curves for epithelial cells of mouse skin exposed to 29 kVp x-rays. The 37% dose slope (D0) is 1.35 Gy. The ordinate is not the surviving fraction, as in the survival curves for cells cultured in vitro, but is the number of surviving cells per square centimeter of skin. In the two-dose survival curve, the interval between dose fractions was always 24 hours. The curves are parallel, their horizontal separation being equal to about 3.5 Gy; this corresponds to Dq. From a knowledge of Dq and the slope of the survival curve, D0, the extrapolation number, n, may be calculated. (Adapted from Withers HR. Recovery and repopulation in vivo by mouse skin epithelial cells during fractionated irradiation. Radiat Res. 1967;32:227-239; and Withers HR. The dose-survival relationship for irradiation of epithelial cells of mouse skin. Br J Radiol. 1967;40:187-194, with permission.) |
There are practical limits to the range in which the dose-response relationship can be determined. At one extreme, it is not possible to irradiate too large an area on the back of the mouse to produce the moat of sterilized skin. At the other extreme, the smallest area that can be used is determined by the fact that even 30 kV radiation scatters laterally to some extent. As can be seen in Figure 19.5, the technique results in a single-dose survival curve that extends from about 8 to 25 Gy. Over this range, with dose plotted on a linear scale and number of surviving cells per square centimeter plotted on a logarithmic scale, the survival curve is straight and has a D0 of 1.35 Gy. This D0 value is very similar to that obtained with mammalian cells cultured in vitro.
The extrapolation number cannot be obtained directly with this technique; the ordinate is the number of surviving cells per square centimeter of skin, and this cannot be converted to the surviving fraction because it is not known with any accuracy how many skin stem cells there are per unit area. It is, however, possible to make an indirect estimate of the extrapolation number by obtaining the survival curve for doses given in two fractions separated by 24 hours. The survival curve obtained in this way is also shown in Figure 19.5. It is parallel to that obtained for single doses, but is displaced from it toward higher doses. As explained in Chapter 3, this lateral displacement in a direction parallel to the dose axis is a measure of Dq, the quasithreshold dose. The Dq for mouse skin is about 3.5 Gy, which is very similar to the value for human skin estimated from split-dose experiments.
Crypt Cells of the Mouse Jejunum
A technique perfected by Withers and Elkind makes it possible to obtain the survival characteristics of the crypt cells of the mouse jejunum. The lining of the jejunum is a classic example of a self-renewal system. The cells in the crypts divide rapidly and provide a continuous supply of cells that move up the villi, differentiate, and become the functioning cells. The cells at the top of the folds of the villi are slowly but continuously sloughed off in the normal course of events and are replaced continuously by cells that originate from mitoses in the crypts.
Figure 19.6, an electron micrograph, dramatically shows the three-dimensional structure of the lining of the intestinal epithelium. Mice are given a total body dose of 11 to 16 Gy, which sterilizes a significant proportion of the dividing cells in the crypts, but has essentially no effect on the differentiated cells in the villi. Consequently, crypt degeneration appears early after irradiation, and the villi remain long and their epithelial covering of differentiated cells shows little change. With the further passage of time, the tips of the villi continue to be sloughed away by normal use, but no replacement cells are available from the depopulated crypts, and so the villi begin to shorten and shrink. At sufficiently high doses, the surface lining of the jejunum is completely denuded of villi.
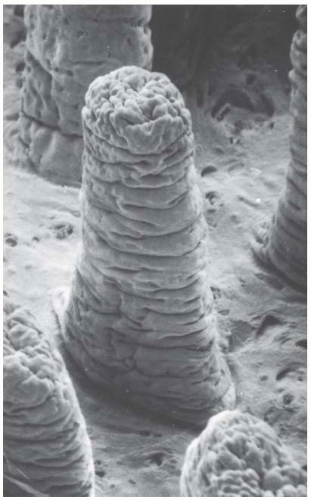 FIGURE 19.6 Scanning electron micrograph that allows three-dimensional visualization of the jejunal villi from the hamster. (Magnification × 175.) (From Taylor AB, Anderson JH. Scanning electron microscope observations of mammalian intestinal villi, intervillus floor and crypt tubules. Micron. 1972;3:430-453, with permission.) |
To obtain a survival curve for the jejunal crypt cells, groups of animals are exposed to graded total body doses of radiation. After 3.5 days, each animal is sacrificed and sections are made of the jejunum (Fig. 19.7A). At this time,
crypts are just beginning to regenerate and it is relatively simple to identify them. Figure 19.7B shows several regenerating crypts at a higher magnification. These pictures also show the shortened villi and the greatly reduced density of cells lining the surface. The score of radiation damage is the number of regenerating crypts per circumference of the sectioned jejunum. This quantity is plotted as a function of dose and yields a survival curve as shown in Figure 19.8. The single-dose survival curve has a D0 (for γ-rays) of about 1.3 Gy. Also shown in Figure 19.8 are survival curves for radiation delivered in multiple fractions, from 2 to 20. The separation between the single-and two-dose survival curves gives a measure of Dq, which has the very large value of between 4 and 4.5 Gy.
crypts are just beginning to regenerate and it is relatively simple to identify them. Figure 19.7B shows several regenerating crypts at a higher magnification. These pictures also show the shortened villi and the greatly reduced density of cells lining the surface. The score of radiation damage is the number of regenerating crypts per circumference of the sectioned jejunum. This quantity is plotted as a function of dose and yields a survival curve as shown in Figure 19.8. The single-dose survival curve has a D0 (for γ-rays) of about 1.3 Gy. Also shown in Figure 19.8 are survival curves for radiation delivered in multiple fractions, from 2 to 20. The separation between the single-and two-dose survival curves gives a measure of Dq, which has the very large value of between 4 and 4.5 Gy.
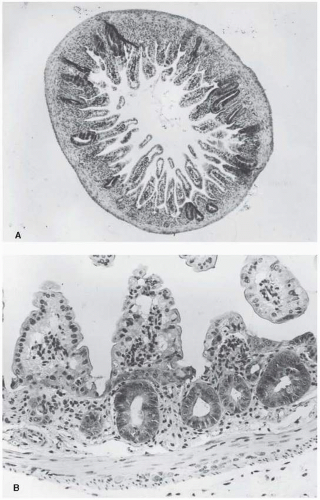 FIGURE 19.7 A: Section of mouse jejunum taken 3.5 days after a total body dose in excess of 10 Gy. Note the shortened villi and the regenerating crypts. B: Regenerating crypts shown at a higher magnification. (From Withers HR. Regeneration of intestinal mucosa after irradiation. Cancer. 1971;28:78-81, with permission.) |
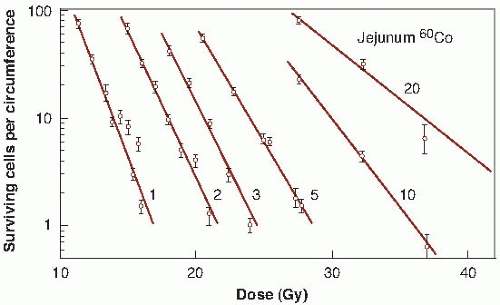 FIGURE 19.8 Survival curves for crypt cells in the mouse jejunum exposed to single or multiple doses of γ-rays (1-20 fractions). The score of radiation damage is the number of surviving cells per circumference (i.e., the number of regenerating crypts per circumference of the sectioned jejunum) counted from sections such as those shown in Figure 19.7. This quantity is plotted on a logarithmic scale against radiation dose on a linear scale. The D0 for the single-dose survival curve is about 1.3 Gy. The shoulder of the survival curve is very large. The separation between the single-dose survival and two-dose survival curves indicates that the Dq is 4 to 4.5 Gy. (Adapted from Withers HR, Mason K, Reid BO, et al. Response of mouse intestine to neutrons and gamma rays in relation to dose fractionation and division cycle. Cancer. 1974;34:39-47, with permission.) |
This technique has two limitations. First, the quantity plotted on the ordinate is the number of surviving crypts per circumference, not the surviving fraction. Second, experiments can be done only at doses of about 10 Gy or more, at which there is a sufficient level of biologic damage for individual regenerating crypts to be identified. The doses can be delivered, however, in several smaller fractions, as long as the total results in sufficient biologic damage to be scored. The shape of the entire survival curve, then, can be reconstructed from the multifraction data if it is assumed that in a fractionated regimen each dose produces the same amount of cell killing and if an estimate is made of the number of clonogens at risk per crypt. This has been done by Withers and his colleagues; the resultant survival curve is shown in Figure 19.9.
Testes Stem Cells
A technique to measure the radiation response of testicular cells capable of sustaining spermatogenesis (i.e., the stem cells) was devised by Withers and his colleagues. About 6 weeks after irradiation, mouse testes are sectioned and examined histologically. Sections of normal and irradiated testes are shown in Figure 19.10. The proportion of tubules containing spermatogenic epithelium is counted and plotted as a function of dose in Figure 19.11. As in many in vivo assays, relatively high single doses
of 8 to 16 Gy are necessary so that the level of damage is sufficient to be scored. In this dose range, D0 is about 1.68 Gy. If the split-dose technique is used, the Dq is about 2.7 Gy. It is possible to estimate the effect of small doses and reconstruct a complete survival curve by giving large doses in multiple small fractions and assuming that the response to each fraction is the same. The result of this reconstruction is shown in Figure 19.12.
of 8 to 16 Gy are necessary so that the level of damage is sufficient to be scored. In this dose range, D0 is about 1.68 Gy. If the split-dose technique is used, the Dq is about 2.7 Gy. It is possible to estimate the effect of small doses and reconstruct a complete survival curve by giving large doses in multiple small fractions and assuming that the response to each fraction is the same. The result of this reconstruction is shown in Figure 19.12.
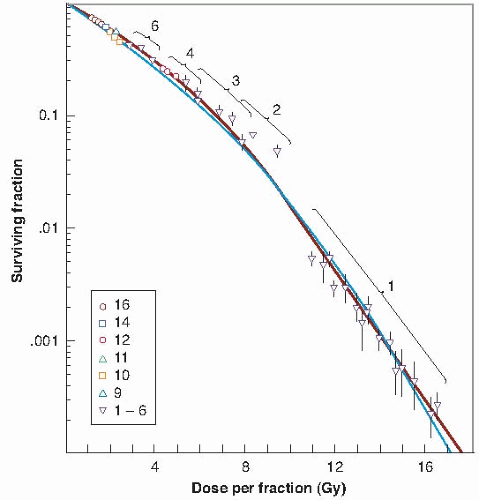 FIGURE 19.9
Get Clinical Tree app for offline access
Related posts:Stay updated, free articles. Join our Telegram channel
Full access? Get Clinical Tree


|