Anatomy
Local surgical and radiological procedures such as tumor ablation, transarterial chemoembolization (TACE), and selective internal radiotherapy (SIRT) require the highly sensitive detection of all existing lesions and their localization to a specific hepatic segment.
The liver is intraperitoneal in its location and is firmly attached to the diaphragm in the bare area on its superior surface. The liver is divided into nine segments. 1, 2, 3 Each of the hepatic segments can be resected individually or in association with other segments. The liver is subdivided by the hepatic veins and portal vein, which run along the segmental boundaries: The main branches of the portal vein divide the liver into upper and lower segments (including segments IVa and IVb), while the hepatic veins define vertical planes of segmental division. The site of portal vein entry into the liver defines the “portal plane” for identifying the upper and lower segments (▶ Fig. 5.1, ▶ Fig. 5.2; see also ▶ Fig. 6.1c).

Fig. 5.1 Segmental anatomy of the liver after Couinaud and Bismuth. (a) Cranial image slice. (b) Axial slices at progressively lower level. Segmental boundaries are defined by the hepatic veins and portal vein branches. (c) Axial slices starting from the liver dome (a) and progressively more caudal levels. Segmental boundaries are defined by the hepatic veins and portal vein branches. (d) Axial slices at progressively higher levels. Segmental boundaries are defined by the hepatic veins and portal vein branches. (e) Axial slices at progressively higher levels. Segmental boundaries are defined by the hepatic veins and portal vein branches. (f) Axial slices at progressively higher levels. Segmental boundaries are defined by the hepatic veins and portal vein branches.

Fig. 5.2 Portal venous vessels. Maximum intensity projection of 3D MRA.
Venous drainage to the hepatic veins occurs between the hepatic segments and lobes, while branches of the hepatic artery, portal vein, and biliary ducts course together at the center of each segment.
5.2 Anatomical Variants
An anomalous location of the liver is found in patients with complete situs inversus or abdominal situs inversus. A more common congenital anomaly is the presence of accessory hepatic lobes. They are often found on the undersurface of the liver, such as an accessory Riedel’s lobe, which is a small inferior projection of the hepatic right lobe.
Rare anatomical anomalies of the liver take the form of agenesis of the left lobe or hypoplasia of the right lobe. It is more common to find hypoplasia of individual segments, however. Segmental hypoplasia is sometimes found in association with diffuse liver diseases such as primary sclerosing cholangitis.
The liver typically derives its arterial supply from the celiac trunk, which divides into the splenic artery, common hepatic artery, and left gastric artery. The common hepatic artery past the origin of the gastroduodenal artery is called the “proper hepatic artery” (▶ Fig. 5.3). It gives rise to the cystic artery and the right and left hepatic arteries, but into the left and right hepatic arteries is found in only about 50% of the population; the remaining 50% show variants in this pattern. Common anatomical variants in the arterial supply of the liver involve the right hepatic artery arising from the superior mesenteric artery, or the left lobe of the liver receiving its supply from a side branch of the left hepatic artery. There are other variants in which the hepatic artery arises directly from the aorta, or the liver is supplied entirely by the superior mesenteric artery.

Fig. 5.3 Visceral arteries. Maximum intensity projection of 3D MRA.
Note
The liver parenchyma receives approximately 75% of its blood supply from the portal venous system and 25% from the hepatic artery.
The dual vascular supply to the liver determines the imaging appearance of the liver after IV injection of contrast medium in all modalities.
5.3 Imaging
5.3.1 Landmarks
Segment I corresponds to the caudate lobe. The falciform ligament divides the left lobe of the liver into a lateral and medial segment. Segments II and III represent the lateral segments of the left lobe, the left portal vein branch separating segment II above from segment III below. The medial segment of the left lobe lies between the left and middle hepatic veins. Occasionally it forms a complete unit, segment IV, but it may also be subdivided into an upper part, designated as segment IVa, and a lower part, designated as segment IVb.
The right lobe of the liver is subdivided into anterior and posterior segments. The right hepatic vein serves as the anatomical landmark that separates the anterior and posterior segments. The right lobe is also subdivided into upper and lower segments, again defined by the portal plane. The anterior superior segment is segment VIII, and the posterior superior segment is segment VII. The lower segments are formed anteriorly by segment V and posteriorly by segment VI.
An easy way to distinguish the right and left lobes of the liver is to imagine a line running from the middle hepatic vein to the gallbladder fossa. Assuming normal liver anatomy, this line defines the boundary between the right and left lobes. It is useful for differentiating the lobes and for quickly assessing the distribution of hepatic lesions as involving just one lobe or both lobes.
The liver is attached to the abdominal wall by the falciform ligament, whose lower portion is called the round ligament of the liver. Embedded in the round ligament is the umbilical vein, which may reopen in response to portal hypertension and hepatic cirrhosis, providing a collateral pathway for blood drainage to subcutaneous veins. The dilated subcutaneous veins in this case are visible externally as the “caput medusae.” The hepatogastric ligament extends broadly from the liver to the lesser curvature of the stomach and constitutes the lesser omentum. The hepatoduodenal ligament extends from the porta hepatis of the liver to the pancreas.
5.3.2 Imaging Techniques
Ultrasonography
Ultrasound is used throughout the world for screening and as the initial modality in the diagnostic algorithm for suspected liver disease because it is noninvasive, widely available, and economical. The liver is easily accessible to ultrasound scanning in almost all patients. The posterior and subdiaphragmatic segments may be difficult to scan, and this limitation reduces the sensitivity of ultrasound imaging in the liver.
Ultrasound contrast agents can be used for the more precise classification of hepatic lesions. They consist of tiny bubbles of a stable, water-insoluble gas. The microbubbles are contained within a delivery material and are 1 to 4 μm in diameter. They oscillate when impinged by an ultrasound pulse, which differentiates them from tissue. Hepatic malignancies are characterized by rapid wash-in and early washout of the contrast agent.
Computed Tomography
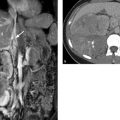
Computed tomography (CT) has the advantage of a short examination time and is the modality of choice for staging. Contrast-enhanced CT scanning of the liver employs a biphasic protocol with an arterial phase 25 seconds after injection of contrast medium and a portal venous phase 60 to 90 seconds after injection (▶ Fig. 5.4). When administration of contrast medium is adjusted for body weight (BW), the administered dose is 0.6 g iodine/kg BW. There is no need to add images without contrast, since calcifications are also visualized in the portal venous phase. Hypervascular and hypovascular lesions can be distinguished by this method (▶ Fig. 5.5). The number of additional lesions detectable on images without contrast is negligibly small. However, unenhanced liver imaging still has a role in patients with a suspected acute hemorrhage.

Fig. 5.4 Phases of liver enhancement in CT. The arterial phase starts approximately 25 seconds after IV injection of contrast medium, the portal venous phase at approximately 60–90 seconds. Equilibrium is established at approximately 3 minutes.

Fig. 5.5 Typical enhancement patterns of hepatic lesions. Hypervascular lesions are hypodense to surrounding parenchyma on unenhanced images. Nevertheless, even large studies indicate that acquisition without contrast medium can detect only an additional 5% of lesions. Hypovascular hepatic lesions are generally indistinguishable from surrounding parenchyma on unenhanced images. Hemangiomas have a pathognomonic enhancement pattern that spreads from the periphery of the lesion toward its center (“iris diaphragm sign”).
If equivocal findings warrant further investigation or if an elective examination of the liver is required then MRI is used, but CT is still the first-line modality for acute disorders ranging from liver injuries and hemorrhage to sepsis with abscess formation.
Magnetic Resonance Imaging
When used electively, magnetic resonance imaging (MRI) permits a detailed analysis of hepatic lesions. MRI without contrast permits the detection of blood, fat, or an inhomogeneous cellular structure; or the upper abdomen can be investigated by dynamic contrast-enhanced MRI. This technique can differentiate between arterial hypervascular and hypovascular lesions and can identify lesions that show persistent delayed enhancement (▶ Fig. 8.4, ▶ Fig. 8.5 ). Hepatobiliary contrast agents have provided a new tool for the characterization of hepatic lesions. This technique can supply information on the presence of functional hepatocytes within a lesion from 20 to 60 minutes after injection of the contrast agent (see ▶ Liver-Specific Contrast Agents ). This cannot be done with CT. 4
Contrast-enhanced MRA is also excellent for evaluating vascular anatomy. The arterial, venous, and portal venous anatomy of the liver can be visualized with this technique (▶ Fig. 5.4, ▶ Fig. 5.5).
Unenhanced Imaging Techniques
MRI of the liver without the use of contrast medium is based on T1W and T2W sequences. The standard sequences are supplemented by chemical shift techniques such as the opposed-phase sequence and fat-suppressed sequences. 5 These sequences are used to detect or exclude fatty infiltration of the liver and to evaluate the proportion of fat within focal hepatic lesions (▶ Fig. 5.6).

Fig. 5.6 Chemical shift technique for determining the proportion of intrahepatic or intralesional fat. (a) T2W HASTE sequence of the upper abdomen showing the liver, spleen, and pancreas. (b) T1W in-phase VIBE sequence. (c) T1W opposed-phase VIBE sequence. (d) Fat-suppressed T1W Dixon sequence. HASTE, half-Fourier acquisition single-shot turbo spin-echo. VIBE, volume-interpolated breath-hold examination.
Diffusion-weighted imaging (DWI) is a noncontrast technique that is used increasingly in the characterization of hepatic lesions. The b values in DWI can be varied to supply information on the restriction of proton diffusion. 5 Simply put, restricted diffusion within a focal liver lesion is suggestive of malignancy, whereas focal liver lesions that do not show restricted diffusion are likely to be benign. Additional computation of the apparent diffusion coefficient (ADC) values improves the accuracy of characterization of lesions, since benign lesions may also show restricted diffusion at higher b values (▶ Fig. 5.7).

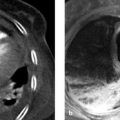
Fig. 5.7 Diffusion-weighted imaging (DWI) of focal hepatic lesions. From left to right, each row shows DW images acquired at b values of 50, 400, and 800 and the corresponding apparent diffusion coefficient (ADC) map at far right. While the metastasis shows definite hyperintensity even at high b values, the hepatic cyst is isointense to surrounding liver parenchyma at high b values. The metastasis is hypointense in the ADC map, while the cyst is hyperintense. (a) Hepatic metastasis (arrows) from a neuroendocrine tumor. (b) Hepatic cyst (arrows).
Contrast-Enhanced Imaging Techniques
In dynamic contrast-enhanced T1W imaging of the liver, just as in CT, images are acquired during various phases of hepatic perfusion. Normal liver tissue, as mentioned, receives up to 75% of its blood flow from the portal vein and only about 25% from the hepatic artery. These percentages are often reversed in primary and secondary liver tumors. The predominantly arterial blood supply to liver tumors is exploited in transarterial chemoembolization (TACE), in which the tumor is selectively treated by advancing angiographic catheters directly to the lesion via the hepatic artery and hepatic segmental arteries.
Note
For the most accurate lesion characterization, the liver MRI protocol should include at least one acquisition each in the arterial phase, portal venous phase, and equilibrium phase (▶ Fig. 5.8). Each of the dynamic sequences should require no more than a 20-second breath hold. 6, 7

Fig. 5.8 Dynamic contrast-enhanced imaging of the upper abdomen. Dynamic fat-suppressed T1W VIBE sequence after a bolus injection of Gd-BOPTA at 0.05 mmol/kg BW (a) Arterial phase. (b) Portal venous phase. (c) Equilibrium phase.
During the equilibrium phase, the T1W sequences should be supplemented by the acquisition of fat-suppressed T1W sequences to detect special phenomena such as a pseudocapsule or delayed enhancement in tumor areas that have undergone desmoplastic change.
Liver-Specific Contrast Agents
Modern hepatobiliary contrast agents permit liver evaluation in a “hepatocyte-specific” phase. 8, 9 During this phase the contrast agent is taken up by functioning hepatocytes and excreted in the bile. Thus, hepatobiliary agents can be used to detect the presence of functional hepatocytes within a lesion and also to assess the biliary tract. Liver lesions that do not contain hepatocytes, such as metastases, typically are not enhanced by hepatobiliary agents; liver masses of primary hepatocellular origin, such as focal nodular hyperplasia, take up more contrast agent than normal liver parenchyma. 10, 11
Both T1W and fat-suppressed T1W sequences can be acquired during the hepatobiliary phase of contrast excretion. As in the noncontrast sequences, there is no need for rapid acquisition, so sequences with high contrast and high resolution can be acquired (▶ Fig. 5.9).

Fig. 5.9 Liver imaging in the hepatobiliary phase of contrast excretion. Dynamic fat-suppressed T1W VIBE sequence after bolus injection of 0.05 mmol/kg BW. Gd-BOPTA contrast medium. (a) T1W image of the upper abdomen before injection of contrast medium. (b) Fat-suppressed T1W image of the upper abdomen 45 minutes after the injection of 0.05 mmol/kg BW Gd-BOPTA. Although hepatic metastases are already visible in the precontrast image, they are more conspicuous in the contrast-enhanced image, which reveals multiple additional lesions.
Hepatobiliary contrast agents in current use include Gd-BOPTA and Gd-EOB-DTPA (gadoxetalate). 4, 12 Gd-BOPTA is administered at a dose of 0.05 to 0.10 mmol/kg BW, Gd-EOB-DTPA at a dose of 0.025 mmol/kg BW. Both agents are partially taken up by hepatocytes and excreted in the bile. Gd-EOB-DTPA provides a higher percentage uptake, at approximately 50% of the injected dose, and it undergoes faster biliary excretion than Gd-BOPTA. 13 With Gd-EOB-DTPA, hepatobiliary phase images can be acquired just 10 to 15 minutes after injection of contrast medium. When Gd-BOPTA is used, much less of the contrast agent is eliminated with the bile (only 3–5%), and it takes at least 45 minutes until hepatobiliary phase images can be acquired. 9
Both Gd-BOPTA and Gd-EOB-DTPA permit dynamic imaging studies of the liver, similar to extracellular contrast agents, and the liver can additionally be evaluated in the hepatobiliary phase during excretion of the contrast agent with the bile.
Extracellular Contrast Agents
Besides liver-specific agents, extracellular contrast agents are also available. Typically they are administered at a dose of 0.1 mmol/kg BW. Examples are Gd-DTPA, gadoterate meglumine, gadoteridol, and gadobutrol. These agents can be used for dynamic contrast-enhanced imaging of the liver in the arterial, portal venous, and equilibrium phases. 14
5.4 Vascular Diseases
5.4.1 Portal Vein Thrombosis
Brief definition The etiology of portal vein thrombosis is described by the classic Virchow’s triad, i.e., decreased blood flow within the vessel, an alteration in the viscosity or cellularity of the blood, and endothelial injury or dysfunction. 15 Typical Causative factors for portal vein thrombosis are
Slow blood flow in a setting of hepatic cirrhosis.
Vascular stenosis due to pulmonary hilar lymphadenopathy.
Invasion of the portal vein by a malignant tumor.
Inflammatory changes relating to pancreatitis.
Ascending and sclerosing cholangitis.
Abdominal infections in general.
Polycythemia vera.
Obstruction by benign masses.
A typical cause of portal vein thrombosis in small children is the infection of an umbilical vein catheter. In cases of complete portal vein thrombosis, perfusion of the portal vein is maintained by periportal collateral veins. Extensive collaterals may develop in response to long-standing portal vein thrombosis, the most pronounced form being cavernous transformation of the portal vein, a spongelike plexus of many small, tortuous venous channels. Occasionally this condition may be mistaken for a patent portal vein on ultrasound examination.
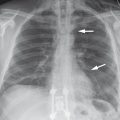
Imaging signs Portal vein thrombosis is detectable sonographically by the absence of a Doppler signal and increased echogenicity in the vessel lumen. The thrombus can be directly visualized by CT, appearing as an intraluminal filling defect (▶ Fig. 5.10). Tumor thrombi may show enhancement in the portal venous phase. MRI is a noninvasive means of evaluating portal venous blood flow and the presence of partially occlusive intraluminal thrombi and collateral circulation. 16 Portal vein patency can be assessed even without contrast medium. Unlike ultrasound, MRI is not restricted by obesity, ascites or abdominal air, and therefore MRI supplies more diagnostic information than duplex ultrasound. Portal vein patency can be quickly evaluated in an SE sequence that demonstrates a flow void within the vessel. One potential pitfall is that turbulence at the confluence of the splenic vein and mesenteric veins may create an intraluminal signal. If portal vein thrombosis is present, the signal within the portal vein is typically isointense or slightly hyperintense to liver parenchyma in the T1W image and hyperintense in the T2W image (▶ Fig. 5.11). A diagnosis of portal vein thrombosis on unenhanced images is likely if a signal abnormality is found in the same area and has approximately the same size in all sequences. Suspected portal vein thrombosis can be confirmed or excluded by also acquiring flow-sensitive GRE images. 17 Administration of contrast medium can also be used to provide detailed views of small mural thrombi and of the collateral channels associated with cavernous transformation (▶ Fig. 5.12).

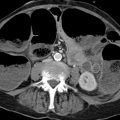
Fig. 5.10 Portal vein thrombosis. Postcontrast CT shows a thrombus outlined by contrast medium (a, b) and invasion of the portal vein by hepatocellular carcinoma with intravascular tumor growth (c, d). Portal vein enlargement extends to the periphery. (a) Axial image of the porta hepatis. (b) Coronal reformatted image of the portal vein. (c) Axial image of carcinoma invading the portal vein. (d) Coronal reformatted image of carcinoma invading the portal vein.

Fig. 5.11 Acute portal vein thrombosis. (a) Axial HASTE sequence shows markedly increased signal intensity in the portal vein (arrow; compare with flow void in the inferior vena cava). (b) Corresponding contrast-enhanced fat-suppressed T1W sequence shows the nonenhancing thrombus (arrow).

Fig. 5.12 Portal vein thrombosis. Cavernous transformation with multiple small collaterals detected about the porta hepatis (arrows). (a) Scan through the upper portion of the porta hepatis. (b) Midlevel scan through the porta hepatis. (c) Scan through the lower portion of the porta hepatis. The portal vein is occluded.
Clinical features Incomplete portal vein thrombosis often goes unnoticed. Complete portal vein thrombosis leads to prehepatic portal hypertension, and the associated collateral flood flow produces symptoms. Bleeding esophageal varices may occur, and ascites may develop.
Differential diagnosis It is important in portal vein thrombosis to differentiate a thrombus from invasion of the portal vein by a tumor, as hepatocellular carcinoma has a propensity for vascular invasion.
Key points Ultrasound, CT, and MRI are all suitable modalities for the diagnosis of portal vein thrombosis. Tumor thrombi enhance after IV administration of contrast medium.
5.4.2 Budd–Chiari Syndrome
Brief definition Budd–Chiari syndrome is caused by the obstruction of venous outflow from the sinusoidal bed of the liver. Both the large and small hepatic veins may be affected. The syndrome leads to portal hypertension, ascites, and progressive liver failure. 18, 19 Budd–Chiari syndrome typically involves an obstruction of the large hepatic veins, usually at the confluence of the hepatic veins, with or without associated thrombosis of the intrahepatic segment of the inferior vena cava. This contrasts with veno-occlusive disease, which is characterized by obstruction of the small intrahepatic veins, often with continued patency of the large hepatic veins. 20 When Budd–Chiari syndrome is suspected, therefore, it is important to evaluate for possible inferior vena cava thrombosis during imaging.
Imaging signs Typical morphological signs of Budd–Chiari syndrome are as follow (▶ Fig. 5.13):
Marked swelling and rounding of the liver borders in the T2W image, and increased signal intensity of the liver.
Complete obstruction of the hepatic veins at the level of their confluence, with or without associated inferior vena cava thrombosis.
Sparing of hepatic segment 1, which typically has its own venous drainage.
Markedly delayed perfusion of the liver, typically affecting the peripheral portions of the liver parenchyma more than the center. Also, the arterial supply to the peripheral liver parenchyma is increased because the portal-vein perfusion pressure is no longer adequate to supply those regions.

Fig. 5.13 Budd–Chiari syndrome of the liver. Marked ascites is present during the acute phase (a–c). (a) T2W image shows marked swelling of the liver. The hepatic veins are not visualized. (b) T1W image in the arterial phase after injection of contrast medium. The liver parenchyma shows only faint enhancement due to increased intrahepatic resistance. (c) T1W image in the portal venous phase after injection of contrast medium. Arterial perfusion is noted, and the liver parenchyma shows marked peripheral hypoperfusion in segment VII. (d) T1W image 15 minutes after injection of contrast medium still shows peripheral hypoperfusion in segment VII (arrows).
Long-standing Budd–Chiari syndrome may give rise to intrahepatic venous collaterals in the upper part of the liver. Regenerating nodules are also found. 21
Clinical features The obstruction of hepatic venous outflow leads to hepatomegaly. Liver failure may occur in the acute stage. Portal hypertension leads to ascites and collateralization. Chronic cases gradually progress to hepatic cirrhosis with associated symptoms.
Differential diagnosis Imaging features similar to those described above are seen in hepatic veno-occlusive disease, which is distinguished from Budd–Chiari syndrome by the occlusion of small postsinusoidal hepatic veins while the large hepatic veins remain patent. This disease is more commonly associated with chemotherapy, especially in patients who have undergone bone marrow transplantation. A pure radiological diagnosis is difficult, but a presumptive diagnosis can be made based on the similarity of parenchymal changes to those in Budd–Chiari syndrome. The diagnosis is confirmed by liver biopsy.
Key points Budd–Chiari syndrome is characterized by the obstruction of hepatic venous outflow, leading to posthepatic portal hypertension. Patients develop ascites and collaterals, and chronic cases gradually progress to cirrhosis.
5.4.3 Rendu–Osler–Weber Disease
Brief definition Rendu–Osler–Weber disease (synonym: hereditary hemorrhagic telangiectasia) is an autosomal dominant disorder characterized by a defect in transforming growth factor-beta (TGF-β). This leads to the development of arteriovenous malformations and telangiectasias. Four diagnostic criteria for Rendu–Osler–Weber disease have been described:
Epistaxis.
Multiple telangiectasias on the lips, tongue, fingers, or nose.
Visceral arteriovenous malformations (in the lung, liver, brain, and spine).
A first-degree relative with the disease.
The diagnosis is classed as likely if two of these criteria are present, and as definite if three or four criteria are present. Five different phenotypes are known, and the genetic mutation site has been identified for three of them. The phenotypes differ in the location of the arteriovenous fistulas (▶ Table 5.1). The HHT 1 and 2 phenotypes are characterized by the presence of hepatic arteriovenous malformations.
Phenotype | Mutation (gene) | Features |
HHT1 | ENG | Most common form; pulmonary arteriovenous malformation |
HHT2 | ALK1 | Phenotype, pulmonary arteriovenous malformation rare |
HHT3 | Unknown | Hepatic arteriovenous malformation, pulmonary arteriovenous malformation |
HHT4 | Unknown | Arteriovenous malformation in lung/brain |
JPHT | SMAD4 | Arteriovenous malformation variable, juvenile polyposis |
Abbreviations: HHT, hereditary hemorrhagic telangiectasia. JPHT, juvenile polyposis/hereditary hemorrhagic telangiectasia syndrome. | ||
Imaging signs The hepatic veins are markedly dilated due to the arteriovenous shunting of blood. The liver may be enlarged. The arteriovenous malformations show intense contrast enhancement, similarly to the vessels, and appear as well-circumscribed round or tubular structures (▶ Fig. 5.14). The hepatic artery is usually hypertrophic. Because of the arteriovenous shunt, the hepatic veins show very early enhancement during the arterial phase.

Fig. 5.14 Multiple intrahepatic arteriovenous malformations in Rendu–Osler–Weber disease. (a) Arterial phase. Early enhancement of the hepatic veins occurs due to multiple arteriovenous fistulas. (b) Coronal reformatted image shows the hypertrophic hepatic artery and its branches. (c) Portal venous phase. The liver parenchyma typically shows only faint enhancement. The multiple arteriovenous malformations appear as well-circumscribed round or tubular structures. (d) Coronal reformatted image shows dilatation of the hepatic veins.
Clinical features Patients exhibit rapid fatigability due to the arteriovenous shunt. Heart failure may develop. From 30 to 50% of all patients suffer one or more transient ischemic attacks or stroke. An additional 10% of patients develop a brain abscess.
Key points Arteriovenous malformations may be present in Rendu–Osler–Weber disease, depending on the phenotype. They are detectable by ultrasonography, CT, and MRI. The hepatic veins show early enhancement after IV administration of contrast medium.
5.5 Focal Hepatic Lesions
Hepatic lesions are classified according to their histological origin. Three main categories are primary hepatic lesions, secondary hepatic lesions, and pseudolesions. Primary hepatic lesions can be subdivided further into mesenchymal, hepatocytic, and cholangiocytic lesions. Each of these subdivisions includes both benign and malignant lesions, and their imaging features may overlap. The accurate characterization of primary focal hepatic lesions requires a comprehensive review of all findings, including precontrast images, dynamic contrast-enhanced images, and hepatobiliary-phase images. The following techniques are utilized for these:
Unenhanced T2W sequences.
Unenhanced T1W sequences.
Dynamic T1W imaging with extracellular contrast agents.
Hepatobiliary T1W imaging with liver-specific contrast agents.
Initial lesion characterization is based upon findings detected on unenhanced MRI. The presence of intralesional fat, high T2W or T1W signal intensity, and other factors are useful for narrowing the differential diagnosis. The unenhanced MRI features of various focal hepatic lesions are reviewed in ▶ Fig. 5.15 and ▶ Fig. 5.16.

Fig. 5.15 Differential diagnosis of focal hepatic lesions based on signal intensity in T1-weighted MRI.

Fig. 5.16 Differential diagnosis of focal hepatic lesions based on signal intensity in T2-weighted MRI.
Dynamic images acquired in the arterial, portal venous, and equilibrium phases after injection of contrast medium are also useful for the classification of focal hepatic lesions. Arterial-phase imaging is particularly useful as it differentiates arterial hypervascular and hypovascular lesions and also identifies lesions that show delayed, persistent enhancement. The flowcharts in ▶ Fig. 5.17, ▶ Fig. 5.18, and ▶ Fig. 5.19 show how these features can be used for characterization of lesion.

Fig. 5.17 Differential diagnosis of arterial hypervascular hepatic lesions.

Fig. 5.18 Differential diagnosis of arterial hypovascular hepatic lesions.

Fig. 5.19 Differential diagnosis of hepatic lesions showing persistent enhancement on delayed images.
Additionally, hepatobiliary contrast agents can be used to detect the presence of functional hepatocytes within a hepatic lesion. Lesions that do not contain functioning hepatocytes are not enhanced by these agents in the hepatocyte-specific biliary phase. ▶ Fig. 5.20 shows how these MRI criteria are applied in the differential diagnosis of focal hepatic lesions.

Fig. 5.20 Differential diagnosis of focal hepatic lesions in the hepatobiliary phase after injection of Gd-BOPTA or Gd-EOB-DTPA contrast media.
5.5.1 Primary Hepatic Lesions
Mesenchymal Lesions
Benign Mesenchymal Tumors
Hepatic Hemangioma
Brief definition The most common mesenchymal hepatic lesions, and the most common true focal hepatic lesions in general, are hemangiomas, which may occur in a cavernous or capillary form. The incidence of hepatic hemangioma is up to 20% in the normal population, based on various sources in the literature. An association with focal nodular hyperplasia is observed in 15 to 20% of cases. 22 Two main types are distinguished:
Pediatric hepatic hemangioma: Lesions of this type often undergo spontaneous regression. Solitary hepatic hemangioma is a somewhat unusual finding in the pediatric age group. It is more common to find multiple hemangiomas in association with viscerocutaneous hemangiomatosis. These cases may develop right heart failure due to the functional left-to-right shunt and will require chemotherapy for primary benign hemangiomatosis.
Adult hepatic hemangioma: Lesions of this type may be solitary or multiple and are usually asymptomatic. Patients may occasionally become symptomatic due to thrombosis or hemorrhage, although hemorrhage is very rare.
Hemangiomas typically present as well-defined lesions ranging from a few millimeters to 20 or 30 cm in size. 23 Hemangiomas larger than 10 cm are called “giant hemangiomas.” Microscopically, hemangiomas consist of multiple vascular channels with a single layer of endothelial cells. Larger lesions almost always have a heterogeneous tissue composition with areas of fibrosis, necrosis, cystic changes, and occasional coarse intratumoral calcifications.
Imaging signs Hemangiomas appear sonographically as hyperechoic lesions with well-defined margins (▶ Fig. 5.21). Cavernous hemangiomas show an almost pathognomonic enhancement pattern on CT: The enhancement is intense, comparable to that of major vessels. The enhancement pattern is called “lacunar” for its resemblance to tiny lakes. On delayed images the hemangioma shows progressive centripetal enhancement spreading from the periphery toward the center (▶ Fig. 5.22). On T1-weighted MRI, the lesions appear as hypointense masses with a round or lobulated shape that are sharply demarcated from surrounding liver tissue. T2W sequences show very high signal intensity that is homogeneous in small hemangiomas and inhomogeneous in larger lesions. 24 Imaging with an extracellular gadolinium-based contrast agent demonstrates lacunar enhancement in the arterial phase. Later images show an iris diaphragm sign similar to that seen on CT (▶ Fig. 5.23). 25 Images in the equilibrium phase show more or less complete, homogeneous uptake in the lesion, depending on the size of the hemangioma and the presence or absence of central fibrotic changes (▶ Fig. 5.24). 26 Capillary hemangiomas show a different enhancement pattern on both CT and MRI: these lesions already show marked, homogeneous enhancement in the early arterial phase (▶ Fig. 5.25); but unlike lesions such as focal nodular hyperplasia and hepatocellular adenoma or carcinoma, which also show arterial hypervascularity, capillary hemangiomas show high T2W signal intensity and a persistence of enhancement in the portal venous and equilibrium phases.

Fig. 5.21 Hemangioma. Ultrasound displays the hemangioma as a hyperechoic mass with well-defined margins.

Fig. 5.22 Cavernous hemangioma. (a) On CT before injection of contrast medium, the hemangioma is isoattenuating to the vena cava. (b) Arterial phase. The hemangioma shows a lacunar enhancement pattern from the periphery to the center. (c) Centripetal spread of enhancement, called the iris diaphragm sign, continues in the portal venous phase.

Fig. 5.23 Cavernous hemangioma in an asymptomatic patient. (a) T2W image shows a hyperintense, sharply circumscribed lesion with homogeneous internal signal intensity. (b) T1W image. The lesion appears uniformly hypointense. (c) T1W image in the arterial phase after injection of contrast medium. The lesion shows nodular rim enhancement. (d) T1W image in the portal venous phase after injection of contrast medium shows spreading enhancement. (e) T1W image in the equilibrium phase after injection of contrast medium shows almost complete enhancement of the hemangioma (iris diaphragm sign).

Fig. 5.24 “Giant hemangioma” in the right lobe of the liver. (a) T2W image shows inhomogeneous hyperintensity. (b) T1W image 15 minutes after injection of contrast medium. Enhancement is still inhomogeneous, consistent with the presence of central fibrotic components.

Fig. 5.25 Capillary hemangioma. (a) Arterial phase. The hemangioma shows intense enhancement. (b) Portal venous phase. The hemangioma has become isointense to surrounding parenchyma.
Note
Hemangiomas occasionally show a “shine through” effect on diffusion-weighted imaging. This means that the lesion, even when imaged at high b values, shows a high signal consistent with restricted diffusion. This effect is based on high T2W signal intensity that “shines through” to the diffusion-weighted image. Viewed in isolation, this property is characteristic of a malignant hepatic lesion, but when combined with high signal intensity in the ADC map it is more suggestive of hemangioma than malignancy. 27
Clinical features Hemangiomas are generally asymptomatic and are detected incidentally. Differentiation from other hepatic lesions is necessary.
Key points Cavernous hemangiomas have a pathognomonic enhancement pattern after IV injection of contrast medium. Capillary hemangiomas are difficult to distinguish from malignant hypervascular tumors and metastases on CT but are more accurately characterized by MRI.
Lipomatous Masses
Brief definition Lipomatous masses constitute another group of benign mesenchymal liver tumors. Benign hepatic tumors that are composed partially or entirely of fat cells are lipomas, angiomyolipomas, myolipomas, and angiomyelolipomas. 28 Most lipomatous tumors are solitary, round, sharply circumscribed masses that occur in noncirrhotic livers. They contain variable proportions of fat, smooth muscle tissue, and thick-walled blood vessels. Hematopoietic components may also be present, in which case the term “myelolipoma” or “angiomyelolipoma” is used. Angiomyolipomas are rare, usually asymptomatic solid tumors. Multiple angiomyelolipomas, which are sometimes symptomatic and show progressive growth, may be found in patients with Bourneville–Pringle syndrome.
Imaging signs On CT, angiomyolipomas show areas of fat attenuation along with intensely enhancing areas and areas of intermediate density (▶ Fig. 5.26). Their signal intensity on MRI reflects the tumor composition, and masses with predominantly lipomatous components have high signal intensity on both T1W and T2W images (▶ Fig. 5.27). By contrast, lipomatous masses with a dominant vascular or smooth muscle component will have low T1W signal intensity and intermediate T2W signal intensity. A presumptive diagnosis can be confirmed by fat-suppressed T1W sequences and opposed-phase sequences to guide the detection of fat cells within the mass. 29, 30

Fig. 5.26 Angiomyolipomas in segments I, VII, and VIII. (a) Arterial phase. (b) Portal venous phase. The angiomyolipomas show mixed density with large components of fat attenuation.

Fig. 5.27 Angiomyolipoma in the left lobe of the liver. Lipomatous components are predominant in this lesion. (a) T2W image. The mass shows high signal intensity (arrow). (b) T1W image. The mass also appears hyperintense in this sequence. (c) Fat-suppressed T1W image shows a marked loss of signal intensity. (d) Opposed-phase sequence does not show significant signal loss because the lesion consists mostly of fat cells. (e) Fat-suppressed T1W image after injection of contrast medium. The lesion shows virtually no enhancement.
Clinical features Patients are generally asymptomatic. Symptoms result from intratumoral hemorrhage, which may lead to sudden pain or, in the case of capsular rupture, to hemoperitoneum and shock.
Key points Hepatic lipomas are rare tumors. As in the kidney, their imaging appearance is that of a mixed tumor with fatty components, vessels, and smooth muscle.
Hepatic Cysts
Brief definition Hepatic cysts are fluid-filled cavities lined with a single layer of epithelium. They are present in up to 10% of the population, so they are a common imaging finding. The etiology and pathogenesis of solitary hepatic cysts are not fully understood and it is also uncertain whether they are congenital lesions or true neoplasms.
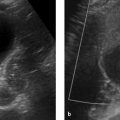
Imaging signs When imaged with ultrasound, cysts are echo-free and have smooth margins (▶ Fig. 5.28). They are associated with posterior acoustic enhancement. Because ultrasound waves travel freely through the cyst and are not reflected as they are in the liver parenchyma, they are less attenuated at the far end of the liver than in the adjacent parenchyma. This causes the parenchyma behind the cyst to appear more echogenic, creating the impression of acoustic enhancement in that area. Cysts also have smooth margins on CT and do not enhance after IV injection of contrast medium. Simple cysts have an attenuation of approximately 10 HU (▶ Fig. 5.29). In rare cases, larger cysts may show intralesional hemorrhage producing an inhomogeneous signal pattern. Typically the lesions are hypointense with well-defined margins on T1W images and are uniformly hyperintense on T2W images. Postcontrast images show unchanged arterial vascularity around the cysts, and no enhancement occurs in the cyst wall or in the lesions themselves (▶ Fig. 5.30). This is an important aid to differential diagnosis as it excludes lesions such as hepatic abscess, parasitic cysts, and biliary hamartomas, which show peripheral rim enhancement.

Fig. 5.28 Hepatic cyst. The cyst is echo-free and has smooth margins. Posterior acoustic enhancement occurs at the far side of the cyst (arrow) because the cyst causes less sound attenuation than the surrounding tissue.

Fig. 5.29 Hepatic cyst. (a) CT before injection of contrast medium shows a well-circumscribed mass of water attenuation. (b) Arterial phase. (c) Portal venous phase. (d) Equilibrium phase. The cyst is nonenhancing in all phases.

Fig. 5.30 Multilocular hepatic cysts in a patient with polycystic kidney disease. (a) T2W image shows innumerable, diffusely distributed hepatic cysts with homogeneous high signal intensity. (b) Fat-suppressed T1W image after injection of contrast medium. The liver parenchyma enhances without appreciable enhancement of the cyst walls or the cysts themselves.
Clinical features Cysts are asymptomatic. Very large cysts may cause a pressure sensation in the upper abdomen.
Differential diagnosis The differential diagnosis includes echinococcal cysts and cystic tumors.
Key points Hepatic cysts are present in approximately 10% of the population and are usually asymptomatic. On ultrasound, simple cysts are echo-free and show posterior acoustic enhancement. Cysts show smooth, nonenhancing walls on CT and have an attenuation of approximately 10 HU. On MRI, cysts are hyperintense in T2W sequences and are hypointense and nonenhancing in T1W sequences.
Benign Mesenchymal Tumors in Children
Brief definition Benign mesenchymal tumors that occur exclusively in children include infantile hemangioendothelioma and mesenchymal hamartoma:
Infantile hemangioendothelioma: This is the most common benign liver tumor in the pediatric age group. 31 It is a vascular tumor derived from endothelial cells that proliferate in the form of vascular channels. Infantile hemangioendothelioma is responsible for approximately 10 to 15% of all liver tumors in children. Approximately 90% of infantile hemangioendotheliomas are detected during the first 6 months of life. They are usually multiple or diffuse; a solitary lesion is a somewhat unusual variant.
Mesenchymal hamartoma: These entities comprise approximately 10% of all liver tumors in children. Mesenchymal hamartoma probably represents a localized abnormality of embryonic development that persists after birth. Histologically, mesenchymal hamartomas are composed of mesenchymal tissue and bile ducts, so that the tumors contain cystic components with internal septa. Accordingly, mesenchymal hamartoma is considered more a benign cystic malformation than a true neoplasm. 32 Mesenchymal hamartomas resolve spontaneously in most cases, although there have been sporadic reports of malignant transformation to sarcoma. Mesenchymal hamartomas occur exclusively in young children (average age 15 months). Progressive abdominal distention may occur, depending on tumor size. Because imaging cannot positively differentiate mesenchymal hamartoma from other liver tumors (hepatoblastoma, embryonic sarcoma, hepatocellular carcinoma), histological confirmation is always required.
Imaging signs
Infantile hemangioendothelioma: Hemangioendotheliomas appear very echogenic on ultrasound (▶ Fig. 5.31). The presence of vascular channels and cystlike components with well-defined margins explains the hypointense pattern in T1W images. The lesions usually show homogeneous hyperintensity in T2W sequences, similarly to hemangiomas, although small areas of intralesional hemorrhage, thrombosis, fibrosis, or calcifications may create low T2W signal intensity. Postcontrast images show an inhomogeneous pattern with mainly peripheral enhancement that fills in toward the center (▶ Fig. 5.32). Incomplete filling in the equilibrium phase indicates central regressive changes.
Mesenchymal hamartoma: Mesenchymal hamartomas show mixed echogenicity at ultrasound. Cystic components are usually present, although the tumor may be completely solid. Ultrasound is the modality of choice for follow-ups. Most mesenchymal hamartomas will undergo spontaneous regression over time. They show mixed density on CT, with a combination of cystic and enhancing components. Prior intralesional hemorrhage may increase the density of the cyst contents. The MRI features of mesenchymal hamartoma are based on the dominant tissue structure, which may be stromal or cystic. Lesions with a dominant stromal component show low signal intensity in T1W and T2W images. Conversely, lesions that are predominantly cystic will show somewhat higher T1W signal intensity and very high T2W signal intensity, like other cystic tumors. Lesions typically have different signal intensities arising from multiple cystic components with intervening septa (▶ Fig. 5.33) due to differences in the concentration of protein-rich fluid. 32 The varying protein content identifies the lesions as mesenchymal hamartoma rather than simple cysts.

Fig. 5.31 Hemangioendothelioma in a 10-month-old child. Ultrasound findings are nonspecific, showing hyperechoic masses. But ultrasound is still a useful modality for follow-up.

Fig. 5.32 Infantile hemangioendothelioma in a child. (a) T2W image shows a hyperintense mass in the left lobe of the liver. (b) T1W image. The mass shows low signal intensity. Vessels with flow voids (arrows) are visible at the periphery of the lesion. (c) T1W image after injection of contrast medium. Initial enhancement is mainly peripheral, though some central enhancement is also noted. (d) T1W image after injection of contrast medium, later phase. The lesion now shows inhomogeneous enhancement. (e) T1W image after injection of contrast medium, later phase than in (d). The lesion now shows inhomogeneous enhancement with sparing of central components, a signal pattern that is typical of infantile hemangioendothelioma. (f) T2W image 9 months later documents a significant, spontaneous decrease in lesion size.

Fig. 5.33 Mesenchymal hamartoma of the liver in a child. (a) T2W image shows multiple contiguous cysts of varying signal intensity. (b) T1W image shows the contrasting signal intensities even more clearly. One large cyst has very high signal intensity (arrow) indicating the presence of protein-rich fluid. (c) T1W image after injection of contrast medium shows no enhancement of the cysts or cyst walls.
Clinical features
Infantile hemangioendothelioma: The tumor must be relatively large to produce symptoms, which include hepatomegaly, right heart failure due to the left-to-right shunt, 33 and Kasalbach–Merritt syndrome due to thrombocytopenia. There have been rare cases of hemoperitoneum caused by the rupture of infantile hemangioendothelioma. The natural history of the tumor is benign, and lesions typically regress over a period of several months. 34 There are rare reports of infantile hemangioendothelioma undergoing malignant transformation to angiosarcoma.
Mesenchymal hamartoma: This tumor may present initially as a palpable abdominal mass. Compression of the stomach or bowels may cause feeding difficulties in some infants. Mesenchymal hamartomas undergo spontaneous regression.
Differential diagnosis
Infantile hemangioendothelioma: The differential diagnosis includes angiosarcoma and cavernous hemangioma.
Mesenchymal hamartoma: The differential diagnosis in this age group consists mainly of hepatoblastoma, embryonic sarcoma, and hepatocellular carcinoma. Differentiation cannot rely on imaging alone and requires histological confirmation.
Key points
Infantile hemangioendothelioma: This entity occurs as a benign tumor in children with a peak incidence in the first 6 months of life. It is distinct from the low-grade epithelioid hemangioendotheliomas that occur in adults.
Mesenchymal hamartoma: The peak age of incidence of mesenchymal hamartoma is in infancy, and this entity is diagnosed almost exclusively before 1 year of age. Given its histology, the tumor presents a mixed appearance in all modalities. It cannot be positively differentiated from malignant liver tumors in the pediatric age group, so histological confirmation is always required. After initial detection by ultrasound, the next imaging study is usually MRI. Definitive lesion characterization requires biopsy. Since mesenchymal hamartomas generally resolve spontaneously, cases can be managed by sonographic follow-up.
Malignant Mesenchymal Tumors
Hepatic Angiosarcoma
Brief definition Hepatic angiosarcoma has a bimodal age distribution with one peak in early childhood and another in the sixth to seventh decade. Hepatic angiosarcoma in children is extremely rare and is viewed as a malignant form of infantile hemangioendothelioma. 35 Angiosarcoma in children may have an initial presentation similar to infantile hemangioendothelioma, but it does not regress over time. Instead it spreads diffusely into the surrounding tissue, identifying it as a malignant lesion. Hepatic angiosarcoma in adults is responsible for only about 1.8% of all primary hepatic neoplasms and is approximately 30 times rarer than hepatocellular carcinoma. 36 A predisposing factor is exposure to vinyl chlorides, arsenic, steroids, and radium. An increased incidence is also found in association with chronic idiopathic hemochromatosis and Recklinghausen’s disease. Angiosarcomas arise from endothelial cells and do not have a capsule. The tumors consist of a disordered array of vessel-like clefts and structures and may show a nodular growth pattern or may aggressively infiltrate surrounding tissue in a very diffuse pattern.
Imaging signs Hepatic angiosarcomas have indistinct margins due to the absence of a capsule. They enhance intensely, and the enhancement persists into the equilibrium phase. Regressive changes are often visible within the lesion, and intratumoral cysts may form. Intratumoral hemorrhage is common with angiosarcomas, which may also bleed into their surroundings. As a result, large tumors may be accompanied by hemorrhagic ascites. Angiosarcomas may invade the hepatic vessels, leading to thrombosis. The combination of intratumoral cysts, regressive changes, and intratumoral hemorrhage give the tumor a heterogeneous imaging appearance in all modalities. Hepatic angiosarcoma in children may show early central enhancement and inhomogeneously enhancing areas (▶ Fig. 5.34), a pattern that differs from hemangioma but is similar to angiosarcoma in adults.

Fig. 5.34 Hepatic hemangiosarcoma in a child. (a) T2W image shows a large, relatively homogeneous, hyperintense tumor in the left lobe of the liver. (b) T1W image after injection of contrast medium shows inhomogeneous enhancement. (c) DWI with b0 = 1,400. The lesion shows markedly restricted diffusion. (d) Hypointensity of the lesion in the ADC map is suspicious for malignancy.
Clinical features Like other malignant tumors, hepatic angiosarcoma usually presents initially with B symptoms such as weakness and weight loss. Rapid growth may cause pain due to tension on the liver capsule. Biliary tract compression may cause jaundice. Tumor rupture with hemoperitoneum has been described. A large tumor volume may lead to consumption coagulopathy due to the large intravascular space as well as intratumoral thrombosis and hemorrhage. Many patients develop anemia. The mean survival time after diagnosis is 6 months.
Differential diagnosis Angiosarcomas require differentiation from metastases and vascular tumors such as epithelioid hemangioendothelioma, which occurs very rarely in adults (peak incidence: second to fourth decade with a female preponderance).
Key points Hepatic angiosarcomas are rare tumors that arise from endothelial cells and form disordered vascular spaces. This leads to intense enhancement on imaging. The tumors may develop regressive changes, creating a heterogeneous appearance.
Primary Hepatic Lymphoma
Brief definition Hodgkin’s lymphoma and non-Hodgkin’s lymphoma, like the leukemias, tend to affect the liver secondarily, but primary hepatic lymphomas have been reported increasingly. It is important to recognize these tumors because of the markedly better prognosis of primary hepatic lymphoma. The tumor may occur at any age from childhood to adulthood and shows a 4:1 predilection for males. It may be found in association with autoimmune diseases, chronic hepatitis, cirrhosis, and HIV infection. Most primary hepatic lymphomas present as solid masses, but diffuse infiltration occasionally occurs. 37
Imaging signs At ultrasound the tumor usually has sharp margins and is hypoechoic to liver parenchyma. On CT, areas of intrahepatic lymphoma are hypodense following injection of contrast medium (▶ Fig. 5.35). On MRI the tumors often appear very similar to normal liver tissue in T1W and T2W images. After administration of contrast medium, however, the lesions appear hypovascular in the arterial and portal venous phases. They may return to isointensity in the equilibrium phase (▶ Fig. 5.36). The lesions are usually hypointense in the biliary phase while normal surrounding liver tissue shows a marked rise in signal intensity.

Fig. 5.35 Hepatic involvement by Burkitt’s lymphoma. CT scans in the arterial and portal venous phases show a hypodense, sharply circumscribed mass with an inhomogeneous internal structure. (a) Arterial phase. (b) Portal venous phase.
Related posts:
Stay updated, free articles. Join our Telegram channel

Full access? Get Clinical Tree


