Anatomy
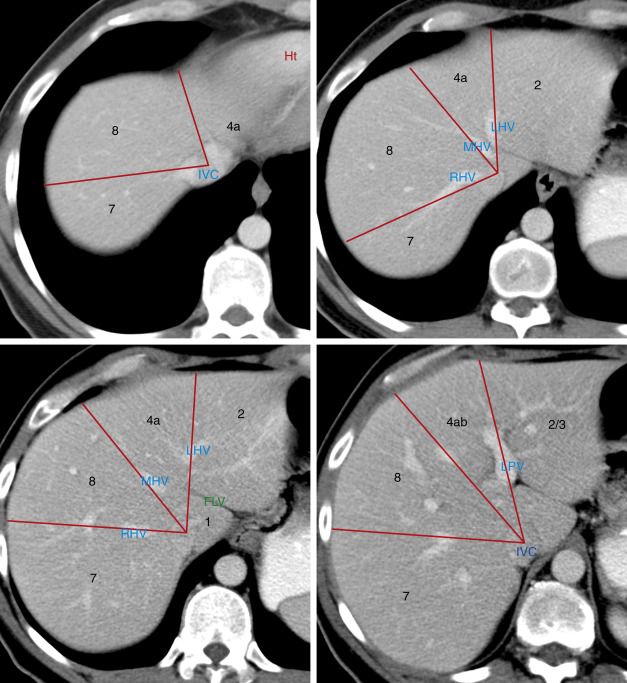
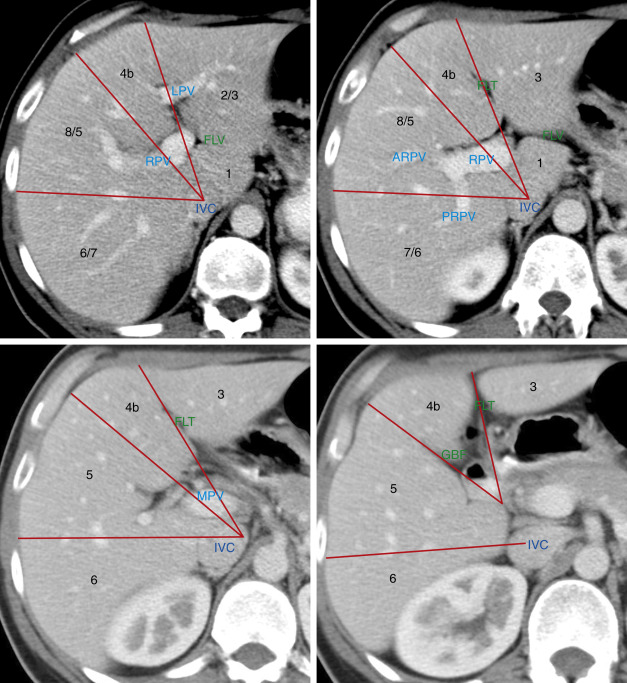
In 2000 the Terminology Committee of the International Hepato-Pancreato-Biliary Association refined the accepted terminology of hepatic anatomy and liver resections. The international classification system divides the liver into eight independent segments (Couinaud [pronounced “kwee-NO”] segments) ( Fig. 11.1 , Tables 11.1 and 11.2 ). Each segment is a self-contained unit that can be surgically resected without damaging the remainder of the liver. Each segment has its own dual vascular inflow (hepatic artery and portal vein), its own biliary drainage, and a shared vascular outflow (hepatic veins). The portal triads (bile ducts, hepatic arteries, portal veins) course through the center of each segment, whereas the hepatic veins define the periphery of the segment and the plane of surgical dissection. This segmental anatomy provides a useful and widely accepted method for identification of the location of lesions seen on CT and other imaging studies.

| Couinaud Segment | Anatomic Description | Traditional Nomenclature |
|---|---|---|
| 1 | Caudate lobe | Caudate lobe |
2 3 4a 4b | Left lateral superior subsegment Left lateral inferior subsegment Left medial superior subsegment Left medial inferior subsegment | Left lobe Lateral segment Lateral segment Medial segment Medial segment |
5 8 6 7 | Right anterior inferior subsegment Right anterior superior subsegment Right posterior inferior subsegment Right posterior superior subsegment | Right lobe Anterior segment Anterior segment Posterior segment Posterior segment |
| Term for Surgical Resection a | Segments Removed | Anatomic Term |
|---|---|---|
| Right hepatectomy | 5, 6, 7, 8 | Right hemiliver |
| Left hepatectomy | 2, 3, 4 | Left hemiliver |
| Right anterior segmentectomy | 5, 8 | Right anterior section |
| Right posterior segmentectomy | 6, 7 | Right posterior section |
| Left medial segmentectomy | 4 | Left medial section |
| Left lateral segmentectomy | 2, 3 | Left lateral section |
| Right trisegmentectomy | 4, 5, 6, 7, 8 | Right hemiliver plus left medial section |
| Left trisegmentectomy | 2, 3, 4, 5, 8 | Left hemiliver plus right anterior section |
| Segmentectomy | Any one of segments 1–9 | Segments 1–9 (e.g., segmentectomy 6) |
| Bisegmentectomy | Any two of segments 1–9 | Two contiguous segments (e.g., bisegmentectomy 5,6) |
a Some surgeons use the term sectionectomy in lieu of segmentectomy .
The right, middle, and left hepatic veins enter the intrahepatic inferior vena cava (IVC) just before it pierces the diaphragm about 2 cm below the right atrium. Whereas the right hepatic vein usually enters the IVC separately, the middle and left hepatic veins often (65%–85%) form a common trunk before joining the IVC. In most patients these three major hepatic veins drain the entirety of the liver except for the caudate lobe. Short hepatic veins drain the caudate lobe separately directly into the IVC. As an anatomic variant, accessory hepatic veins drain segment 5 or segment 6 independently into the IVC.
The portal vein is formed by the junction of the splenic vein with the superior mesenteric vein just anterior to the IVC and just posterior to the neck of the pancreas. It ascends behind the duodenum in company with the hepatic artery and common bile duct to the porta hepatis, where it divides into a short fatter right portal vein and a longer thinner left portal vein.
The hepatic artery has variable anatomy. In its “classic” form (55%) the right and left hepatic arteries branch from a proper hepatic artery that is a continuation of the common hepatic artery arising from the celiac axis. In 10% of individuals the left hepatic artery arises as a branch of the left gastric artery. In 11% of individuals the right hepatic artery arises from the superior mesenteric artery. In this case the “replaced” right hepatic artery passes through the portocaval space from the superior mesenteric artery to the right hepatic lobe.
Division of the liver into eight segments is based on a concept of three vertical planes and one transverse plane. A vertical plane through the middle hepatic vein, IVC, and gallbladder fossa divides the liver into right and left lobes. A vertical plane through the right hepatic vein divides the right lobe into anterior (7 and 5) and posterior (7 and 6) segments. A vertical plane through the left hepatic vein divides the left lobe into medial (4a and 4b) and lateral (2 and 3) segments. A transverse plane through the left portal vein divides the left lobe into superior (4a and 2) and inferior (4b and 3) segments. An oblique transverse plane through the right portal vein divides the right lobe into superior (8 and 7) and inferior (5 and 6) segments ( Table 11.1 ).
Segment 1 is the caudate lobe, which is separated from the rest of the liver by the fissure of the ligamentum venosum anteriorly and the IVC posterolaterally. It is supplied by branches of the right and left hepatic arteries and portal veins and drains venous blood directly into the IVC by numerous small hepatic veins. The papillary process of the caudate lobe extends toward the lesser sac and may appear separate from the rest of the caudate lobe, simulating a mass or an enlarged lymph node.
Segment 2 and segment 3 make up the lateral division of the left lobe. The plane of the left portal vein divides segments 2 and 3. Segment 2 makes up the left superior and lateral contour of the liver. Segment 3 makes up the left inferior and lateral contour of the liver. Segment 4 makes up the medial division of the left lobe. The plane of the left portal vein divides the medial segment of the left lobe into segments 4a (superior) and 4b (inferior). In older literature, segment 4 was called the quadrate lobe .
The anterior segments (5 and 8) of the right lobe are separated from the posterior segments (6 and 7) by the plane of the right hepatic vein. The lateral contour of the anterior right lobe is formed by segment 8 superiorly and segment 5 inferiorly. Segment 7 lies posterior to segment 8, and segment 6 lies posterior to segment 5. The plane of the right portal vein separates anterior segment 8 from anterior segment 5 and separates posterior segment 7 from posterior segment 6.
Unfortunately, natural anatomic variation in blood supply does not adhere perfectly to the concept of flat geometric planes dividing the segments. In reality the vascular territorial boundaries between segments have more variable and curving undulations to their borders than the concept of flat planes indicates. In addition, many three-dimensional drawings in the literature are misleading as to the location of the lobes. Segment 7 is posterior to and hidden by segment 8 in a frontal projection rather than lateral to segment 8 as shown in some drawings. Likewise, segment 6 is posterior, not lateral, to segment 5. The axial images in Fig. 11.1 are an attempt to localize the segments as demonstrated by CT. Correlate the anatomic description of the lobes in Table 11.1 with their location as shown in Fig. 11.1 to learn the segments. Recognize that anatomic variation in blood supply makes localization of lesions to specific segments quite inaccurate. Also, many liver lesions will involve two or more segments.
Several fissures and ligaments deserve special mention either because they are particularly prominent or because they define important perihepatic spaces. The falciform ligament consists of two closely applied layers of peritoneum extending from the umbilicus to the diaphragm in a parasagittal plane. The caudal free end of the falciform ligament contains the ligamentum teres, which is the remnant of the obliterated umbilical vein. The reflections of the falciform ligament separate over the posterior dome of the liver to form the coronary ligaments that define the “ bare area ” of the liver not covered by peritoneum. The coronary ligaments reflect between the liver and the diaphragm and prevent access of intraperitoneal fluid from covering the bare area of the liver. The absence of fluid over the bare area is an important sign in the differentiation of ascites from pleural effusion on CT. The remainder of the falciform ligament and ligamentum teres continues into the liver to form a prominent fat-filled fissure that defines the left intersegmental fissure dividing the medial and lateral segments of the left lobe.
The fissure of the ligamentum venosum contains the remnant of the ductus venosus, which in fetal life carried oxygenated blood from the umbilical vein to the IVC. This fissure is commonly fat filled and prominent on CT, separating the caudate lobe and the left lobe.
The lesser omentum suspends the lesser curve of the stomach and the duodenal bulb from the inferior surface of the liver, attaching within the fissure of the ligamentum venosum. The lesser omentum is subdivided into the gastrohepatic ligament and the hepatoduodenal ligament. The gastrohepatic ligament contains coronary veins that serve as an important sign of portal hypertension when they become dilated. The right free edge of the hepatoduodenal ligament carries the portal vein, hepatic artery, and common bile duct between the porta hepatis and the duodenum. The hepatoduodenal ligament provides the anterior border of the foramen of Winslow, which opens into the lesser sac.
The normal liver is homogeneous in CT attenuation, measuring 55 to 65 Hounsfield units (HU) on unenhanced CT. The unenhanced liver parenchymal attenuation is normally greater than that of blood vessels and 7 to 8 HU greater than that of splenic parenchyma. Anemia lowers the CT attenuation of blood vessels and may make the liver parenchyma appear falsely increased in density. The contour of the liver is smooth and convex adjacent to the diaphragm, with a sharp inferior border and a concave undersurface. Fissures may be fat filled and prominent. The right lobe is usually larger than the left lobe and may extend far caudad as a Riedel lobe , a normal variant. The left lobe is more variable in size, and its lateral segment may extend far to the left and wrap partially around the spleen. Congenital absence of the left lobe is a rare anomaly. Diaphragmatic slips are infoldings of the diaphragm that indent the normal smooth contour of the liver ( Fig. 11.2 ). These invaginations of diaphragmatic muscle occur with increasing frequency with age greater than 60 years and should not be mistaken for masses in the liver or on the diaphragm.

Technical Considerations
Multidetector CT (MDCT) allows scanning of the entire liver with thin collimation during a single 10- to 25-second breath hold. Acquisition is routinely repeated several times during various phases of contrast medium enhancement.
Dynamic contrast-enhanced liver CT offers the opportunity to accurately characterize lesion enhancement patterns and significantly increase the specificity of diagnosis. Various lesions are detected best, or sometimes only, in specific phases of postcontrast scanning. Intravenous contrast medium is administered by a power injector using a contrast medium iodine concentration of 300 mg/mL at a rate of 4 to 5 mL per second for a volume of 100 to 150 mL. Routine scan delays for MDCT are 25 seconds following initiation of contrast medium injection for the arterial phase and 65 seconds following initiation of contrast medium injection for the portal venous phase. With MDCT, images are routinely acquired at 1.25- to 2.50-mm collimation but are viewed at 5-mm slice thickness. Thin collimation acquisitions allow highly detailed multiplanar reconstructions. Enhancement of the normal liver is homogeneous throughout the parenchyma on all enhancement phases.
- •
Noncontrast scans are commonly obtained to provide a baseline for the degree of lesion enhancement. Many liver lesions are detected, but small lesions are often mistaken for unopacified vessels. Noncontrast scans are superior to postcontrast scans for diagnosis of fatty infiltration and other alterations of parenchymal attenuation.
- •
Arterial phase acquisition is optimal for visualization of hypervascular lesions supplied by the hepatic artery such as hepatoma, carcinoid metastases, and focal nodular hyperplasia (FNH). Lesions are conspicuous because they are enhanced more than the surrounding parenchyma. A variety of perfusion anomalies and abnormalities are seen only on arterial phase images.
- •
Portal venous phase imaging shows overall the best lesion detection because parenchymal enhancement is maximum during this phase. Lesions are conspicuous because they are of low attenuation within a background of maximally enhanced liver parenchyma.
- •
The equilibrium phase occurs at 2 to 3 minutes after initiation of contrast medium injection. During the equilibrium phase the concentration of contrast medium is approximately equal in the intravascular and extravascular spaces, rendering most liver lesions invisible.
- •
Delayed phase images, acquired at 10 to 20 minutes after contrast medium injection, are obtained to demonstrate delayed contrast medium fill-in of hemangiomas and to detect fibrotic tumors such as cholangiocarcinoma.
Liver Hemodynamics and Perfusion Abnormalities
The liver has a distinctive dual blood supply, with approximately 25% of its blood volume normally coming from the hepatic artery and approximately 75% arriving from the portal vein. Although this distribution pattern holds for the liver as a whole, it is not uniform throughout the liver. Alterations in arterial and venous supply to portions of the liver result in transient perfusion abnormalities that are demonstrated on postcontrast CT. Some perfusion abnormalities result from transient conditions, whereas others are congenital or chronic conditions that cause metabolic alterations in the liver resulting in abnormalities such as focal steatosis or focal sparing in diffuse fatty liver. Temporary conditions that may cause transient perfusion abnormalities include compression of the liver capsule by ribs or by infoldings of the diaphragm (slips) during breath hold for CT. Variations in vascular supply, termed third inflow , are chronic conditions that may result in focal metabolic changes in the liver parenchyma. Third inflow is a normal variant that involves small volumes of the liver that are supplied by aberrant systemic veins, in addition to the usual hepatic artery and portal venous supply.
Perfusion abnormalities usually represent an increase of arterial blood flow to a portion of the liver in response to a focal decrease in portal venous flow. In most cases the perfusion abnormality manifests itself as increased enhancement of a segment or subsegment of the liver during the arterial phase, with normal parenchymal enhancement returning during the portal venous phase. When the blood flow anomaly is persistent, resulting metabolic abnormalities manifest themselves as focal steatosis or focal fatty sparing. Most perfusion disorders are asymptomatic but must be recognized to avoid mistaking them for significant lesions.
Third inflow by systemic veins causes perfusion abnormalities in predictable areas of the liver and is thus relatively easy to recognize. Systemic veins communicate with portal venous branches to focally decrease portal venous flow, resulting in an increase in hepatic arterial flow in the same area. The following are prime areas for focal fatty infiltration or focal fatty sparing:
- •
The liver parenchyma adjacent to the gallbladder in segments 4 and 5 is sometimes supplied by the cholecystic vein draining the gallbladder. This pathway allows direct spread of gallbladder carcinoma into the liver.
- •
An aberrant right gastric vein may drain directly into the liver instead of into the portal or splenic vein. This results in an area of hyperenhancement at the posterior edge of segment 4.
- •
An aberrant left gastric vein drains directly into the liver instead of into the left portal vein, creating an area of hyperenhancement in the posterior aspect of segments 2 and 3.
- •
Aberrant gastric veins allow direct spread of gastric carcinoma into the liver.
- •
The dorsal aspect of segment 4 adjacent to the porta hepatis may be supplied by the parabiliary veins draining the distal part of the stomach and the head of the pancreas.
- •
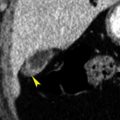
The anterior aspect of segments 3 and 4 adjacent to the fissure of the ligamentum teres is often supplied by the epigastric-paraumbilical veins draining blood from the anterior abdominal wall directly into the liver ( Fig. 11.3 ). This venous plexus may be enlarged and prominently visualized on CT in the presence of obstruction of either the superior vena cava or the IVC. In portal hypertension these collaterals are enlarged and blood flow may reverse to drain out of the liver instead of into the liver.

FIG. 11.3
Pseudolesion caused by third inflow.
Early portal venous phase image showing a low-attenuation nodular focus (yellow arrowheads) adjacent to the fissure of the ligamentum teres. This should be recognized as a common pseudolesion related to third inflow. The remnant of the falciform ligament (red arrow) is seen as a soft-tissue density within the fissure.
Extrinsic compression of the liver capsule causes low-attenuation defects with the following features:
- •
A poorly marginated low-attenuation defect is seen during the portal venous phase beneath a concave indentation of the liver capsule caused by diaphragmatic slips or ribs.
- •
No abnormalities are seen in the same area on unenhanced, arterial phase, equilibrium phase, or delayed images.
- •
The offending ribs or diaphragmatic slips are evident. Metastatic disease on the peritoneal surface of the liver and subcapsular fluid collections may cause similar perfusion findings.
Tumors may affect perfusion in adjacent liver parenchyma in several ways:
- •
Hypervascular tumors may have intratumoral arterioportal shunts. These produce transient, peripheral wedge-shaped enhancement zones during the arterial phase in the parenchyma peripheral to the tumor and early enhancement of peripheral portal vein branches before the main portal vein is enhanced. The peripheral enhancement may be mistaken for additional tumor, resulting in overestimation of tumor size.
- •
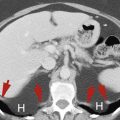
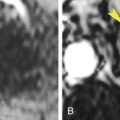
Tumor invasion, induced thrombosis, or vein compression may obstruct the portal vein or its branches. This results in decreased attenuation of affected parenchyma on noncontrast scans as a result of edema and transient increased enhancement during the arterial phase because of increased arterial flow ( Fig. 11.4 ). Thrombi may be seen in portal veins.

FIG. 11.4
Transient arterial perfusion abnormality.
(A) Arterial phase image of the liver in a patient who has had a left hepatectomy showing a poorly marginated area of bright arterial enhancement (yellow arrows) . Serial images showed no evidence of a mass in this region. A metallic staple (red arrowhead) placed during surgery is noted. (B) Portal venous phase image through same region showing normal parenchymal enhancement. This perfusion defect was believed to be caused by postsurgical occlusion of portal venous branches to this area, resulting in a compensatory increase in hepatic arterial flow.
- •
Hypervascular tumors, such as large hepatocellular carcinomas (HCCs), may parasitize and enlarge regional hepatic arteries. The tumor may either “steal” blood from adjacent parenchyma or cause increased arterial blood flow to adjacent parenchyma ( Fig. 11.5 ). Thus on arterial phase images, parenchyma adjacent to large hypervascular tumors may show either increased or decreased enhancement.

FIG. 11.5
Parenchymal hyperenhancement caused by tumor.
Postcontrast CT reveals a large area of liver parenchymal hyperenhancement (red arrows) peripheral to hepatocellular carcinoma. The size of the tumor is shown by the yellow arrowheads.
Diffuse Liver Disease
Fatty Liver
Fatty infiltration of the liver (hepatic steatosis) is one of the most common abnormalities diagnosed by liver CT. Fatty infiltration is a nonspecific response of hepatocytes to a variety of insults, including alcoholism, obesity, diabetes, hyperlipidemia, viral hepatitis, chemotherapy, corticosteroid therapy, hyperalimentation, and malnutrition. The varied appearances of fatty infiltration include the following:
- •
Fatty infiltration lowers the CT attenuation of the involved liver parenchyma. The findings are most accurately assessed on noncontrast CT. The normal liver parenchymal attenuation is at least 10 HU greater than that of the spleen parenchyma. With fatty infiltration, attenuation of involved liver is at least 10 HU lower than that of the spleen. Hepatic vessels course through areas of fatty infiltration unchanged. Fatty change is more difficult to judge on postcontrast CT because of the variability of the timing of the scan and the fact that maximum liver enhancement is delayed compared with maximum spleen enhancement. CT attenuation below –40 HU on postcontrast CT is strong evidence of hepatic steatosis but is insensitive to mild cases.
- •
Diffuse fatty infiltration. In most cases the entire liver is uniformly reduced in density ( Fig. 11.6 ). Vessels stand out in prominent relief but run their normal course through the liver without displacement or narrowing by mass effect. The liver is usually enlarged, and the parenchyma is enhanced minimally. This pattern is the most common and is easiest to recognize. In some cases the fatty infiltration is diffuse throughout the liver but is nonuniform and patchy in severity.

FIG. 11.6
Diffuse fatty infiltration.
On this postcontrast CT image the liver parenchyma (L) is diffusely and markedly lower in attenuation than the spleen parenchyma (S) , indicating diffuse hepatocellular fatty infiltration. The blood vessels in the liver show normal distribution and tapering without evidence of a mass effect.
- •
Focal fatty infiltration. A geographic or fan-shaped portion of the liver shows fat infiltration, whereas the remainder of the liver is of normal density ( Fig. 11.7 ). The low-attenuation area may extend to the liver surface, but no bulge in contour is seen. Vessels run their normal course through the area of involvement. Margins between fat-infiltrated and normal liver are frequently straight and well-defined, reflecting blood flow territories as the fat infiltration is confined to segments and subsegments. Areas of the liver supplied by third inflow systemic veins are commonly affected: adjacent to the gallbladder, the fissure of the ligamentum teres, and the porta hepatis.

FIG. 11.7
Focal fatty infiltration.
The left lobe of the liver (L) is lower in attenuation than the right lobe of the liver (R) and the spleen (S) . A strikingly sharp boundary (arrowheads) separates the left and right lobes. This appearance is characteristic of focal fatty infiltration.
- •
Multifocal fatty infiltration. Patchy areas of decreased attenuation are scattered throughout the liver ( Fig. 11.8 ). Tumors may be simulated by the islands of fatty infiltration surrounded by normal parenchyma or by islands of normal parenchyma surrounded by fatty infiltration. The pattern tends to be geographic with straight margins rather than rounded masses. Areas of involvement may interdigitate with normal parenchyma.

FIG. 11.8
Multifocal fatty infiltration.
Patchy areas of low-attenuation fatty infiltration permeate the liver parenchyma. The enhanced intrahepatic blood vessels follow a normal course without a mass effect. Ascites (a) is present.
- •
Focal sparing. Islands of normal parenchyma are surrounded by large areas of diffuse fatty infiltration and may simulate neoplasms ( Fig. 11.9 ). As previously mentioned, the patterns of focal steatosis and focal sparing are related to chronic perfusion abnormalities such as systemic venous drainage into the liver. Focal sparing is most common in the same areas of the liver most often affected by focal steatosis.

FIG. 11.9
Focal sparing.
Islands of normal parenchyma ( arrowheads ) in segment 4b and the caudate lobe (segment 1) simulate mass lesions in a liver with extensive fatty infiltration. Most of the liver parenchyma is fatty infiltrated, making these islands of normal parenchyma appear of high attenuation by comparison.
- •
Nonalcoholic fatty liver disease (NAFLD) refers to hepatic steatosis with causes other than alcohol abuse. It is one of the most common liver diseases, with a global prevalence estimated at 24%. Although the exact cause is uncertain, causative factors include obesity; metabolic syndrome; insulin resistance and diabetes mellitus type 2; hyperlipidemia; drugs, including corticosteroids, tamoxifen, and methotrexate; and genetic predisposition in Native Americans, South Americans, and other groups. Nonalcoholic steatohepatitis (NASH) is a severe form of NAFLD with fatty infiltration complicated by inflammation and fibrosis, progression to cirrhosis, and risk of HCC. NASH progresses to cirrhosis in 20% of patients.
The following findings are most useful in making a confident diagnosis of fatty infiltration:
- •
Angulated geometric margins (nonspherical) between normal and fatty tissue.
- •
Interdigitating margins with slender fingers of normal or fatty tissue.
- •
Absence of mass effect, vessel displacement, or narrowing by encasement.
- •
Rapid change over time. Fatty changes can be seen within 3 weeks after the insult and can resolve within 6 days after removal of the insult.
- •
Further confirmation of fatty replacement can be provided by other imaging tests. Ultrasonography will show the areas of fatty infiltration as corresponding areas of increased parenchymal echogenicity. This gives rise to a “flip-flop” sign: fat is dark on CT and is bright on ultrasonography. Chemical shift magnetic resonance imaging with in-phase and out-of-phase images is highly sensitive to the presence of fat. Percutaneous biopsy is an option in difficult cases.
- •
Ultrasonography is the screening method of choice for fatty liver disease, with low cost and high sensitivity. Magnetic resonance spectroscopy and imaging are most accurate for quantifying fat in the liver. Ultrasound and magnetic resonance elastography detect and quantitate liver fibrosis to distinguish NASH from NAFLD.
Increased Liver Attenuation
Normal liver attenuation on unenhanced CT is 55 to 65 HU and is at least 10 HU higher than the attenuation of the spleen. Increased liver attenuation is usually in the range of 75 to 140 HU. On noncontrast CT, portal and hepatic veins stand out as dark tubular structures in a background of bright liver parenchyma. Causes include:
- •
Iodine. Amiodarone is toxic to the liver and raises its attenuation by deposition of iodine-containing metabolites ( Fig. 11.10 ). Amiodarone is used to treat cardiac arrhythmias.

FIG. 11.10
High-attenuation liver.
Noncontrast CT demonstrates markedly high attenuation of the liver (L) compared with the spleen (S) in this patient receiving chronic amiodarone therapy for cardiac arrhythmias.
- •
Gold. Rheumatoid arthritis therapy with gold salts may lead to deposition of gold in the liver parenchyma.
- •
Iron. Hemochromatosis raises liver attenuation by deposition of iron. Primary hemochromatosis is characterized by increased intestinal absorption of iron, with deposition of hemosiderin in hepatocytes, and in the parenchyma of the pancreas and other organs, eventually causing cellular injury and loss of function. In secondary hemochromatosis (also called hemosiderosis ) iron overload from multiple blood transfusions is taken up by reticuloendothelial cells in the liver, spleen, and bone marrow. Hemochromatosis commonly progresses to cirrhosis. Magnetic resonance imaging is the most sensitive for confirming the presence of iron excess in the liver.
- •
Copper. Wilson disease is associated with increased liver attenuation by deposition of copper.
- •
Glycogen. Glycogen storage diseases mildly raise liver attenuation.
- •
Thorium. Thorotrast, containing thorium dioxide, was used as a radiographic contrast agent from 1928 to the 1950s. Thorium is weakly radioactive and was found to be associated with development of hepatic angiosarcoma, cholangiocarcinoma, and HCC. High-attenuation thorium deposition in the reticuloendothelial system of the liver, spleen, and lymph nodes may be apparent even on conventional radiographs.
Cirrhosis
Cirrhosis is a chronic diffuse liver disease characterized by progressive destruction of liver parenchyma with distortion of hepatic architecture by extensive fibrosis and nodular regeneration of liver tissue. Common causes of cirrhosis include chronic alcoholism, chronic viral hepatitis, NASH, chronic biliary stasis associated with primary sclerosing cholangitis and primary biliary cirrhosis, and genetic diseases such as autoimmune hepatitis, Wilson disease, and hemochromatosis. Patients with cirrhosis show the following CT findings:
- •
In the earliest stages of cirrhosis the liver may appear normal on CT.
- •
Fatty infiltration with hepatomegaly is evidence of active hepatocyte injury.
- •
Heterogeneous parenchymal attenuation on noncontrast CT is as a result of patchy fatty infiltration and irregular fibrosis ( Fig. 11.11 ). Contrast enhancement is heterogeneous as well and accentuates the diverse appearance of the liver tissue.

FIG. 11.11
Advanced cirrhosis with fatty infiltration.
Delayed portal venous phase CT image showing the liver to be misshapen and nodular in contour. Overall parenchymal attenuation significantly lower than that of the spleen (S) is indicative of fatty infiltration and continuing liver injury. Prominent scars and bands of fibrosis (arrowheads) are seen throughout the liver. Ascites (a) is present.
- •
The surface contour of the liver is finely nodular or irregular lobulated caused by areas of parenchymal atrophy and regenerative nodules ( Fig. 11.12 ).

FIG. 11.12
Cirrhosis with portal hypertension.
Postcontrast CT reveals the liver to be nodular in contour (yellow arrowhead) with patent enlarged paraumbilical veins (straight red arrows) and splenomegaly (S) , findings indicative of portal hypertension. Mildly enlarged portosystemic collateral vessels (curved red arrow) are also evident in the gastrohepatic ligament.
- •
Atrophy of the right lobe with hypertrophy of the left and caudate lobes is common and characteristic of alcoholic (Laënnec) micronodular cirrhosis. This finding is related to absorption of alcohol directly from the stomach with preferential flow of blood from the stomach to the right hepatic lobe in the portal venous system.
- •
With progressive cirrhosis, total liver volume decreases and the liver appears shrunken and deformed ( Fig. 11.13 ).

FIG. 11.13
Advanced cirrhosis.
The liver is shrunken, with markedly nodular contour and heterogeneous parenchyma. Hepatic vessels are distorted and poorly visualized. Ascites (a) is present. The inferior vena cava (arrowhead) is compressed and distorted by liver atrophy and progressive fibrosis.
- •
The size and prominence of the porta hepatis and intrahepatic fissures increase because of atrophy of adjacent liver tissue.
- •
Ascites, splenomegaly, and other signs of portal hypertension are commonly present.
- •
Serous cysts may develop adjacent to intrahepatic and extrahepatic bile ducts. These peribiliary cysts may mimic biliary dilatation when present in a linear configuration. More typically they appear as a row of cysts with thin but visible cyst walls.
- •
Enlarged lymph nodes (>1 cm) are commonly seen in the porta hepatis and portocaval space in patients with advanced cirrhosis. These are usually benign, associated with the development of cirrhosis, and not indicative of a malignant process.
- •
Ultrasound and magnetic resonance elastography are used to quantitate liver fibrosis in patients with suspected cirrhosis.
- •
Percutaneous liver biopsy, often guided by ultrasound, remains the gold standard for evaluation of cirrhosis.
- •
Mimics of cirrhosis include treated breast cancer metastases causing retraction of the liver capsule, irregular liver contour, and heterogeneous parenchymal nodularity; sarcoidosis with noncaseating granulomas causing fine nodularity of the liver surface and parenchymal granularity; miliary metastases causing surface nodularity; Budd-Chiari syndrome; and fulminant hepatic failure causing loss of parenchyma with distortion of liver contour.
Nodules in Cirrhosis
Nodular lesions in cirrhosis may be regenerative nodules, dysplastic nodules, or small HCCs. Regenerative nodules are present in all cirrhotic livers but are visualized on CT in only 25% of cases. They represent a local reparative response to injury with focal proliferation of hepatocytes and supporting stroma. Dysplastic nodules are premalignant; a nodular collection of hepatocytes that have cellular atypia and dysplastic features but no frank malignancy. HCC may develop spontaneously or as a result of progression of focal dysplasia.
- •
Regenerative nodules, although nearly always present pathologically, are usually not demonstrated on noncontrast CT because they are too small or are isodense with surrounding tissue. However, they may accumulate iron and show high attenuation on noncontrast CT ( Fig. 11.14 ). These are termed siderotic nodules. Siderotic nodules usually disappear on postcontrast CT. When seen, regenerative nodules typically are not enhanced on arterial phase postcontrast CT. On portal venous phase, regenerative nodules are either not seen because they are enhanced homogeneously with surrounding tissue or appear hypodense because they are enhanced less than surrounding tissue ( Fig. 11.15 ). Visualized regenerative nodules are typically smaller than 10 mm.

FIG. 11.14
Siderotic regenerative nodules.
Noncontrast CT demonstrates several high-attenuation nodules (arrowheads) within a cirrhotic liver. These are siderotic regenerative nodules with high iron content.

FIG. 11.15
Regenerative nodules.
Portal venous phase postcontrast CT reveals numerous small (<10 mm) low-attenuation nodules in a cirrhotic liver. This shows unusually prominent visualization of regenerative nodules.
- •
A unique but very helpful finding is that often regenerative nodules appear larger on portal venous and delayed phase images than they do on precontrast or in arterial phase. This finding is not found with malignant nodules.
- •
Dysplastic nodules are not often demonstrated on CT. When seen, dysplastic nodules are slightly hypoattenuating or hyperattenuating on noncontrast CT. On postcontrast CT, most dysplastic nodules are enhanced homogeneously with surrounding liver tissue on both arterial and portal venous phase and are not detectable and show no enhancement on arterial, portal, and equilibrium postcontrast images. Siderotic nodules larger than 10 mm are considered dysplastic. A small number of dysplastic nodules demonstrate homogeneous enhancement on arterial phase images, and are isodense with parenchyma on portal venous, equilibrium, and delayed phase images. These are distinguishable from HCC only by biopsy.
- •
Small HCC nodules are hypointense or isointense to surrounding tissue on noncontrast CT. Hyperintense homogeneous enhancement in arterial phase images is the key finding that suggests HCC. The hallmark findings of HCC, considered to be diagnostic without biopsy, are near isointensity on noncontrast CT with hyperenhancement in arterial phase images and rapid contrast agent washout in portal venous phase images. Up to 50% of pathologically proven small HCC nodules are not detectable because they are isodense to parenchyma on all pre- and post contrast phase images.
- •
Diffuse metastatic disease, especially associated with breast cancer, may mimic cirrhosis with nodules. Medical history usually provides the differentiation. Innumerable small metastases may also be seen with small cell lung carcinoma, melanoma, carcinoid, and occasionally pancreatic carcinoma.
- •
Hemangiomas are rarely seen in cirrhotic livers. The process of parenchymal injury and scarring results in complete fibrosis of most hemangiomas, so they are not detected.
- •
Hepatic cysts are present at the same frequency as in noncirrhotic livers but are usually easily diagnosed by uniform low attenuation, sharp margination with imperceptible wall, and lack of contrast enhancement.
Focal Confluent Fibrosis
Focal confluent fibrosis describes a process of progressive hepatic parenchymal tissue loss with replacement by a fibrotic mass that occurs commonly in cirrhotic livers, especially those related to alcohol abuse.
- •
The lesion appears as a focal, commonly wedge-shaped, fibrotic mass extending from the porta hepatis to the liver periphery associated with retraction or flattening of the liver capsule caused by tissue loss ( Fig. 11.16 ). The lesion is of low attenuation on noncontrast CT and shows delayed but persistent enhancement extending into the equilibrium phase.

FIG. 11.16
Confluent fibrosis.
Postcontrast axial CT image showing an ill-defined enhancing fibrotic mass (yellow arrowheads) extending from the liver periphery toward the porta hepatis associated with marked retraction (red arrow) of the liver capsule. This is the characteristic appearance of focal confluent fibrosis.
- •
Serial imaging over time shows moderate progression of tissue loss and capsular retraction.
Portal Hypertension
Portal hypertension, defined as pathologic increase in portal venous pressure, results from progressive fibrosis of the hepatic vascular bed with development of portosystemic collateral vessels and eventually hepatofugal flow (i.e., flow away from, instead of into, the liver). Portal hypertension causes major morbidity in the patient with cirrhosis because of hepatic encephalopathy and variceal hemorrhage. Portal hypertension can be diagnosed on CT by the presence of the following anatomic signs:
- •
Portosystemic collateral vessels enlarge as they shunt blood between the portal and systemic veins ( Fig. 11.17 ). Findings include esophageal, paraesophageal, and gastric varices; enlarged paraumbilical veins that connect with enlarged subcutaneous veins around the umbilicus (caput medusae); splenorenal shunts; and perisplenic collaterals. Varices appear as well-defined, round, serpentine structures that are enhanced homogenously with contrast agent during portal venous and delayed phases ( Fig. 11.17B ).

FIG. 11.17
Portal hypertension.
(A) Axial postcontrast CT shows signs of advanced portal hypertension in a patient with cirrhosis. The liver is shrunken and nodular in contour. The right and left portal veins (red arrowheads) are enlarged, each measuring 15 mm. Dilated and tortuous cardinal veins (fat red arrow) are seen in the gastrohepatic ligament and retroperitoneum (skinny red arrow) . Paraumbilical collateral veins are patent and dilated, extending through the fissure of the ligamentum teres and falciform ligament (yellow curved arrows) and as subcutaneous collaterals (yellow arrowhead) . Visualization of patent paraumbilical collateral veins is the most specific CT sign of portal hypertension. The spleen (S) is enlarged. (B) Coronal CT image of the same patient showing dramatic paraesophageal varices (arrowhead) and the tangle of the retroperitoneal and perigastric collaterals (arrow) .
- •
The portal vein and branches are enlarged (>13 mm) ( Fig. 11.17A ).
- •
The splenic and superior mesenteric veins are enlarged (>10 mm). With engorgement of the mesenteric veins the bowel often appears edematous and thick walled.
- •
When a splenorenal shunt is present, the left renal vein is enlarged.
- •
Splenomegaly is usually evident because of splenic congestion.
- •
Ascites is often present.
- •
The enlarged collateral vessels characteristic of portal hypertension may be subtle and easily missed or may be mistaken for other structures. You see what you look for!
Portal Vein Thrombosis
Thrombosis of the portal vein is found in association with cirrhosis, hepatoma, hypercoagulability, pancreatitis, pancreatic cancer, trauma, or mesenteric inflammation. Portal vein thrombosis can cause or exacerbate portal hypertension. Thrombosis may be partial or complete, acute or chronic. Thrombosis may be classified as bland or as neoplastic if tumor extends into the portal veins. HCC is the most common cause of tumor extending into the portal vein. In patients with large HCC, bland portal vein thrombus is reported as present in as many as 20% of patients and tumor thrombus is present in as many as 33%. Thrombus may extend into the splenic and superior mesenteric veins. The signs of portal vein thrombosis include the following:
- •
Bland thrombus is of low attenuation and nonenhancing filling or partially filling the lumen of the portal vein or branches the portal ( Fig. 11.18 ).

FIG. 11.18
Portal vein thrombosis.
Postcontrast CT shows low-attenuation thrombus (red arrowheads) filling and distending the right portal vein and branches. Collaterals have formed in the gastrohepatic ligament (red arrow) . The spleen (S) shows multiple infarctions (yellow arrowheads) . The splenic vein (not shown) was also thrombosed. Ascites (a) is present.
- •
The diameter of the portal vein is often increased (>15mm).
- •
If thrombosis is complete, the portal vein is not enhanced on postcontrast scans. Failure to visualize the portal vein suggests complete thrombosis. When partial thrombosis is present, contrast-opacified blood outlines the low-attenuation clot.
- •
Nonmalignant partial portal vein thrombosis will spontaneously resolve in about half of cases.
- •
Tumor thrombus within the portal vein is of low attenuation on noncontrast CT. Contrast agent administration shows enhancement of tumor within the vein most prominent on arterial phase images. Intraluminal tumor enhancement parallels the timing and degree of enhancement of the primary tumor. The presence of tumor thrombus in patients with HCC usually excludes them as candidates for liver transplantation.
- •
Cavernous transformation refers to the development of numerous periportal collateral veins in response to chronic portal vein thrombosis, usually in patients with cirrhosis. CT demonstrates a nest of collateral vessels in the porta hepatis.
- •
Calcification may be seen within the portal vein when thrombus is chronic.
- •
Altered blood flow results in arterial perfusion changes within the liver parenchyma. Where venous blood flow is decreased, hepatic arterial blood flow is increased, showing hyperenhancement during the arterial phase. Parenchyma with chronic decreased blood flow may atrophy, whereas lesser affected or unaffected parenchyma may show compensatory hypertrophy.
Passive Hepatic Congestion
In the presence of right-sided heart failure, constrictive pericarditis, or pericardial effusion the volume of returning venous blood exceeds the capacity of the right side of the heart, causing a rise in central venous pressure with dilatation of the IVC and hepatic veins. Chronic congestion and stasis in the hepatic sinusoids causes ischemic injury to hepatocytes, resulting in fatty infiltration and eventually cirrhosis.
- •
The hepatic veins and IVC are distended because the failing heart cannot accommodate venous return ( Fig. 11.19 ). Perivascular edema may be present, seen as low-attenuation zones encircling the portal veins and intrahepatic IVC.

FIG. 11.19
Passive hepatic congestion.
The inferior vena cava (IVC) , right hepatic vein (RHV) , middle hepatic vein (MHV) , and left hepatic vein (LHV) are massively dilated in this patient with chronic right-sided heart failure. Similar in physiology to Budd-Chiari syndrome, intrahepatic collateral vessels (arrowheads) have enlarged and are visualized as enhanced tubular and comma-shaped structures.
- •
Contrast medium injection into the upper extremities characteristically shows prominent retrograde flow of contrast medium deep into the hepatic veins. This pathologic finding must be differentiated from bland reflux of contrast medium into the upper IVC and distal hepatic veins sometimes seen with high-volume power injection.
- •
Hepatic parenchyma may be enhanced in a mottled mosaic pattern (termed nutmeg liver ) similar to that seen with Budd-Chiari syndrome.
- •
Cardiomegaly, pleural and pericardial effusions, ascites, and hepatomegaly are frequently present.
- •
Decreased blood flow, hypoxia, and increased venous pressure lead to diffuse hepatocellular necrosis progressing to cirrhosis. Cardiac cirrhosis may be irreversible even if cardiac function improves.
- •
Magnetic resonance and ultrasound elastography are used to assess liver stiffness and the development of fibrosis in chronic cases.
Budd-Chiari Syndrome
Budd-Chiari syndrome refers to the manifestations of hepatic venous outflow obstruction, which causes elevated pressure in the sinusoids and decrease in portal venous flow, resulting in severe centrilobular congestion, hepatocellular necrosis, and parenchyma atrophy. Acute thrombosis of the main hepatic veins or IVC is associated with pregnancy, oral contraceptive use, chemotherapy, radiation therapy, and polycythemia vera. Neoplastic obstruction of the hepatic veins or IVC occurs with HCC, renal cell carcinoma, and adrenal carcinoma. Chronic fibrosis is idiopathic and affects small sublobular and central hepatic veins. Congenital causes include webs or diaphragms that obstruct the IVC. CT findings are variable depending on the chronicity of the disease.
- •
In acute Budd-Chiari syndrome (1–3 months), the liver is enlarged and hypoattenuating but with normal morphology on noncontrast CT. The IVC and hepatic veins are narrowed. Thrombus within the veins may be hyperattenuating. After contrast medium administration, the caudate lobe and liver surrounding the IVC show early arterial enhancement, with decreased enhancement of the liver periphery reflecting sinusoidal congestion. In the portal venous phase the liver periphery is enhanced while the contrast medium is washed out of the central liver, resulting in decreased attenuation. This has been termed the flip-flop appearance of liver enhancement. The hepatic veins and IVC show low attenuation with enhancement of the vein walls.
- •
In chronic Budd-Chiari syndrome the caudate lobe is enlarged, whereas the remainder of the liver is dysmorphic, with atrophy and multiple regenerative nodules. The caudate lobe is spared from injury because of its separate hepatic vein drainage directly into the IVC. The IVC and hepatic veins are collapsed and usually not visualized. Parenchymal enhancement is inhomogeneous, appearing as a mosaic pattern ( Fig. 11.20 ). Parenchymal nodules, 1 to 4 cm in size, show hyperenhancement in the arterial phase persisting into the portal venous phase. Portal hypertension is present, resulting in splenomegaly and the presence of intrahepatic and extrahepatic portosystemic collateral vessels. Characteristic intrahepatic collateral vessels are seen as comma-shaped enhancing vessels, as is seen with passive hepatic congestion ( Fig. 11.19 ). The azygos vein is enlarged, providing an alternative pathway for return of blood to the heart.

FIG. 11.20
Budd-Chiari syndrome.
Portal venous phase postcontrast image showing a markedly abnormal mottled pattern of liver parenchymal enhancement with the central liver well enhanced and the peripheral liver poorly enhanced. Venography (not shown) demonstrated occlusion of the intrahepatic inferior vena cava and hepatic veins. The caudate lobe (1) is characteristically enlarged.
- •
Regenerative nodules are prominent and resemble multifocal HCC. The key finding is that regenerative nodules in Budd–Chiari syndrome remain relatively hyperdense in the portal venous phase, whereas early washout of contrast medium in the portal venous phase is characteristic of HCC.
Hereditary Hemorrhagic Telangiectasia
Also called Osler-Weber-Rendu syndrome , hereditary hemorrhagic telangiectasia (HHT) demonstrates prominent perfusion abnormalities on CT of the liver. HHT is an autosomal dominant disorder with variable penetrance characterized by multiorgan telangiectasias and arteriovenous malformations. The liver is involved in most cases (60%–75%), although liver involvement is often asymptomatic. The skin, mucous membranes, lungs, and brain are prominently affected. Patients present in adulthood with hemoptysis, epistaxis, and mucocutaneous telangiectasias. Many patients are asymptomatic when the disease is recognized by its imaging findings. CT findings are striking on arterial phase images ( Fig. 11.21 ).
- •
Telangiectasias are the most common findings in the liver. They are dilated small vessels that may be capillaries, venules, or arterioles. On CT they appear as hypervascular rounded masses from 1 to 10 mm in size. They appear hyperdense on early and late arterial phase images and become isodense with liver parenchyma on venous phase images. The overall appearance of diffuse telangiectasis is marked early phase heterogeneous enhancement of the liver parenchyma.
- •
Large confluent vascular channels (>1cm) form from coalescence of telangiectasias. Typically they are enhanced in the arterial phase, showing persisting enhancement as contrast medium pools within the vascular channels on venous phase.
- •
Vascular malformations are characterized by early contrast opacification and dilation of portal and hepatic veins. Arterial phase filling of the portal vein is indicative of arterioportal (hepatic artery to portal vein) shunts. Arterial phase filling of the hepatic vein is indicative of arteriovenous (hepatic artery to hepatic vein) shunts. Visualization of a vessel connecting portal veins to hepatic veins or the IVC is indicative of portovenous (portal vein to hepatic vein) shunts.
- •
As a result of extensive vascular shunting the common hepatic artery is dilated and tortuous, often exceeding 10 mm in diameter. A dilated common hepatic artery associated with diffuse heterogeneous parenchymal enhancement is considered diagnostic of HHT.
- •
Involvement of the liver by HHT may remain asymptomatic or result in portal hypertension caused by numerous shunts, hepatic encephalopathy, biliary disease, or high-output heart failure.
- •
Biliary disease in HHT is characterized by bile duct cysts, biliary strictures, and biliary dilatation. The findings are believed to result from biliary ischemia caused by extensive arteriovenous shunting. The ischemic biliary system is at risk of infection.
- •
Pancreatic lesions, including telangiectasias, arteriovenous fistulas, and arterial and venous aneurysms, are seen in 10% to 30% of patients.
- •
Thorax CT may show cardiomegaly, enlarged pulmonary arteries, and arteriovenous malformations in the lungs. Arteriovenous malformations may also be evident in the pancreas, gastrointestinal tract, and other organs.

Hepatic Sarcoidosis
Sarcoidosis is characterized by the presence of noncaseating granulomas scattered diffusely through multiple organs and lymph nodes. The diagnosis is usually made by the presence of characteristic findings in the chest. The liver is affected pathologically in 94% of cases, although most patients are asymptomatic with respect to their liver disease. About 70% of patients with liver involvement also have spleen involvement.
- •
The most common CT finding is hepatomegaly.
- •
Noncontrast CT may show innumerable small (submillimeter to 2 cm) hypoattenuating lesions in the liver and spleen. The appearance overlaps that of lymphoma.
- •
The lesions are hypovascular, showing little enhancement during the arterial phase, but may become isoattenuating with liver parenchyma in the portal venous phase.
- •
Diffuse lymphadenopathy is often present (30%) and sometimes massive (>2 cm nodes) (10%).
- •
A key to differentiating liver sarcoid from lymphoma, metastatic disease, or microabscesses is to note that the patient is young and generally not clinically ill or symptomatic.
Viral Hepatitis
The various forms of viral hepatitis are the most common cause of liver disease worldwide. Acute viral hepatitis is most commonly caused by hepatitis A virus, hepatitis B virus, hepatitis C virus, or hepatitis E virus. Other viral causes include hepatitis D virus, human immunodeficiency virus (HIV), Coxsackie virus, and herpes simplex virus. Diagnosis is usually made clinically and by laboratory testing. Imaging may be obtained to exclude other conditions.
- •
On CT acute viral hepatitis may show heterogenous enhancement, periportal edema, focal low-attenuation areas, and gallbladder wall thickening.
- •
Acute fulminant viral hepatitis with liver failure appears on CT as an enlarged and edematous liver, heterogeneously low in attenuation on noncontrast CT. With contrast agent administration the liver parenchyma is enhanced irregularly and remains heterogeneous. Findings of confluent fibrosis and scarring are often evident on follow-up.
- •
Chronic viral hepatitis often appears normal on CT but may progress to hepatic fibrosis, cirrhosis, portal hypertension, ascites, and splenomegaly.
Focal Liver Masses
CT of the abdomen performed for any reason may reveal liver lesions that require accurate characterization. Clinically significant liver lesions require immediate treatment or follow-up and include malignancies, infections, and lesions that may hemorrhage or become malignant. Examples include metastases, HCC, choriocarcinoma, lymphoma, hepatic angiosarcoma, abscesses, and hepatic adenomas. Incidental liver lesions must be confidently diagnosed so that the patient can be reassured. Examples include benign liver cysts, hemangiomas, FNH, and focal fatty infiltration or sparing.
Predominantly Solid Liver Masses
Predominantly solid liver masses displace or replace hepatic parenchyma, have internal blood vessels, and are firm and stable in shape. Most predominantly solid masses may undergo cystic degeneration or necrosis.
Metastases
Metastases are the most common malignant tumors in the liver, outnumbering primary malignant tumors by a ratio of 18:1. Metastatic liver disease is a common cause of death in cancer patients. Liver metastases can originate from almost any primary malignant tumor, but most arise from the gastrointestinal tract, especially the colon. Usually, metastases are multiple, but the greatest problems in differentiation occur when they are solitary. A wide spectrum of CT appearance is possible:
- •
A well-defined low-attenuation solid mass with vague peripheral enhancement producing a target appearance is most common.
- •
Hypovascular metastases are best seen during the portal venous phase, appearing with low density in a background of enhanced liver parenchyma. Metastases from colon cancer are characteristically hypovascular ( Fig. 11.22 ).
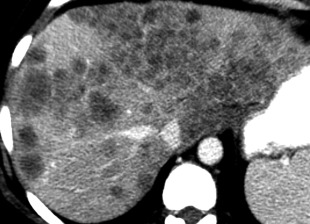
FIG. 11.22
Metastases.
Postcontrast CT in the delayed phase shows innumerable ill-defined low-attenuation nodules throughout the enhanced liver. Many nodules show confluent growth. Hepatic vessels are distorted by the mass effect of these metastases from colon carcinoma.
- •
Hypervascular metastases show diffuse enhancement during the arterial phase, appearing bright on a background of darker liver parenchyma. Most hypervascular metastases show washout of contrast medium in the delayed phase. The most common hypervascular metastases are carcinoid, choriocarcinoma, melanoma, pancreatic neuroendocrine tumor, pheochromocytoma, renal cell carcinoma, and thyroid carcinoma. About 15% of breast cancer metastases to the liver are hypervascular. If the primary lesion is known to be hypervascular, arterial phase imaging is required for detection. Hypervascular metastases may not be detectable on portal venous phase imaging alone.
- •
Tiny liver nodules that cause perfusion changes in liver parenchyma are likely to be metastases.
- •
Metastases may appear with high attenuation on noncontrast scans, especially when the liver is fatty infiltrated.
- •
Cystic/necrotic tumors are nonenhancing and low in attenuation centrally. Common primary tumors include mucinous colon carcinoma, lung carcinoma, melanoma, and carcinoid.
- •
Metastases may be calcified when the primary neoplasm is mucinous adenocarcinoma, osteosarcoma, or chondrosarcoma.
- •
Diffusely infiltrating metastases mimic cirrhosis and may not appear as distinct masses.
- •
Metastases are uncommon in cirrhotic livers.
In summary, metastases can look like almost every other lesion in the liver and must always be considered a possibility.
Hepatocellular Carcinoma
Hepatoma is the most common primary hepatic malignancy. In Western countries, 80% of HCCs arise in cirrhotic livers. Most patients are older than 50 years. Elevated serum alpha-fetoprotein level is a common clinical clue to the diagnosis. Chronic hepatitis B and hepatitis C are major risk factors for development of HCC. About 12% of patients with chronic hepatitis develop HCC. HCC occurs in 3% to 6% of patients with other causes of cirrhosis. Detection of HCC on CT is limited by the extensive abnormalities seen with cirrhosis. Historically as many as 40% of all HCCs in cirrhotic livers are missed by CT.
To improve image detection, especially of small HCCs, the American College of Radiology created the Liver Imaging Reporting and Data System (LI-RADS) as a system for standardized acquisition, interpretation, reporting, and data collection specifically and solely for patients with cirrhosis, chronic hepatitis B viral infection, or current or prior HCC. LI-RADS does not apply to patients younger than 18 years or patients with cirrhosis caused by vascular disorders or congenital hepatic fibrosis. The system, periodically updated, applies to CT, magnetic resonance imaging, and contrast-enhanced ultrasound imaging findings. Liver lesions are characterized as to the relative risk of HCC using a defined lexicon and scoring algorithm ( Table 11.3 ). See Suggested Reading for the American College of Radiology weblink for complete details and the most recent updates of LI-RADS.
| LI-RADS Category | Examples | Management |
|---|---|---|
| LR-1: definitely benign | Benign cyst, hemangioma, focal fat deposition or sparing, perfusion alteration such as arterioportal shunt, vascular anomalies, definite confluent fibrosis or focal scar, hypertrophic pseudomass | Continued routine surveillance, as appropriate |
| LR-2: probably benign | Examples as listed for LR-1 but with less confident findings | Continued routine surveillance, as appropriate |
| LR-3: intermediate probability of HCC | Includes nodules with features of focal nodular hyperplasia or hepatic adenoma | Variable follow-up (depends on clinical considerations) |
| LR-4: probably HCC | Additional imaging, biopsy, treatment, or close follow-up | |
| LR-5: definitely HCC | 100% certainty of HCC | Treat without biopsy Radiologic TMN staging |
| LR-TIV: definitely tumor invading vein | Treat without biopsy Radiologic TMN staging | |
| LR-TR: treated, posttreatment observation categories | Close follow-up to assess treatment response. Retreat if needed | |
| LR-M: probably or definitely malignant but not HCC | Cholangiocarcinoma, lymphoma, metastases | Biopsy, additional imaging, treatment, or close follow-up |
| LR-NC: not categorizable | Because of omission or degradation of key images or phases of contrast enhancement |
Small HCC, defined as less than 2 cm in diameter, overlap the appearance of high-grade dysplastic nodules. Detection leading to treatment of small HCC is a major goal of hepatic imaging in cirrhosis and LI-RADS ( Fig. 11.23 ).

Related posts:

Stay updated, free articles. Join our Telegram channel

Full access? Get Clinical Tree


