and Michael F. Sorrell2
(1)
Herbert B. Saichek Professor of Radiology, University of Nebraska Medical Center, Omaha, NE, USA
(2)
Robert L. Grissom Professor of Medicine, University of Nebraska Medical Center, Omaha, NE, USA
122 Autoimmune Hepatitis I: Serial MRI Changes with Laboratory Correlation
Autoimmune hepatitis (AIH) is a progressive, chronic disease with unknown etiology and can occur both in children and adults. A fluctuating course with overtime worsening liver function is the hallmark of the disease. The laboratory abnormalities include increased transaminases and serum autoantibodies. Distinction from other forms of chronic hepatitis is important because the majority of patients respond to anti-inflammatory or immunosuppressive therapy. Two different types of AIH have been identified: Types I and II that have different set of autoantibodies. The clinical presentation of AIH is variable, ranging from almost no symptoms to debilitating and fulminant disease. Patients with severe disease present with profound jaundice, prolonged prothrombin time (PT), and transaminase levels in the thousands. Physical examination may reveal hepatomegaly, splenomegaly, and signs and symptoms of chronic liver disease. Laboratory abnormalities mainly include elevated transaminases (more striking than bilirubin and alkaline phosphatase). Diagnosis is primarily based on the presence of serum autoantibodies and liver biopsy (plasma cell infiltrates). Imaging findings are often nonspecific, however, can help to monitor acute and chronic serial changes. Due to lack of ionizing radiation and safer contrast media, MR imaging is best suitable for this purpose.
MR Imaging Findings: Serial Changes
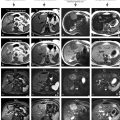
Three original images (two single-shot and one delayed phase images) and one three-dimensional shaded surface rendering (3D SSR) were chosen from MRI exams performed, respectively, in 2010, 2011, and 2013, to demonstrate the serial MRI findings in AIH (Fig. 122.1).
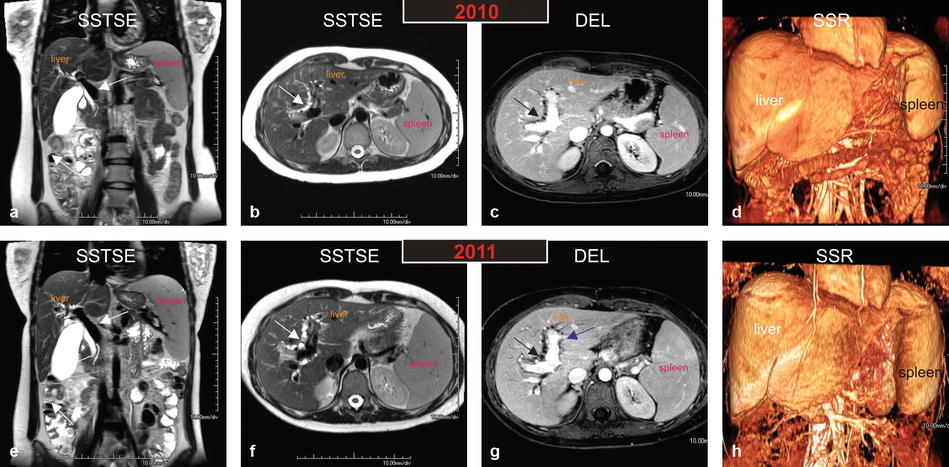
Fig. 122.1
Autoimmune hepatitis (AIH) in a young woman (age of onset, 13 years; the most recent MRI, at the age of 26 years): serial MR imaging findings with liver function test correlation. (a–d) MRI, performed in 2010, shows a prominent portal vein (arrow in a), mild irregularity of the intrahepatic bile ducts (arrow in b and c). The shaded surface rendering (SSR) confirms the mild splenomegaly with mild remodeling of the liver. (e–h) MRI, performed in 2011, shows a more prominent portal vein (arrow in e), marked irregularity of the intrahepatic bile ducts (arrow in b and c). Note also the increased size of the portal vein that abundantly enhances (purple arrow in g). The shaded surface rendering (SSR) shows marked splenomegaly with increased remodeling of the liver. The constellation of findings suggests marked progression of disease within a period of 1 year. AIH in this patient shows involvement of the hepatic parenchyma as well as the biliary tree; increased size of the portal vein and the spleen suggests development of portal hypertension
In the earlier stages of the disease, the liver appears with sharp and smooth edges. There may be significant hepatomegaly, likely due to acute and subacute inflammatory liver parenchymal changes. In addition to the liver parenchymal changes, there may also be irregularity and slight dilatation of the bile ducts, particularly, if there is a coexistent overlap syndrome, such as primary sclerosing cholangitis or autoimmune cholangitis. Due to the loss of compliance in the biliary tree, the gallbladder may be prominent. The spleen is often normal in size (Fig. 122.1a–d).
In the later stages of the disease, the liver may start to show remodeling due to the ongoing inflammation and fibrosis. The liver may show blunted edges and decreasing size. The irregularity of the biliary tree may increase. There may be a prominent portal vein and moderate splenomegaly, indicating the presence of portal hypertension (Fig. 122.1e–h).
Toward the end stage of the disease, the liver may shrink and become irregular due to more pronounced changes of fibrosis and even cirrhosis. The portal vein will become more prominent with ascites, collaterals, and marked splenomegaly (Fig. 122.2a–d).
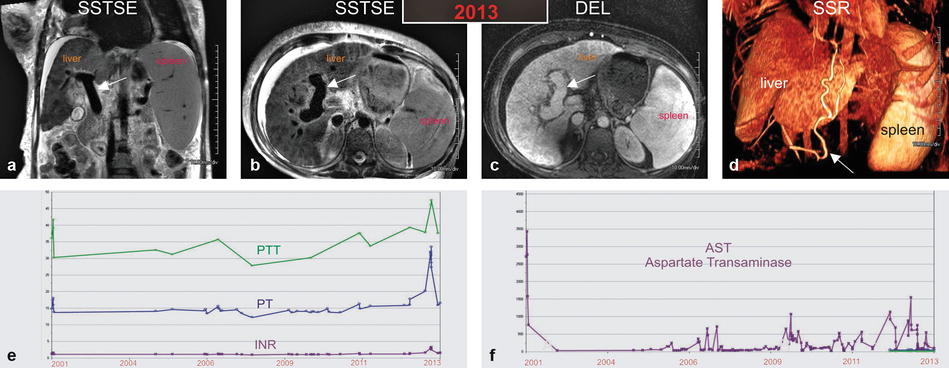
Fig. 122.2
Autoimmune hepatitis (AIH) in a young woman (age of onset, 13 years; the most recent MRI, at the age of 26 years): serial MR imaging findings with liver function test correlation. (a–d) MRI, performed in 2013, shows a very prominent portal vein (arrow in a – c). Note that the biliary dilatation and irregularity have resolved. New findings include generalized atrophy of the liver, moderate ascites, extensive body wall edema, and right pleural effusion. The shaded surface rendering (SSR) shows severe global atrophy of the liver, massive splenomegaly, and large collateral vessels (arrow in d). (e, f) Graphs show liver function tests over a period of 12 years. Partial thromboplastin time (PTT), prothrombin time (PT), international normalized ration (INR), and AST show an initial peak in 2001 with interval fluctuations and another peak in 2013
The laboratory abnormalities correlate well with the serial MR imaging findings. The periods with peaking transaminase levels are interspersed by relatively normal levels, reflecting the fluctuating nature of the disease (Fig. 122.2f). After each acute episode, the liver morphology and function progressively get worse. This is mirrored in the increasing values of partial thromboplastin time, prothrombin time, and international normalized ratio (Fig. 122.2e).
Differential Diagnosis
The serial MR imaging findings are non-specific and could be seen in any liver parenchymal disease, such as viral and alcoholic hepatitis. In addition, due to the overlap of AIH with other syndromes, the differential diagnosis may also include PSC and AIC. It is imperative to correlate the MRI findings with the clinical and laboratory abnormalities.
Management
Management options include anti-inflammatory or immunosuppressive therapy that includes prednisone (with or without azathioprine). Azathioprine is added especially in patients with changes of fibrosis or cirrhosis. Alternative agents include mercaptopurine. Liver transplantation is reserved for refractory cases that develop end-stage liver disease with cirrhosis.
Literature
1. Krawitt EL. Autoimmune hepatitis. N Engl J Med. 2006;354:54–66.
2. Czaja AJ, Bianchi FB, Carpenter HA, et al. Treatment challenges and investigational opportunities in autoimmune hepatitis. Hepatology. 2005;41:207–15.
3. Bilaj F, Hyslop BW, Rivero H, Semelka RC, et al. MR imaging findings in autoimmune hepatitis: correlation with clinical staging. Radiology. 2005;236:896–902.
123 Autoimmune Hepatitis II: Overlap Syndromes
Autoimmune hepatitis (AIH) is a progressive, chronic disease with unknown etiology and can occur in both children and adults. AIH is in fact one of the three major autoimmune disorders: the other two being primary biliary cirrhosis (PBC) and primary sclerosing cholangitis (PSC). Variant forms of these diseases are generally called overlap syndromes. Without proper treatment or response to treatment, the overlap syndromes, similar to the isolated AIH, progress to cirrhosis (Fig. 123.1).
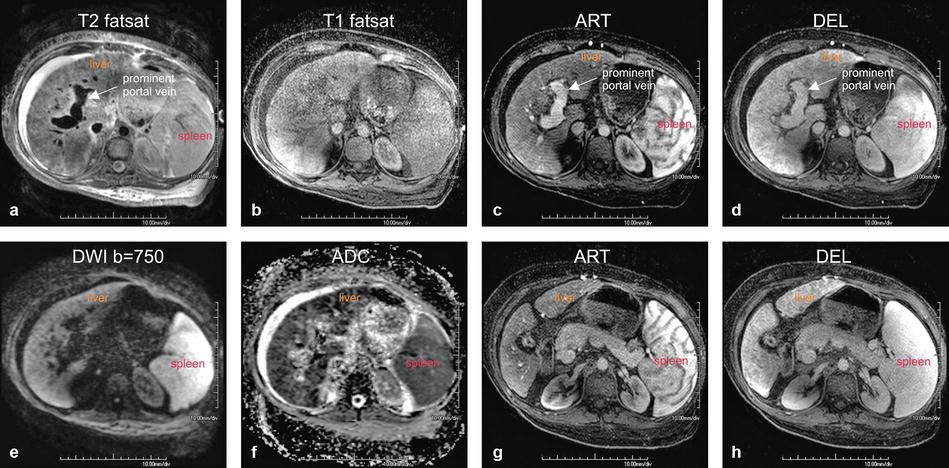
Fig. 123.1
Autoimmune hepatitis (AIH) in a young woman (age of onset, 13 years; the most recent MRI, at the age of 26 years shown in this figure) (see also Fig. 122). (a) Axial fat-suppressed T2-weighted (T2 fatsat) image shows a very bright liver due to extensive inflammatory changes, severely dilated portal vein with massive splenomegaly suggesting portal hypertension, and perihepatic ascites with body wall edema due to liver failure. (b) Axial fat-suppressed T1-weighted (T1 fatsat) image serves as the baseline for the arterial phase image in c. (c, d) Axial arterial and delayed phase gradient-echo (ART and DEL) images show mildly heterogeneous enhancement of the liver with a prominent portal vein (arrow). (e, f) Diffusion-weighted image (DWI b=750) and the ADC map show restricted diffusion throughout the liver, reflecting the inflammatory changes. (g, h) Axial arterial and delayed phase images (ART and DEL) at a different anatomic level than the images in c and d again show mildly heterogeneous enhancement of the liver; note the contracted gallbladder with thickened wall, which is likely sequela of the involvement of biliary tree in this patient with AIH
AIH and PBC are the most common autoimmune liver disorders and occur, respectively, in 17/100,000 and 25–40/100,000 in Europe and USA with a female predominance (PBC, 95 %, and AIH, 80 %). Patients with the overlap syndromes will present with the symptoms of both hepatitis and cholestasis.
At histology, the findings are mixed and we may see a combination of AIH-PSC or AIH-PBC. Studies suggest that AIH-PBC combination occurs most commonly among the overlap syndromes. The AIH-PSC is mostly observed in children (Fig. 123.2).
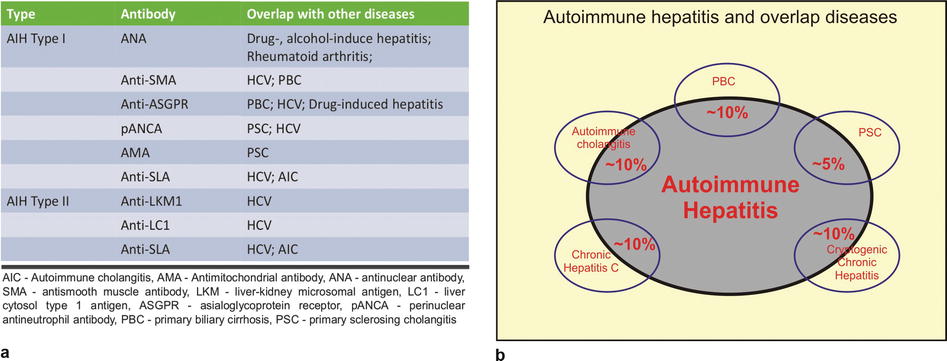
Fig. 123.2
Autoimmune hepatitis (AIH) and overlap diseases. (a) The table shows two types of AIH with the specific antibodies and the association with other diseases. From the imaging perspective, it is important to know that in a patient with AIH, the abnormalities may affect the liver parenchyma as well as the bile ducts (PBC, PSC, and AIC) simultaneously. In addition, the radiologists should keep in mind that the systemic illnesses such rheumatoid arthritis can present as diffuse liver parenchymal disease. (b) The drawing illustrates the overlap between the AIH and several other diseases; please note that the percentages are provided as approximate values reflecting the variation in the literature
Two types of AIH have been described in the literature, which are characterized by different types of autoantibodies. Type I AIH is often associated with various antibodies, including antinuclear antibodies (ANA), antimitochondrial antibodies (AMA), and anti-smooth muscle antibodies (anti-SMA) (see Fig. 123.2a). Type II AIH is mostly associated with anti-liver-kidney microsomal antigen (anti-LKM1).
It is important for radiologists to be familiar with the liver parenchymal disorders, including AIH and its variants, to better recognize the imaging findings and help the clinicians with suggesting the possible diagnosis.
At MR imaging, there may be little to no abnormalities during the earlier stages of the disease as shown in the prior figure. During the advanced stages, the T-weighted images show a liver with irregular edges and generalized atrophy. The T2 signal intensity is much higher than in the normal liver. The portal vein may be enlarged as a sign of portal hypertension. After injection of contrast, the liver may show heterogeneous enhancement. The diffusion-weighted images (DWI) and apparent diffusion coefficient (ADC) demonstrate mildly restricted diffusion throughout the liver (see Fig. 123.1).
Literature
1. Krawitt EL. Autoimmune hepatitis. N Engl J Med. 2006;354:54–66.
2. Invernizzi P, Mackay IR. Overlap syndromes among autoimmune liver diseases. World J Gastroenterol. 2008;14:3368–73.
3. Alvarez F, Berg PA, Bianchi FB, et al. International autoimmune hepatitis group report: review of criteria for diagnosis of autoimmune hepatitis. J Hepatol. 1999;31:929–38.
4. Bilaj F, Hyslop BW, Rivero H, Semelka RC, et al. MR imaging findings in autoimmune hepatitis: correlation with clinical staging. Radiology. 2005;236:896–902.
5. Czaja AJ. The variant forms of autoimmune hepatitis. Ann Intern Med. 1996;125:588–98.
124 HIV/HCV Hepatitis Developing into Cirrhosis with Laboratory Correlation
Approximately 33 million people worldwide are living with human immunodeficiency virus (HIV) infection, and up to 50 % of HIV-infected individuals are also infected with hepatitis C virus (HCV). Whatever the exact percentage, we have to realize that chronic hepatitis C virus (HCV) coinfection is common in patients with human immunodeficiency virus (HIV) infection.
During the early years without effective treatment for HIV infection, the clinical course of HCV coinfection was likely overshadowed by the high morbidity and mortality of patients with AIDS. With the introduction of highly active antiretroviral therapy (HAART) and its associated improvements in survival, HCV coinfection has now emerged as a significant comorbid disease in patients with HIV. Although the exact mechanism is not completely understood and may or may not be associated with specific HAART use, HCV appears to have a much more progressive course in coinfected patients compared with those with HCV monoinfection. With recent improvements in HCV therapy in patients with coinfection, accurate assessment of liver disease severity is now even more important in the evaluation of HCV.
The gold reference standard for determining hepatic histology is liver biopsy. However, liver biopsy is an invasive procedure that has been associated with complications, and there are concerns regarding sampling error and inter- and intraobserver variation in interpretation. Several authors have developed scoring systems to detect changes of active hepatitis to cirrhosis in patients with HIV/HCV coinfection. Imaging can also play an important role to noninvasively detect such changes.
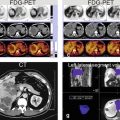
At MR imaging, during the earlier stages of HIV/HCV coinfection, the liver may rapidly increase in size (hepatomegaly) due to the presence of active infection and edema. The signal intensity throughout the liver will increase on the T2-weighted images. The pre-contrast T1-weighted images are often nonspecific. After injection of contrast, diffuse and patchy enhancement is seen in the arterial phase that fades to isointensity in the delayed phase. Due to hepatomegaly, the portal vein will be compressed and there may be mild splenomegaly (Fig. 124.1a–d). Over relatively a short period of time (only a few years), the early acute liver parenchymal appearance may show dramatic transition into the subacute and chronic changes of fibrosis and cirrhosis. During this period, the MR imaging will show significant contour irregularity, atrophy of some liver segments, hypertrophy of the other liver segments, increase in the size of the portal vein, increased splenomegaly, and extensive collateral formation (Figs. 124.1e–h and 124.2). The MR imaging findings of active inflammation correlate well with the surge in the liver enzymes, such as aspartate transaminase (compare Figs. 124.1a–d and 124.2f).
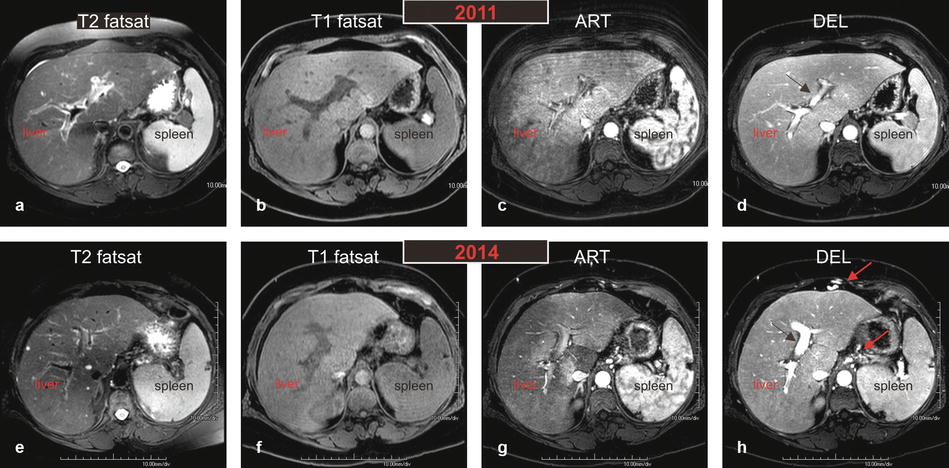
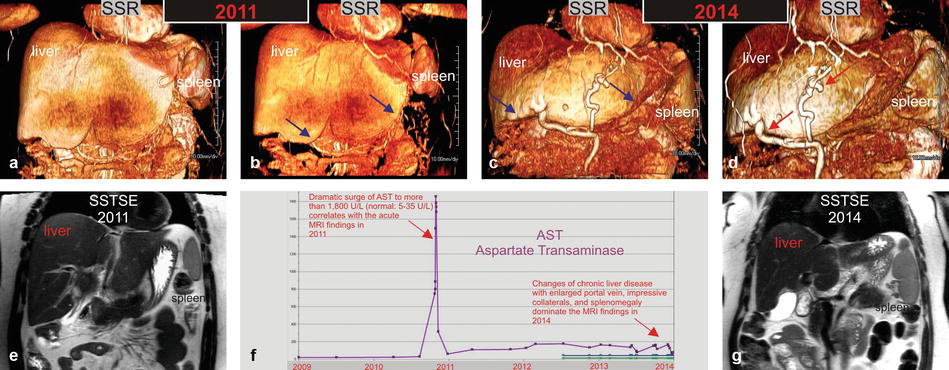
Fig. 124.1
HIV/HCV hepatitis: serial MRI changes of acute to chronic liver disease with liver function test correlation in an HIV- and HCV-positive patient. (a–d) MR images performed in 2011 demonstrate overall increased T2 signal throughout the liver (in a) with tiny perihepatic ascites and prominent spleen; findings suggest liver infection with inflammation. The arterial phase (c) shows dramatic diffuse and patchy enhancement of the entire liver with somewhat compressed and small portal vein (arrow in d). (e–h) MR images performed in 2014 demonstrate overall decreased T2 hyperintensity of the liver parenchyma (in e) with resolved perihepatic ascites. The spleen, however, has increased in size. The liver contours have become more rounded and undulating suggesting chronic liver disease. The arterial phase (c) shows significantly decreased liver parenchymal enhancement. The portal vein has markedly increased in size (black arrow) and in combination with splenomegaly suggesting portal hypertension. Note also large collateral vessels around the liver with GE junction varices (red arrows)
Fig. 124.2
HIV/HCV hepatitis: serial MRI changes of acute to chronic liver disease with liver function test correlation in an HIV- and HCV-positive patient. (a, b, e) Shaded surface renderings (SSR) (a and b) and single-shot TSE images (SSTSE) based on the MRI from 2011 show impressive hepatomegaly related to the acute changes of hepatitis; note that the liver contours are sharp (blue arrows in b) and the spleen appears only slightly prominent. (c, d, g) SSR and SSTSE images based on the MRI from 2014 show changes of chronic liver disease, including atrophy of the right liver, hypertrophy of the left liver, blunt liver contours (blue arrows in c), splenomegaly, and impressive collaterals around the liver (red arrows in d). (f) Aspartate transaminase (AST) graph over a period of 5 years demonstrates a dramatic surge in 2011 corresponding to the acute MRI findings
In a patient with HIV/HCV coinfection, more frequent imaging is necessary to monitor the liver parenchymal changes. MR elastography may also play a role in the future.
Literature
1. Soriano V, et al. Care of patients with chronic hepatitis C and HIV co-infection: recommendations from the HIV-HCV International Panel. AIDS. 2002;16:813–28.
2. Soriano V, et al. Care of patients coinfected with HIV and hepatitis C virus: 2007 updated recommendations from the HCV-HIV International Panel. AIDS. 2007;21:1073–89.
3. Gupta P, Hepatitis C. Virus and HIV type 1 co-infection. Infect Dis Rep. 2013;5 Suppl 1:e7.
4. Venkatesh SK, et al. Magnetic resonance elastography of liver: technique, analysis, and clinical applications. J Magn Reson Imaging. 2013;37:544–55.
125 Congestive Hepatopathy (Nutmeg Liver)
Passive liver congestion secondary to increased hepatic venous pressure may accompany congestive heart failure. Congestive hepatopathy (aka nutmeg liver or cardiac cirrhosis) includes a spectrum of hepatic derangements that occur in the setting of right-sided heart failure. Clinically, the signs and symptoms of congestive heart failure (CHF) dominate the disorder.
Distinguishing cardiac cirrhosis from the other forms of hepatitis and Budd-Chiari syndrome is important. Despite its name, cardiac cirrhosis (which usually implies congestive hepatopathy that results in liver fibrosis) rarely satisfies strict pathologic criteria for cirrhosis. The terms congestive hepatopathy and chronic passive liver congestion are more accurate, but the name cardiac cirrhosis has become convention.
Patients present with decompensated right ventricular or biventricular heart failure which causes transmission of elevated right atrial pressure to the liver via the inferior vena cava and hepatic veins. At a microscopic level, venous congestion impedes efficient drainage of sinusoidal blood flow into terminal hepatic venules. As a result, sinusoidal stasis occurs with accumulation of deoxygenated blood, parenchymal atrophy, necrosis, and fibrosis. While systemic venous hypertension appears to be the major factor in producing centrilobular congestion, centrilobular necrosis correlates more closely with decreasing cardiac output in patients with cardiac failure. Causes of congestive hepatopathy mirror the many etiologies of right-sided CHF, including congenital heart disease.
Ultrasound studies may suggest the diagnosis with demonstration of hepatic enlargement with dilatation of the inferior vena cava (IVC) and hepatic veins. CT examinations showed cardiomegaly with cardiac failure and pericardial effusion or thickening with pericardial disease. Also noted were distention of the inferior vena cava (IVC), hepatomegaly, early reflux of contrast medium into the IVC in 21 and hepatic veins in 16, and hepatic perivascular lymphedema in 6. The abnormal patterns are thought to be due to slowing of hepatic blood flow. Confusion with Budd-Chiari syndrome and other forms of multifocal hepatic disease is avoidable with imaging studies.
At MR imaging, marked hepatic venous and IVC dilatations with hepatomegaly are seen on all sequences. The T2-weighted sequences demonstrate a bright liver due to edema and inflammation. After injection, there may be reflux of contrast into the dilated IVC and hepatic veins in the arterial phase. Heterogeneous nutmeg-like enhancement is typically visible in the arterial phase, which persists in the delayed phase images. Restricted diffusion may be present. If liver-specific gadolinium-based contrast agent (gadoxetate or gadobenate) has been injected, the hepatobiliary phase images will demonstrate almost homogeneous uptake of contrast into the hepatocyte and can exclude any underlying malignancy that might be suggested based on the early heterogeneous enhancement (Figs. 125.1 and 125.2).
Fig. 125.1
Congestive hepatopathy (nutmeg liver): hepatomegaly, dilated hepatic veins, and the IVC with nutmeg liver enhancement. (a) Axial fat-suppressed T2-weighted TSE image (T2 fat sat) shows the enlarged right, middle, and left hepatic veins (rhv, mhv, lhv) as well as the inferior vena cava (IVC).Note the small bilateral pleural effusion. (b) Axial fat-suppressed T1-weighted GRE (T1 fatsat) shows the similar findings. (c) Axial arterial phase 3D T1-weighted GRE image (ART) shows minimal heterogeneous enhancement of the liver. (d) Axial portal phase GRE image (POR): the liver shows the nutmeg pattern of enhancement, which is classic for congestive hepatopathy. (e) Axial diffusion-weighted image (DWI b=500) shows dilated hepatic veins and the IVC; the liver shows high signal due to some restricted diffusion. (f) Axial fat-suppressed T1-weighted GRE (T1 fatsat) shows the dilated hepatic veins and the IVC. (g) Axial arterial phase 3D T1-weighted GRE image (ART) shows reflux of contrast from the right atrium into the ivc and the hepatic veins. (h) Axial delayed phase GRE image (DEL): the liver shows more homogeneous enhancement with the enhanced liver veins (rhv, mhv, lhv) and the IVC
Fig. 125.2
Congestive hepatopathy (nutmeg liver): portal enhancement phase (POR) and hepatobiliary phase (HBP) findings. (a–d) Typical nutmeg pattern of enhancement is visible throughout the liver. (e–g) HBP was performed in this patient because of a suspected focal nodular hyperplasia. The liver shows minimally heterogeneous uptake of contrast reflecting the liver parenchymal changes. (h) Cross section of a nutmeg showing the typical pattern that has the resemblance with the enhancement seen in the portal phase on the MR images
The imaging findings of congestive hepatopathy are dramatically different from Budd-Chiari syndrome that typically shows narrowed or thrombosed hepatic veins and/or IVC, causing outflow obstruction.
Literature
1. Holley HC, et al. Inhomogeneous enhancement of liver parenchyma secondary to passive congestion: contrast-enhanced CT. Radiology. 1989;170:795–800.
2. Moulton JS, et al. Passive hepatic congestion in heart failure: CT abnormalities. AJR Am J Roentgenol. 1988;151:939–42.
3. Alicia M, et al. Liver abnormalities in cardiac diseases and heart failure. Int J Angiol. 2011;20:135–42.
4. Shinagawa H, et al. Increased serum bilirubin levels coincident with heart failure decompensation indicate the need for intravenous inotropic agents. Int Heart J. 2007;48:195–204.
126 Dixon-Based Sequence: Assessment of Liver Fat and Iron Deposition
The spectrum of fatty liver disease includes mild steatosis to nonalcoholic steatohepatitis (NASH); NASH often progresses into fibrosis and cirrhosis. Recent decades has witnessed an epidemic increase in nonalcoholic fatty liver disease (NAFLD), which may affect 10–24 % of the general population. Eventually, cirrhosis develops in 20–25 % of patients with NASH and increases the risk for developing hepatocellular carcinoma (HCC). Alcoholic steatohepatitis and NASH are histologically indistinguishable. The criteria for the diagnosis of NASH include alcohol consumption <20 g/day, detailed history obtained independently by three physicians, interrogation of family members, and no hepatitis B or C infection. Apart from fat detection, MRI can also detect and quantify liver iron concentration, noninvasively. Liver fat and iron deposition can coexist. The Dixon-based sequences can accurately determine both.
Related posts:

Stay updated, free articles. Join our Telegram channel

Full access? Get Clinical Tree


