and Michael F. Sorrell2
(1)
Herbert B. Saichek Professor of Radiology, University of Nebraska Medical Center, Omaha, NE, USA
(2)
Robert L. Grissom Professor of Medicine, University of Nebraska Medical Center, Omaha, NE, USA
142 Bile Leakage: Liver-Specific MR Contrast and Correlation with US, CT, and HIDA
Bile duct injury during cholecystectomy is a serious surgical complication that can have devastating consequences, including a significant risk of early death. Bile duct injury also has a major effect on healthcare costs, since injured patients frequently need prolonged and repeated hospital stay, multiple re-interventions, and long sick leave. In anatomically difficult cholecystectomies, which probably carry a high risk of bile duct injury, it is difficult to perform a successful intraoperative cholangiogram, thus reducing the cholangiography rate in cholecystectomies prone to bile duct injury. Törnqvist et al. recently reported a cumulative incidence of bile duct injury during laparoscopic cholecystectomy of 1.5 %. A majority of bile duct injuries detected postoperatively were discovered as bile leakage, either from the cystic duct (46 %) or from small ducts in the liver bed (18 %), whereas only a small number (2 %) of the injuries with delayed detection were classified as severe.
Biliary complications are more common after laparoscopic than after open cholecystectomy and include bile duct damage, biliary obstruction, and dropped stones. Injury to the bile ducts often goes unrecognized at the time of surgery. There should be a high level of suspicion when patients are referred with symptoms of abdominal pain, sepsis, or jaundice soon after laparoscopic cholecystectomy.
Initial assessment in patients with suspected bile duct injury is usually with ultrasound or CT, which may show free fluid or fluid collection in the right upper quadrant. Hepatobiliary scintigraphy (HIDA scan) is a less commonly used noninvasive method of evaluating patients with suspected bile duct injury. Major disadvantage is that HIDA scan is a functional exam and another imaging study may be needed to further evaluate the findings. ERCP is invasive and useful in patients in whom there is a strong suspicion of bile duct injury, with the possibility to treat the leak using internal stent. Open surgery is the main alternative to ERCP in cases of persistent large leaks.
MR imaging and MR cholangiopancreatography (MRCP) either using gadobenate or gadoxetate can be used to assess any suspected bile leakage. The accuracy of liver-specific gadolinium-based contrast agent for the detection of bile leak varies approximately 80 %. Typically, MRI and MRCP images will show nonspecific findings of ascites, which could be traced into the gallbladder fossa in most cases. Specific finding includes the increased signal intensity of the ascites on the hepatobiliary phase (HBP) fat-suppressed 3D gradient-echo T1-weighted images (20 min after gadoxetate and 1–2 h after gadobenate injection). These images should be compared with the pre-contrast fat-suppressed T1-weighted images. The increased T1 signal intensity is due to the contrast that leaks from the injured bile duct into the peritoneal cavity (Figs. 142.1 and 142.2). Normally, the liver-specific contrast agents show uptake in the liver and are excreted via the bile ducts into the bowel. Although gadobenate can be used, gadoxetate is favorable to assess suspected bile leakage due to its shorter 20-min HBP and larger amount (50 %) of biliary excretion.
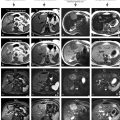
Fig. 142.1
Bile leakage: MRI findings with liver-specific contrast after recent cholecystectomy. (a) Axial single-shot TSE image (SSTSE): large ascites and fluid in the gallbladder fossa suspicious for a biloma (arrow). (b) Axial fat-suppressed T1-weighted GRE (T1 fatsat) shows no additional findings. (c–d) Axial arterial and delayed phase 3D T1-weighted GRE images (ART and DEL) show normal enhancement of the upper abdominal organs. (e) Magnetic resonance cholangiopancreatography (MRCP) shows mildly dilated intrahepatic ducts that are discontinuous with the common bile duct, suggesting biliary injury (green arrows). Note also the large subhepatic fluid (blue arrows) that appears to originate from the area of the suspected bile leak. (f–g) Coronal SSTSE (SSTSE) at two different levels shows large amount of ascites. (h) Coronal 3D T1-weighted hepatobiliary phase (HBP) acquired about 2 h after the injection of gadobenate (MultiHance) shows bright ascites in the left upper abdomen, which is consistent with bile leak. Gadobenate is taken up by the hepatocytes and excreted via the bile ducts into the bowel. In this patient, the contrast has leaked from the bile ducts into the abdominal cavity increasing the T1 signal of ascites
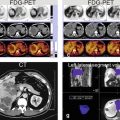
Fig. 142.2
Status post recent cholecystectomy with suspected bile leak: MRI, MRCP, CT, and HIDA correlation. (a) Pre-contrast T1-weighted (T1 pre) and (c–d) post-contrast hepatobiliary phase (HBP) images acquired about 2 h after the injection of gadobenate (MultiHance) show bright ascites in the left paracolic gutter (red arrows), consistent with bile leak. Gadobenate (MultiHance) as well as gadoxetate (Eovist) can be used to assess bile leak. (e–h) [a different patient post–cholecystectomy with suspected bile leak] Coronal CT and HIDA (hepatobiliary iminodiacetic acid) scan reconstructions show the gallbladder fossa, perihepatic, and right paracolic gutter ascites (arrows in E and F) with the radiopharmaceutical activity on the HIDA scan corresponding to the location of the ascites on the CT (arrows in e–h)
Literature
1. Balci NC, Semelka RC. Contrast agents for MR imaging of the liver. Radiol Clin North Am. 2005;43:887–98.
2. Seale MK, et al. Hepatobiliary-specific MR contrast agents: role in imaging the liver and biliary tree. Radiographics. 2009;29:1725–48.
3. Lee NK, et al. Biliary MR imaging with Gd-EOB-DTPA and its clinical applications. Radiographics. 2009;29:1707–24.
4. Tripathi M, et al. Hepatobiliary scintigraphy: an effective tool in the management of bile leak following laparoscopic cholecystectomy. Clin Imag. 2004;28:40–3.
5. Ergen FB, et al. Visualization of the biliary tract using gadobenate dimeglumine: preliminary findings. J Comput Assist Tomogr. 2008;32:54–60.
6. Thurley PD, et al. Laparoscopic cholecystectomy: postoperative imaging. AJR Am J Roentgenol. 2008;191:794–801.
7. Marin D, et al. Gadoxetate disodium-enhanced magnetic resonance cholangiography for the noninvasive detection of an active bile duct leak after laparoscopic cholecystectomy. J Comput Assist Tomogr. 2010;34:213–6.
8. Kantarcı M, et al. Non-invasive detection of biliary leaks using Gd-EOB-DTPA-enhanced MR cholangiography: comparison with T2-weighted MR cholangiography. Eur Radiol. 2013;23:2713–22.
9. Törnqvist B, et al. Effect of intended intraoperative cholangiography and early detection of bile duct injury on survival after cholecystectomy: population based cohort study. BMJ. 2012;345:e6457.
143 Caroli’s Disease I: Intrahepatic with Segmental Changes
Caroli’s disease is an autosomal recessive disorder comprised of communicating cavernous ectasia of the intrahepatic bile ducts. The disease is considered among the ductal plate abnormalities that occur at different levels in the developing biliary tree, leading to several clinicopathologic entities. The abnormalities can be present at the level of the large ducts (Caroli’s disease), small ducts (congenital hepatic fibrosis), or both (congenital hepatic fibrosis with Caroli’s disease, also called Caroli’s syndrome). Clinically, the entity is divided as follows: type I (Caroli’s disease) that is rare and is characterized by recurrent episodes of cholangitis and type II (Caroli’s disease associated with fibrosis) that is more frequent and is characterized by fibrosis and portal hypertension. Ultrasound and CT can show the multiple intrahepatic cysts in close relation to the biliary system. They fail however to actually demonstrate the communication between the two, which is important in distinguishing Caroli’s disease from polycystic liver disease or multiple abscesses. Also at ERCP and cholangiography, it may be difficult to get an overview of the entire biliary tree. MR imaging provides a better view of the biliary system as well as the parenchyma noninvasively.
MR Imaging Findings
T2-weighted and MRCP sequences show multiple saccular dilatations of the intrahepatic bile ducts. The abnormalities may be segmental with increased signal of the parenchyma on the pre-contrast T1-weighted sequences, likely due to biliary stasis. The abnormal parenchyma may show diffuse increased periportal enhancement in the arterial phase, fading to isointensity in the delayed phase. This may indicate inflammation. On the delayed phase imaging, the unenhanced bile ducts provide another possibility to assess for communicating cysts (Figs. 143.1 and 143.2).
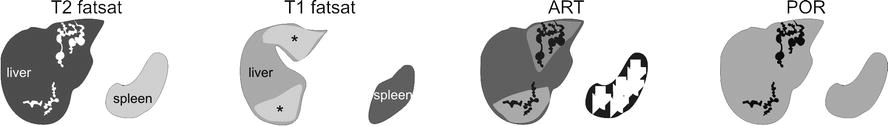
Fig. 143.1
Caroli’s disease, drawings. T2 fatsat: typical fusiform dilatations are present in the left and right liver. T1 fatsat: (at a different anatomic level) affected areas show increased signal due to cholestasis. ART: increased enhancement around the dilated ducts is probably caused by cholangitis. POR: the enhanced areas become isointense confirming the benign nature of the increased arterial enhancement
Fig. 143.2
Caroli’s disease, typical MRI findings. (a) Axial fat-suppressed T2-weighted TSE image (T2 fatsat): typical fusiform dilatations of the bile ducts are visible in the left and the right liver, with atrophy on the left side. (b) Axial fat-suppressed T1-weighted image at a lower anatomic level (T1 fatsat): increased signal of the liver parenchyma is probably caused by cholestasis. (c) Axial arterial phase image (ART): increased enhancement around the dilated ducts is most likely caused by cholangitis (arrows). (d) Axial portal phase image (DEL): the enhanced areas become isointense indicating their benign nature. Note the non-enhancing dilated bile ducts (arrow). (e) Axial SSTSE image (SSTSE): the dilated ducts can be followed up to the subcapsular region of the liver. (f) Coronal SSTSE image (SSTSE): typical dilatations of the bile ducts are visible. (g) Maximum-intensity projection of the SSTSE (MIP): the full extent of the affected bile ducts is visible with sparing of the common bile duct (arrow). (h) Coronal delayed phase image (DEL): the fusiform dilated ducts are well visible (arrow)
Pathology
Gross pathology and histology of Caroli’s disease are characterized by the saccular dilatation of the biliary tree with or without fibrosis and stasis of bile duct. Periductal inflammation and fibrosis are often present in long-standing disease (Fig. 143.3).
Fig. 143.3
Caroli’s disease, pathology (explant of another patient with long-standing disease). (a) Photograph of the explant shows a greenish liver due to cholestasis. The bile ducts are surrounded by fibrosis (open arrow). (b) and (c) Photomicrographs (H&E, 100×) show typical fusiform dilatations and narrowing of the bile ducts (arrows), which are surrounded by inflammatory cells (open arrow). (d) A drawing (based on a Caroli’s original drawing) shows typical fusiform dilatations of the biliary tree
Literature
1. Levy AD, Rohrmann Jr CA, Murakata LA, et al. Caroli’s disease. AJR. 2002;179:1053–7.
2. Desmet VJ. Congenital diseases of intrahepatic bile ducts: variations on the theme “ductal plate malformation”. Hepatology. 1992;16:1069–83.
3. Caroli J, Soupault R, Kossakowski J, Plocker L, Paradowska M. La dilatation polykystique congénitale des voies biliaires intrahépatiques: essai de classification. Sem Hop Paris. 1958;34:128–35.
144 Caroli’s Disease II: Involvement of the Liver and Kidneys
Caroli’s disease is a form of congenital (likely, autosomal recessive inheritance) dilatation of intrahepatic bile ducts. It is usually manifested in childhood. The association of Caroli’s disease with extrahepatic bile duct dilatation may be present in up to 21 % of patients. Repeated bouts of cholangitis, stone formation, and stone passage may explain extrahepatic duct dilatation in some patients with Caroli’s disease or Caroli’s syndrome. Caroli’s disease may also occur in association with cysts in the kidneys. In such cases, Caroli’s disease should be distinguished from adult polycystic liver and kidney disease. Cholangiocarcinoma is a well-known complication of long-standing Caroli’s disease. Since the original description by Caroli et al. in 1958, a number of case reports and small series have appeared in the radiology literature describing the cholangiographic, sonographic, CT, and MR imaging features of the disease.
MR Imaging Findings
On T2-weighted images, isolated hyperintense cystic lesions may be present as part of Caroli’s disease. Occasionally, the comma-shaped appearance of such cystic liver lesions may suggest biliary connection. MRCP, however, allows the evaluation of the full extent of the disease. In addition, both kidneys may show cystic lesions as well. Compared to pathology, MR imaging allows the assessment of multiple organs in a single study (Figs. 144.1, 144.2, and 144.3).
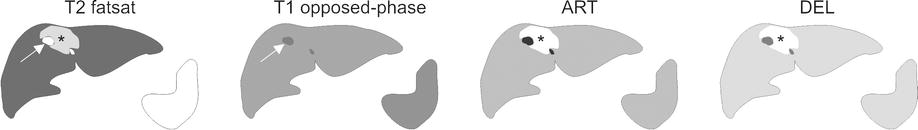
Fig. 144.1
Caroli’s disease, drawings. T2 fatsat: cyst-like abnormality (arrow) is surrounded by tissue with high signal. T1 opposed phase: no tissue abnormalities are visible. ART: local increased enhancement around the dilated ducts is probably caused by cholangitis. DEL: the enhanced area remains visible without getting heterogeneous, suggesting a benign lesion
Fig. 144.2
Caroli’s disease, liver and kidney involvement, MRI findings. (a) Axial fat-suppressed T2-weighted TSE image (T2 fatsat): cyst-like dilated bile ducts (arrow) are surrounded by an area of the liver with increased signal intensity. (b) Axial opposed-phase T1-weighted image (T1 opposed phase): dilated bile duct (arrow) is visible without parenchymal abnormalities. The area with high signal on T2 has almost normal signal on T1. (c) Axial arterial phase image (ART): increased enhancement around the dilated ducts is most likely caused by cholangitis. (d) Axial delayed phase image (DEL) shows persistent enhancement without sign of washout of contrast. (e) Axial single-shot turbo spin echo (SSTSE) shows typical comma-shaped dilated bile duct (arrow). (f) Coronal SSTSE image (SSTSE) shows cystic changes in both kidneys (arrows). (g) MRCP provided an overview of the dilated intrahepatic bile ducts as well as the gallbladder (GB). (h) MRCP from another angle shows the cyst-like structures connected to the bile ducts (arrow)
Fig. 144.3
Caroli’s disease, pathology (another patient), drawings. (a) Photomicrograph (H&E, 100×) shows dilated intrahepatic bile ducts surrounded by fibrosis and inflammation. (b) Photomicrograph (H&E, 200×) shows typical fusiform dilatations of several bile ducts (arrows). (c) Drawing (based on MRCP) shows typical dilated intrahepatic bile ducts (arrows). GB gallbladder. (d) A detailed view of the drawing shows the cyst-like dilatation with its narrow connection to the biliary tree (arrow)
Differential Diagnosis
This includes primary sclerosing cholangitis (long stenoses and dilatations; 70 % have ulcerative colitis), recurrent pyogenic cholangitis, polycystic liver disease, a choledochal cyst, biliary papillomatosis, and (occasionally) obstructive biliary dilatation.
Management
This form has a very unfavorable prognosis and treatment consists of segmental liver resection or liver transplantation.
Literature
1. Mortele, et al. Cystic focal liver lesions in the adult. RadioGraphics. 2001;21:895–910.
2. Krause, et al. MRI for evaluation congenital bile duct abnormalities. J Comput Assist Tomogr. 2002;26:541–52.
3. Desmet VJ. Congenital diseases of intrahepatic bile ducts: variations on the theme ductal plate malformation. Hepatology. 1992;16:1069–83.
4. Caroli J, Soupault R, Kossakowski J, Plocker L, Paradowska M. La dilatation polykystique congénitale des voies biliaires intrahépatiques: essai de classification. Sem Hop Paris. 1958;34:128–35.
5. Todani T, Watanabe Y, Narusue M, et al. Congenital bile duct cysts: classification, operative procedures, and review of thirty-seven cases including cancer arising from choledochal cyst. Am J Surg. 1977;134:263–9.
145 Cholelithiasis (Gallstones)
Cholelithiasis (gallstones) remains one of the most common medical problems leading to surgical intervention. Gallstones represent a polygenic disorder that affects more than 30,000,000 (10 %) Americans and results in more than 750,000 cholecystectomies in the USA annually. Risk factors include age, gender, race, parity, obesity, and diabetes. A family history of gallstones also has been identified as a risk factor suggesting that genetics play a role in gallstone formation. Genetic factors are responsible in at least 30 % of symptomatic gallstones. Approximately three-fourths of the patients with gallstones in the USA have stones that are composed primarily of cholesterol. The pathogenesis of cholesterol gallstones is known to be multifactorial. Approximately 35 % of patients with gallstones developed complications or recurrent symptoms leading to cholecystectomy. The sensitivity of abdominal US for cholelithiasis or gallstones is in excess of 95 %. Sensitivities of conventional CT in the setting of suspected choledocholithiasis range from 76 to 90 %. Because up to 15–25 % of patients with acute calculous cholecystitis have choledocholithiasis, MRCP may play a role in gallstone disease, particularly in patients with gallstone pancreatitis and cystic duct and gallbladder neck calculi.
MR Imaging Findings
At MR imaging, the gallbladder stones are visible as signal void within the bright fluid of the gallbladder on MRCP and heavily T2-weighted sequences. A combination of thin-slice, single-shot turbo or fast spin-echo and two-dimensional thick-slab MRCP sequences is an essential component of MR imaging protocol. On T1-weighted images, the cholesterol stone often has high signal intensity (Figs. 145.1, 145.2, and 145.3). MRCP should be performed in combination with gadolinium-enhanced imaging to demonstrate any unexpected soft tissue abnormalities such as cholecystitis or gallbladder tumors.
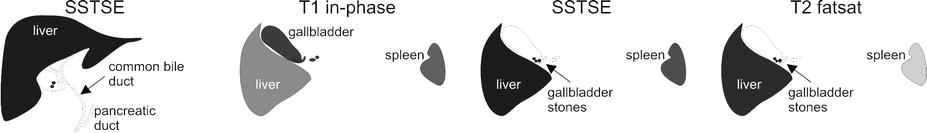
Fig. 145.1
Cholelithiasis (gallstones), drawings. SSTSE: coronal image shows two small stones in the gallbladder. Normal appearance of the common bile duct and the pancreatic duct. T1 in phase: the stones are not visible in the gallbladder. SSTSE: dark stones are present within the bright gallbladder. T2 fatsat: the stones show improved visibility due to fat suppression and higher signal-to-noise ratio
Fig. 145.2
Cholelithiasis (gallstones); two different patients, typical MRI findings. (a) Coronal SSTSE image (SSTSE) shows two small stones in the gallbladder. Note the normal appearance of the common bile duct and the pancreatic duct. (b) Axial in-phase image (T1 in phase): the stones are not visible in the gallbladder due to similar signal intensity. (c) Axial SSTSE image (SSTSE): stones are visible as signal void within the bright gallbladder. (d) Axial TSE (T2 fatsat): the stones show improved visibility due to fat suppression and higher signal-to-noise ratio. (e–h) Another patient with multiple gallstones, which are better visible on the cross-sectional SSTSE and SSTSE fatsat images than on the MRCP images due to partial volume and other issues. A 2-day slab MRCP (acquisition time: 2 s) is a direct imaging with sharper definition of the gallbladder and the biliary tree. A 3D MRCP is an MIP of the individual thin sections acquired during free breathing and respiratory triggering (acquisition time: 5–10 min!)
Fig. 145.3
Cholelithiasis, bright T1 and moving stones (two different patients), MRI findings. (a) Axial TSE image (T2 fatsat) shows small stones as a signal void. (b) Axial T1 image (T1 fatsat): parts of the small stone are bright, likely due to the presence of cholesterol. (c) Axial SSTSE image (SSTSE) shows a large stone in the fundus of the gallbladder. (d) Axial SSTSE image (SSTSE fatsat) [10 min later] shows the stone in another location with more filling of the gallbladder
Management
Apart from various nonsurgical treatments, laparoscopic cholecystectomy is currently considered as a standard surgical procedure for gallstones.
Literature
1. Cooperberg PL, Burhenne HJ. Real-time ultrasonography. Diagnostic technique of choice in calculous gallbladder disease. N Engl J Med. 1980;302:1277–9.
2. Kelekis NL, Semelka RC. MR imaging of the gallbladder. TMRI. 1996;8:312–20.
3. Park MS, Yu JS, Kim YH, et al. Acute cholecystitis: comparison of MR cholangiography and US. Radiology. 1998;209:781–5.
4. Vitellas KM, Keogan MT, Spritzer CE, et al. MR cholangiopancreatography of bile and pancreatic duct abnormalities with emphasis on the single-shot fast spin-echo technique. RadioGraphics. 2000;20:939–57.
5. Shamiyeh A, Wayant W. Current status of laparoscopic therapy of cholecystolithiasis and common bile duct stones. Dig Dis. 2005;23:119–26.
146 Choledocholithiasis (Bile Duct Stones)
Choledocholithiasis (bile duct stones) has been reported to occur in up to 15 % of patients with symptomatic gallstones. The sensitivities of ultrasound for common duct stones range from 18 to 74 %. This variable sensitivity is related in part to the operator-dependent nature of ultrasound and the obscuration of stones by bowel gas. Many centers still perform diagnostic endoscopic retrograde cholangiopancreatography (ERCP) in patients with suspected bile duct stones. Recent data shows that ERCP is associated with major complications in 4.0 % of the cases, including pancreatitis (1.3 %), cholangitis (0.87 %), hemorrhage (0.76 %), duodenal perforation (0.58 %), and others (0.51 %). Diagnostic ERCP shows major complication rate of 1.38 % and a death rate of 0.21 %, whereas therapeutic ERCP shows significantly higher rate for major complications (5.4 %) and deaths (0.49 %). Sensitivity and specificity of MRCP for choledocholithiasis exceed 90 %. Negative predictive values of MRCP are also quite high, ranging from 96 to 100 %. Thus, perhaps more important than the ability of MRCP to detect common bile duct stones is its ability to exclude stones because the absence of common bile duct stones at MRCP may result in avoidance of diagnostic ERCP along with its potential complications. Excellent performance of MRCP can result in the avoidance of ERCP in 52 and 80 % of patients with high and low risk for common bile duct stones, respectively.
MR Imaging Findings
At MR imaging, the bile duct stones are visible as signal void within the bright fluid of the bile duct on MRCP and heavily T2-weighted sequences. Two-dimensional thick-slab MRCP sequences provide an overview of the anatomy and a road map for any therapeutic procedures. The exact number and location of stones can be visualized. In addition, intrahepatic bile duct stones with or without any underlying biliary disease or pneumobilia can also be visualized noninvasively (Figs. 146.1, 146.2, and 146.3). MRCP should be performed in combination with gadolinium-enhanced imaging to demonstrate any unexpected soft tissue abnormalities such as cholangitis and tumors causing biliary obstruction.
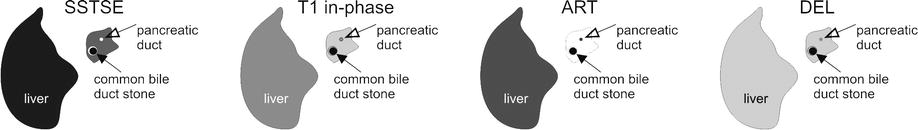
Fig. 146.1
Choledocholithiasis (bile duct stones), drawings. SSTSE: a stone appears as signal void (arrow) and almost completely fills the common bile duct; note a thin film of bright fluid surrounds the stone, T1 in phase: the stone appears larger because the surrounding fluid is also dark, ART: obviously, the stone does not show enhancement and remains dark. DEL: the stone is the darkest structure in the image
Fig. 146.2
Choledocholithiasis (bile duct stones), typical MRI findings. (a) Axial SSTSE image (SSTSE) shows a stone as a signal void (arrow) and almost completely fills the common bile duct (CBD). (b) Axial in-phase image (T1 in phase): the stone appears larger because the fluid is also dark. (c) Axial arterial phase image (ART): no enhancement is present. (d) Axial delayed phase image (DEL): the stone is the darkest structure in the image. (e) Coronal SSTSE image (SSTSE) shows in fact two large stones within the distal, slightly dilated CBD (solid arrow). Normal pancreatic duct (open arrow). (f) MRCP (thick slab of 40 mm) provides an overview of the biliary tree with the two stones in the CBD (solid arrow). Note the normal pancreatic duct (open arrow). (g, h) A detailed view of the axial SSTSE and the axial fat-suppressed SSTSE images show similar findings of the CBD stone (solid arrow) and the pancreatic duct (open arrow); note that the anatomic detail is diminished with fat suppression on SSTSE
Fig. 146.3
Choledocholithiasis – intrahepatic stones (two different patients), MRI findings. (a) Axial TSE image (T2 fatsat) shows large dilated ducts in a patient with Caroli’s disease, containing a large calculus (arrow). (b) Axial T1 in-phase image (T1 in phase) shows – in part bright – calculus (cholesterol stone). (c) Axial T1 image (T1 fatsat) [another patient] shows dilated bile ducts with pneumobilia (solid arrow) and cholelithiasis (solid arrow). (d) Coronal SSTSE image (SSTSE) shows the biliary tree with typical appearance of PSC
Literature
1. Soto JA, Barish MA, Alvarez O, et al. Detection of choledocholithiasis with MR cholangiography: comparison of three-dimensional fast spin-echo and single- and multisection half-Fourier rapid acquisition with relaxation enhancement sequences. Radiology. 2000;215:737–45.
2. Reinhold C, Taourel P, Bret PM, et al. Choledocholithiasis: evaluation of MR cholangiography for diagnosis. Radiology. 1998;209:435–42.
3. Fulcher AS, Turner MA, Capps GW, et al. Half-Fourier RARE MR cholangiopancreatography in 300 subjects. Radiology. 1998;207:21–32.
4. Loperfido S, Angelini G, Benedetti G, et al. Major early complications from diagnostic and therapeutic ERCP: a prospective multicenter study. Gastrointest Endosc. 1998;48:1–10.
5. Fulcher AS. MRCP and ERCP in the diagnosis of common bile duct stones. Gastrointest Endosc. 2002;56:S178–82.
147 Gallbladder Carcinoma I Versus Gallbladder Wall Edema
Primary carcinoma of the gallbladder is the sixth most common gastrointestinal malignancy, following cancer of the colon, pancreas, stomach, liver, and esophagus. Annually, about 7,000 new cases are diagnosed. Risk factor may include chronic Salmonella typhi infection; exposure to chemicals used in the rubber, automobile, wood finishing, and metal fabricating industries; and cholelithiasis. The symptoms at presentation are vague and are most often related to adjacent organ invasion. Therefore, despite advances in cross-sectional imaging, early-stage tumors are not often encountered. The vast majority of gallbladder carcinomas are adenocarcinomas. Because most patients present with advanced disease, the prognosis is poor, with a reported 5-year survival rate of less than 5 % in most large series. Imaging studies may reveal a mass replacing the normal gallbladder (up to 65 %), diffuse or focal thickening of the gallbladder wall (up to 30 %), or a polypoid mass within the gallbladder lumen (up to 25 %). The liver may be involved by direct contiguous spread in up to 90 % of cases, followed by the colon, duodenum, and pancreas.
MR Imaging Findings
At MR imaging, gallbladder carcinoma may be visible with irregular wall thickening as well as a mass at the level of the gallbladder fossa due to direct contiguous spread. Gallstones may be present. Concurrent liver metastases often have similar T2 appearance and enhancement pattern as the primary lesion. Wall thickening due to edema can easily be distinguished from neoplastic lesions based on morphology and enhancement pattern (Figs. 147.1, 147.2, and 147.3).
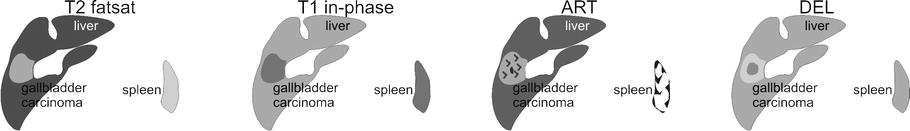
Fig. 147.1
Gallbladder carcinoma (GBC), drawings. T2 fatsat: GBC is hyperintense to the liver and represents a cranial intrahepatic extension within the gallbladder fossa. T1 in phase: GBC is hypointense to the liver. ART: GBC shows heterogeneous enhancement. DEL: GBC shows in part washout and in part persistent enhancement
Fig. 147.2
Gallbladder carcinoma (GBC), MRI findings (g and h show another patient). (a) Axial TSE image (T2 fatsat): GBC is hyperintense to the liver and represents a cranial intrahepatic extension within the gallbladder fossa. (b) Axial in-phase image (T1 in phase): GBC is hypointense to the liver. (c) Axial arterial phase image (ART): GBC shows heterogeneous enhancement. (d) Axial delayed phase image (DEL): GBC shows in part washout and in part persistent enhancement. (e) Axial TSE image at a lower anatomic level (T2 fatsat): gallbladder shows irregular wall thickening consistent with the GBC, which extends into the liver and presents as a mass shown in the previous images. (f) Axial delayed phase image (DEL): thickened gallbladder wall shows heterogeneous enhancement. (g) Axial SSTSE image (SSTSE) and (h) axial delayed phase image (DEL) from another patient show another example of gallbladder carcinoma (arrow)
Fig. 147.3
Gallbladder wall thickening (with cirrhosis, portal hypertension, and ascites). (a) Axial SSTSE image (SSTSE) shows smooth and evenly thickened gallbladder wall caused by edema (arrow). (b) Axial delayed phase image (DEL) shows thin mucosal and serosal enhancement, excluding a solid lesion (arrow). (c) Coronal SSTSE image (SSTSE) shows the cirrhotic liver with edematous gallbladder wall (arrow). (d) Coronal delayed phase image (DEL) shows clearly the two smooth and enhanced layers of the gallbladder wall (arrow)
Differential Diagnosis
Smooth gallbladder wall thickening may be caused by heart failure, cirrhosis, hepatitis, hypoalbuminemia, renal failure, and cholecystitis (xanthogranulomatous cholecystitis with irregular wall thickening mimics carcinoma). Smoothly delineated enhancement is reported to be present in chronic cholecystitis and irregular progressive enhancement in carcinomas. Transient increased pericholecystic hepatic enhancement can be seen in acute cholecystitis. Other causes of wall abnormality can be adenomyomatosis.
Literature
1. Levin B. Gallbladder carcinoma. Ann Oncol. 1999;10:129–30.
2. Yoshimitsu K, Honda H, Jimi M, et al. MR diagnosis of adenomyomatosis of the gallbladder and differentiation from gallbladder carcinoma: importance of showing Rokitansky-Aschoff sinuses. AJR Am J Roentgenol. 1999;172:1535–40.
3. Demachi H, Matsui O, Hoshiba K, et al. Dynamic MRI using a surface coil in chronic cholecystitis and gallbladder carcinoma: radiologic and histopathologic correlation. J Comput Assist Tomogr. 1997;21:643–51.
Related posts:

Stay updated, free articles. Join our Telegram channel

Full access? Get Clinical Tree


