and Michael F. Sorrell2
(1)
Herbert B. Saichek Professor of Radiology, University of Nebraska Medical Center, Omaha, NE, USA
(2)
Robert L. Grissom Professor of Medicine, University of Nebraska Medical Center, Omaha, NE, USA
22 Abscess I: Pyogenic Type with US and CT Correlation
Hepatic abscesses result from an infectious process of bacterial origin associated with destruction of the hepatic parenchyma and stroma in 0.006–2.2 % of the hospital admissions. Gram-negative bacteria of colonic origin (E. coli, Klebsiella, and Enterobacter) can often be isolated from such abscesses. Pyogenic liver abscesses may result from obstruction of the biliary tract with stasis of bile and bacterial overgrowth or as a complication of direct biliary tract infection. Hematogenous spread and bacterial seeding of the liver may occur via the portal vein secondary to abdominal infection. Other less common routes are hematogenous and direct perihepatic spread.
MR Imaging Findings
Hepatic abscess presents as a relatively complicated fluid collection, which is composed of central areas with low signal intensity on T1-weighted images and high signal intensity on T2-weighted images. Particularly, on T2-weighted images, the central cavity may show septa and debris. Central fluid-containing cavity is often surrounded by a few millimeters (most cases: 1–5 mm; some cases: >5 mm) thick inflamed liver parenchyma (wall of the abscess), which most likely contains microabscesses. Perilesional (wedge-shaped) edema may be present. Most abscesses show early persistent enhancement of the wall (Figs. 22.1, 22.2, and 22.3a, b). Although in most patients the diagnosis and follow-up are carried on CT, MR imaging is increasingly performed in the acutely ill patients; therefore, it is important for radiologists to understand the appearance of hepatic abscess at MR imaging.
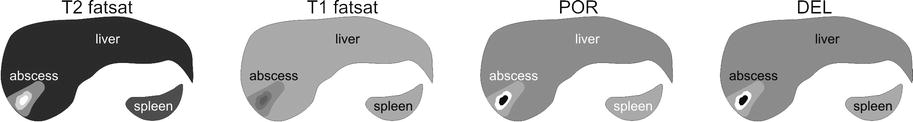
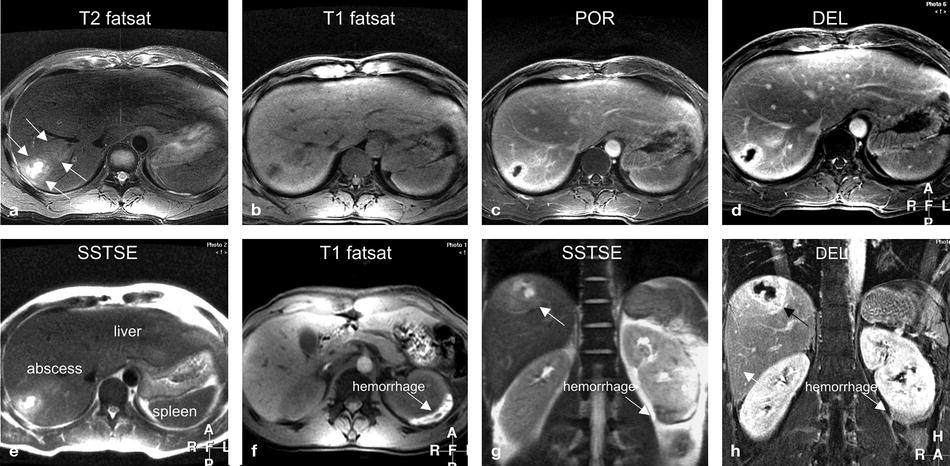
Fig. 22.1
Abscess, pyogenic type, drawings. T2 fatsat: in the right liver, a small fluid collection (high signal) is surrounded by a wedge-shaped area of edema. T1 fatsat: the fluid is slightly hypointense to the liver with faintly visible edema. POR: an evenly thick layer of liver tissue surrounding the fluid collection shows enhancement. DEL: the thick wall of the abscess remains enhanced in the delayed phase
Fig. 22.2
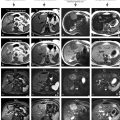
Abscess, pyogenic type, MR imaging findings at 3.0 T. (a) Axial fat-suppressed T2-weighted turbo spin-echo (TSE) image (T2 fatsat): in the right liver, a small fluid collection is surrounded by a wedge-shaped area of edema (arrows). (b) Axial fat-suppressed T1-weighted gradient echo (GRE) (T1 fatsat): the fluid collection is hypointense to the liver with faintly visible edema. (c) Axial portal phase gadolinium (Gd)-enhanced three-dimensional (3D) T1-weighted GRE image (POR): the fluid collection has a thick wall. (d) Axial delayed phase GRE image (DEL): the wall of the abscess shows persistent enhancement (no washout). (e) Axial T2-weighted single-shot TSE image (SSTSE): the central part of the abscess contains fluid due to necrosis. (f) Axial fat-suppressed GRE image through the kidneys (T1 fatsat): perinephric hemorrhage (an incidental finding) shows high signal (arrow). (g) Coronal SSTSE image (SSTSE): the abscess is subcapsular to the liver (arrow). (h) Coronal delayed phase image (DEL): the wall of the abscess has a ragged appearance (arrow)
Fig. 22.3
Abscess anatomy. (a) A detailed view of the coronal high-resolution delayed phase image (from the patient above) shows small cavities within the wall of the abscess. (b) Drawing of the abscess: the central cavity is filled with fluid that is surrounded by a wall of inflammation with (most likely) microabscesses and edema. (c) Ultrasound (another patient) shows a typical echinococcal cyst with daughter cysts (arrow). (d) CT in portal phase confirms the US findings
Differential Diagnosis
In ambiguous cases, the differential diagnosis may include (1) metastases (the ring enhancement progresses in a centripetal fashion with decrease in intensity on delayed images), (2) infected metastases (difficult to differentiate, thicker and more irregular wall, clinical history important), (3) hepatosplenic candidiasis (multiple lesions <10 mm in diameter), (4) hydatid cysts (internal septa), and (5) echinococcus abscesses (thicker septa and daughter cysts) (Fig. 22.3c, d).
Management
Management options include: (1) percutaneous drainage, (2) open surgical drainage, and (3) antibiotic therapy. Single dominant hepatic abscess with a large fluid cavity can be treated with percutaneous drainage. Treatment should be tailored to each patient.
Literature
1. Mendez RJ, Schiebler ML, Outwater EK, Kressel HY. Hepatic abscesses: MR imaging findings. Radiology. 1994;190:431–6.
2. Balci CN, Semelka RC, Noone TC, et al. Pyogenic hepatic abscesses: MRI findings on T1- and T2-weighted and serial gadolinium-enhanced gradient-echo images. J Magn Reson Imaging. 1999;9:285–90.
3. Perez JAA, Gonzalez JJ, Baldonedo RF, et al. Clinical course, treatment, and multivariate analysis of risk factors for pyogenic liver abscess. Am J Surg. 2001;181:177–86.
23 Abscess II: Pyogenic Type with DWI and MinIP Patterns
Three major forms of abscesses can occur in the liver: (1) pyogenic abscess, which is most often polymicrobial (80 %, USA); (2) amebic abscess due to Entamoeba histolytica (10 %); and (3) fungal abscess, most often due to Candida species (<10 %). The majority of liver abscesses originate via the biliary tract (about 60 %) or portal vein (about 20 %); other etiologies, including cryptogenic, hematogenous, direct extension, and post-traumatic, are less common. Mortality can occur in 5–30 %, mainly from sepsis and multiorgan failure. The clinical and lab abnormalities include (spiking) fever, right upper quadrant pain, neutrophilic leukocytosis, and hypoalbuminemia with elevated alkaline phosphatase. Blood culture is positive in only 50 %; imaging plays an important role in diagnosis and monitoring of treatment.
MR Imaging Findings
On the T2-weighted images, hepatic abscess is visible as a focal lesion with an overall moderately high signal intensity; close look at the lesion, however, reveals a fairly characteristic appearance with high signal of the central cavity, surrounded by an intermediate signal infected but non-necrotic liver tissue, and finally a thick rim of compressed (almost normal or minimally inflamed) liver parenchyma, which will be nearly isointense with the background liver (Fig. 23.1a). On the T1-weighted images, hepatic abscess, like many liver lesions, has a nonspecific low-signal-intensity appearance. In many ways, the T1 appearance of the liver lesions is comparable to the CT appearance with lack of internal tumor anatomy (Fig. 23.1b). On the arterial phase images, hepatic abscess shows a faint enhancement of the thick rim immediately around the central necrotic cavity as well as a slightly more intense enhancement of the thicker compressed liver tissue around the abscess (Fig. 23.1c). On the delayed (4–5 min postinjection) phase images, hepatic abscess has a more distinct non-enhancing central cavity compared to the more homogenously enhancing surrounding infected but viable and normal liver tissue (Fig. 23.1d). On the diffusion-weighted (DWI) and apparent diffusion coefficient (ADC) images, the central cavity containing complex fluid and debris will show restricted diffusion (bright on DWI and dark on ADC). This is similar to many (benign and malignant) solid liver lesions (Fig. 23.2e–g). In the clinical setting, we rely more on the T2 and post-contrast findings rather than DWI and ADC (Fig. 23.2a–c). The contrast-enhanced CT images show findings similar to contrast-enhanced part of MRI (Fig. 23.2e).
Fig. 23.1
Abscess: typical MR imaging findings with DWI, ADC, and CT correlation. (a) Axial SSTSE image (SSTSE) shows a large hyperintense lesion in the right liver (arrow). (b) Axial T1-weighted GRE (T1 in phase): the lesion is ill-defined and with low signal intensity (arrow). (c) Axial arterial phase 3D T1-weighted GRE image (ART) shows a thick rim of enhancement in the surrounding liver parenchyma (arrows) and little enhancement of the actual lesion. (d) Axial delayed phase GRE image (DEL), some persistent parenchymal enhancement (arrows), and more enhancement in the rim of actual lesion. Note that the central necrotic part of the lesion remains enhanced. (e) Axial baseline diffusion-weighted image (DWI b = 0) shows the hyperintense lesion with a rim of increased signal around the lesion (arrows). (f–g) Axial diffusion-weighted image (DWI b = 500) and the ADC map show significant restricted diffusion in the central part of the lesion (arrow). (h) Axial minimum-intensity projection (MinIP) shows the central unenhanced necrotic part and the surrounding enhanced rim of viable tissue (arrow)
Fig. 23.2
Abscess: typical MR imaging findings with CT and MinIP correlation. (a) Axial magnified SSTSE image (SSTSE) shows mildly compressed liver parenchyma around the abscess (arrows). (b, c) Maximum-intensity projection (MIP) images show enhancement of the compressed liver parenchyma (arrows). The finding is typical for abscesses (unlikely to be present around metastasis). (d) Coronal minimum-intensity projection (MinIP) shows the necrotic central dark cavity of the abscess. (e) Axial CT (CT) shows the enhanced compressed liver around the abscess. (f, g) Axial and coronal MinIP images from another patient show branching biliary abscesses. (h) Coronal MinIP image from yet another patient shows numerous “microabscesses” in an immune-compromised patient. MinIP images can help demonstrate branching abscesses, typical pattern for biliary spread of infection
Over the years, we have observed three imaging patterns of liver abscesses: (1) a single lesion with a necrotic cavity, (2) multiple small microabscesses, and (3) a branching biliary abscess. Minimum-intensity projections (MinIPs) based on the post-contrast delayed phase images particularly facilitate the recognition of the branching biliary abscess (Fig. 23.2d, f–h).
Differential Diagnosis
In order to distinguish liver abscesses from liver masses, the clinical correlation and the imaging findings are important. Rapidly changing or sudden new lesions should trigger the diagnostic possibility of an abscess. It remains however a challenge for radiologists and clinicians to correctly diagnose a liver abscess and avoid dreadful situations such as placing a drainage catheter in a necrotic malignant liver mass.
Management
Management options include: (1) percutaneous drainage, (2) open surgical drainage, and (3) antibiotic therapy. Single dominant hepatic abscess with a large fluid cavity can be treated with percutaneous drainage. Treatment should be tailored to each patient.
Literature
1. Mortele KJ, Segatto E, Ros PR. The infected liver: radiologic-pathologic correlation. Radiographics. 2004;24:937–55.
2. Land MA, Moinuden M, Biano AL. Pyogenic liver abscess: changing epidemiology and prognosis. South Med J. 1985;78:1426–30.
3. Chan JH, Luk SH, Fung AS, et al. Diffusion-weighted MR imaging of the liver: distinguishing hepatic abscess from cystic or necrotic tumor. Abdom Imaging. 2001;26:161–5.
24 Biliary Hamartomas (Von Meyenburg Complexes)
Biliary hamartomas are benign biliary malformations, which are currently considered as part of the spectrum of fibropolycystic diseases of the liver due to ductal plate malformation. This entity is common and estimated to be present in approximately 3 % of patients. These lesions are often discovered as incidental findings during cross-sectional imaging or during palpation of the surface of the liver during laparotomy, usually in the setting of colorectal malignancy. Biliary hamartomas may be solitary or multiple, and multiple tumors can be extensive.
MR Imaging
On MR images, tumors are small (usually <1 cm), often multiple, and well defined. The high fluid content renders these lesions low signal on T1, high signal on T2, and negligible enhancement on early and late post-gadolinium images. Although this appearance resembles simple cysts, biliary hamartomas demonstrate a thin rim of enhancement on early and late post-contrast images (Figs. 24.1 and 24.2).
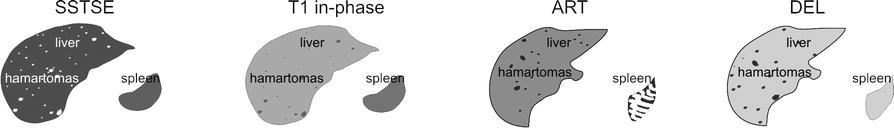
Fig. 24.1
Biliary hamartomas, drawings. SSTSE: hamartomas appear as multiple bright (cyst-like) lesions within a darker liver. T1 in phase: hamartomas are predominantly hypointense compared to the liver. ART: hamartomas often show a faint rim of enhancement, DEL: hamartomas remain unenhanced like cysts in the liver but may have some residual rim of enhancement
Fig. 24.2
Biliary hamartomas, multiple, typical MRI findings. (a) Axial SSTSE image (SSTSE): biliary hamartomas are hyperintense (cyst-like) to the liver. (b) Axial in-phase image (T1 in phase): biliary hamartomas are hypointense and less obvious than on the T2-weighted images. (c) Axial arterial phase image (ART): biliary hamartomas show a faint rim of enhancement. (d) Axial delayed phase image (DEL): biliary hamartomas remain unenhanced like cysts in the liver but may have a faint persistent rim of enhancement. (e) Coronal SSTSE image (SSTSE): biliary hamartomas are very bright and scattered throughout the liver, including the subcapsular region. (f) Axial opposed-phase image (T1 opposed phase): no fatty infiltration is present. (g) Detailed view of axial fat-suppressed T2-weighted TSE image (T2 fatsat): biliary hamartomas may be difficult to distinguish from surrounding vessels. (h) Detailed view of axial delayed phase image (DEL): biliary hamartomas are predominantly non-enhancing lesions with a faint persistent rim of enhancement
Differential Diagnosis
The major potential diagnostic error is to misclassify these lesions as metastases due to the presence of ring enhancement. The thin enhancing rim of biliary hamartomas, visualized on imaging, may be correlated histopathologically with the presence of compressed hepatic parenchyma bordering the lesion. In contrast, the pattern of ring enhancement displayed by metastases relates histopathologically with the outer most vascularized portion of the tumor. Peritumoral enhancement is also observed in some metastases. MR imaging further corroborates the different histologic profiles of the two processes through the observation that enhancement in biliary hamartoma does not progress centrally, while enhancement in metastases most often progresses centrally.
Pathology
Histopathologically, biliary hamartomas consist of a collection of small, sometimes dilated, irregular, and branching bile ducts embedded in a fibrous stroma. A few of the ducts may contain inspissated bile. In general, biliary hamartomas contain no or few vascular channels (Fig. 24.3).
Fig. 24.3
Biliary hamartoma, histopathology, and drawings. (a) Photomicrograph (H&E 100×) shows a biliary hamartoma that consists of a group of several small cysts filled with bile. Note the normal liver that surrounds the hamartoma. (b) Photomicrograph (H&E stain, 200×) shows in detail the cystic components of the hamartoma filled with bile , which explains the high signal on T2-weighted images. (c) The drawing shows the collapsed biliary hamartoma in vitro. (d) The drawing shows the distended biliary hamartoma in vivo
Management
No treatment or follow-up with imaging is required for typical biliary hamartomas.
Literature
1. Semelka RC, Hussain SM, Marcos HB, Woosley JT. Biliary hamartomas: solitary and multiple lesions shown on current MR techniques including gadolinium enhancement. J Magn Reson Imaging. 1999;10:196–201.
2. Semelka RC, Hussain SM, Marcos HB, Woosley JT. Perilesional enhancement of hepatic metastases: correlation between MR imaging and histopathologic findings- initial observations. Radiology. 2000;215:89–94.
3. McLoughlin MJ, Phillips MJ. Angiographic findings in multiple bile-duct hamartomas of the liver. Radiology. 1975;116:41–3.
25 Cyst I: Typical Small
Hepatic cysts are common lesions (may occur in up to 20 % of the general population). These lesions are usually divided into unilocular (95 %) or multilocular varieties. Although the pathogenesis of these cysts is not clear, most hepatic cysts are considered to be developmental in origin. Currently, most hepatic cysts are discovered as incidental findings at cross-sectional imaging. Smaller cysts (<10 mm) at US and CT may be difficult to distinguish from solid lesions and may cause diagnostic problem especially in patients with an underlying (colorectal) malignancy.
MR Imaging
At MR imaging, cysts are low in signal intensity on T1-weighted images, high in signal intensity on T2-weighted images, and retain signal intensity on longer echo time (e.g., >120 ms) T2-weighted images. After injection of contrast, cysts do not show any enhancement. On delayed post-gadolinium images (up to 5 min), cysts remain unenhanced. The latter findings may be useful to ensure that lesions are cysts and not poorly vascularized metastases that show gradual enhancement. T2-weighted sequences with long TE in combination with delayed phase images are especially effective at showing small (≤5 mm) cysts. MRI is particularly valuable when lesions are small and the patient has a known primary malignancy (Figs. 25.1 and 25.2). Typical and relatively larger cysts can be characterized at CT as well as US (Figs. 25.3a, b).
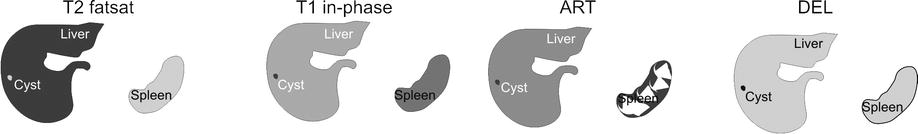
Fig. 25.1
Cyst, drawings. T2 fatsat: cyst is very bright (fluidlike) compared to the liver with smooth and sharp margins. T1 in phase: cyst is hypointense to the liver, ART: cyst shows no enhancement, DEL: cyst remains unenhanced
Fig. 25.2
Cyst, typical MRI findings. (a) Axial fat-suppressed T2-weighted TSE image (T2 fatsat) shows a small sharply marginated bright cyst. b) Axial in-phase image (T1 in phase): the cyst has low signal intensity. (c) Axial gadolinium-enhanced 3D GRE image in the arterial phase (ART): the cyst shows no enhancement. (d) Axial delayed phase (DEL): the cyst remains unenhanced. (e) Axial T2-weighted SSTSE image with longer TE of 120 ms (SSTSE): the cyst (arrow) retains its high signal intensity due to high fluid content (typical sign of nonsolid liver lesions). (f) Axial opposed-phase image (T1 opposed phase): the cyst (arrow) has low signal intensity. (g) Coronal SSTSE image (SSTSE): the bright cyst is well recognizable (arrow). (h) Coronal delayed phase image (DEL): the cyst is clearly visible as a small non-enhancing lesion with excellent correlation and confirmation of the T2 information (arrow). The ability of MRI to combine the information on various T1, T2, and gadolinium-enhanced sequences is unparalleled and allows highly confident and reliable diagnosis for sound medical and surgical decision making
Fig. 25.3
Cyst, CT, US, and histology. (a) CT (a different patient) shows a small unenhanced cyst. (b) Ultrasound (a different patient) shows a typical cyst with sharp margins and increased sound transmission (arrow). (c) Photomicrograph (H&E, 100×) shows a typical cyst that is surrounded by the liver tissue with inflammatory infiltrates. (d) A detailed view of the previous photomicrograph shows more closely the epithelial lining (arrow)
Differential Diagnosis
Typical simple cyst at MR imaging does not cause any diagnostic problems and can be distinguished from other cystic lesions with confidence. Atypical cysts or cysts with septa may show overlapping features with other entities such as (1) mucinous or cystic metastases (look for multiple septa and perilesional enhancement) and (2) ciliated foregut cysts (congenital lesions, frequently located at the anterior margin of the liver with mucinous content and slightly bulging the liver contour). The presence of a cystic lesion with an enhancing wall and extension beyond the contour of the liver may also be observed in some forms of metastatic disease such as hepatic metastasis from ovarian malignancies. For this reason, a diagnosis of foregut cyst on imaging studies should only be made in the absence of peritoneal disease and a clinical history of malignancy.
Pathology
Pathologically, the lining of the cyst shows a single layer of cuboidal to columnar epithelial cells. Lining epithelium rests on an underlying fibrous stroma (Figs. 25.3c, d).
Management
No treatment or follow-up with imaging is required for typical small hepatic cysts.
Literature
1. Rossai J. Ackerman’s surgical pathology, vol. 1. 8th ed. St Louis: Mosby; 1995. p. 898.
2. Mortele KJ, Ros PR. Cystic focal liver lesions in the adult: differential CT and MR imaging features. Radiographics. 2001;21:895–910.
3. Shoenut JP, Semelka RC, Levi C, Greenberg H. Ciliated hepatic foregut cysts: US, CT, and contrast-enhanced MR imaging. Abdom Imaging. 1994;19:150–2.
26 Cyst II: Typical Large with MR-CT Correlation
Large hepatic cysts are less common than the smaller or multiple cystic lesions in the liver. Such lesions may be detected incidentally, but patients are more likely to present with symptoms such as upper abdominal discomfort, pain, or even obstructive jaundice due to the biliary compression by the cyst. Intracystic hemorrhage may also occur and cause symptoms.
MR Imaging
Very large liver cysts have similar MR imaging appearance as smaller cysts. Cysts are low in signal intensity on T1-weighted images, high in signal intensity on T2-weighted images, and retain signal intensity on longer echo time (e.g., >120 ms) T2-weighted images. Cysts, as nonsolid liver lesions, share this T2 characteristic with hemangiomas in the liver. Because cysts do not enhance with gadolinium on MR images, delayed post-gadolinium images (up to 5 min) may be useful to ensure that lesions are simple cysts without any solid nodules or thickened septa. In addition, MR imaging can reliably exclude hemorrhage on T1-weighted GRE with fat suppression as well as any biliary dilatation (Figs. 26.1 and 26.2). CT is also well able to visualize these lesions (Fig. 26.3). CT may be less accurate for small amount of hemorrhage or solid components.
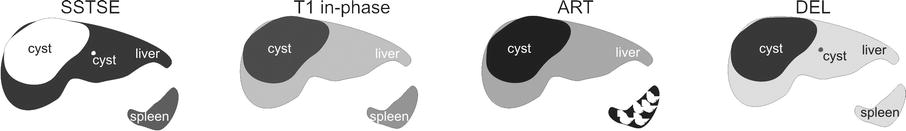
Fig. 26.1
Cysts, drawings. SSTSE: a large cyst with smaller cyst is much brighter with sharp demarcation to the liver. T1 in phase: the large cyst is hypointense to the liver. The smaller cysts are less well visible, ART: the large cyst shows no enhancement in the arterial phase after contrast, DEL: the large cyst shows no enhancement in the delayed phase after contrast. The smaller cyst is also visible
Fig. 26.2
Cysts, large and small. (a) Axial T2-weighted SSTSE image (SSTSE) shows a very large and a smaller cysts with sharp margins and high signal to the liver. (b) Axial in-phase image (T1 in phase): cysts are hypointense to the liver. (c) Axial arterial phase GRE image (ART): cysts show no enhancement. (d) Axial delayed phase image (DEL): cysts remain unenhanced. (e) Axial fat-suppressed TSE image (T2 fatsat): bright signal of the larger cyst causes ghost on this respiratory-triggered image. (f) Axial fat-suppressed GRE image (T1 fatsat): cysts show signal that is comparable to fluid (simple cysts). Note the perilesional liver tissue with a rim of higher signal due to compression. (g) Coronal SSTSE image (SSTSE): larger cyst is in subphrenic location with the smaller cyst adjacent to it (arrow). (h) Coronal delayed phase post-Gd 2D T1-weighted GRE image (DEL): the larger cyst shows a thin wall (arrow)
Fig. 26.3
Cyst, large, CT findings (another patient). (a) Scout view shows the space-occupying effect of the large hepatic cyst with displacement of the bowel loops (arrows). (b) Unenhanced CT of a large cyst in the right liver with thin wall (arrow). (c) CT in the arterial phase shows no enhancement of the cyst with the thin wall (arrow). (d) CT in the portal phase shows no enhancement of any other structures within the cyst with the thin wall (arrow)
Differential Diagnosis
Differential diagnosis of a large cystic liver lesion includes (1) infectious cystic lesions, such as abscess (clinical history and enhancing wall at imaging) and intrahepatic hydatid cyst (clinical history and daughter cysts in 75 % at MRI and CT and calcifications in 50 % at CT), and (2) neoplastic lesions, such as undifferentiated embryonal sarcoma, biliary cystadenoma or cystadenocarcinoma, and cystic metastases. Hallmarks of neoplastic lesions are solid components with intralesional or perilesional enhancement. Such findings should not be present in large simple developmental liver cysts.
Management
Several types of treatments have been advocated for large (symptomatic) hepatic cysts, including (1) percutaneous drainage and sclerosis using alcohol, tetracycline, doxycycline, or a combination (this method is associated with recurrence of cysts and symptoms); (2) drainage in combination with various types of surgery; and (3) drainage in combination with minocycline injection (more recent type of treatment). Percutaneous treatments may be contraindicated in patients with bleeding tendency, echinococcal cysts, and cysts communicating with biliary tree.
Literature
1. VanSonnenberg E, et al. Symptomatic hepatic cyst: percutaneous drainage and sclerosis. Radiology. 1994;190:387–92.
2. Cellier C, Cuenod CA, Deslandes P, et al. Symptomatic hepatic cysts: treatment with single-shot injection of minocycline hydrochloride. Radiology. 1998;206:205–9.
3. Regev A, Reddy KR, Bercho M, et al. Large cystic lesions of the liver in adults: a 15-year experience in a tertiary center. J Am Coll Surg. 2001;193:36–45.
27 Cyst III: Multiple Small Lesions with MR-CT-US Comparison
Recent studies suggest that small (<15 mm) liver lesions seen at computed tomography (CT) are benign in more than 80 % of patients with known malignancy. With the application of multi-row detector CT and thinner collimation, it is likely that more liver lesions will be detected that will need additional imaging for characterization, most likely with MR imaging. It is particularly important to distinguish benign from metastatic and primary malignant lesions.
MR Imaging Versus Computed Tomography and Ultrasound
The appearance and the ability to characterize small hepatic cysts differ considerably on MR imaging, CT, and US (Figs. 27.1, 27.2, and 27.3). At MR imaging, hepatic cysts can be characterized based on a unique combination of findings including very bright signal on T2-weighted sequences with sharp margins and the absence of enhancement on all phases of dynamic gadolinium-enhanced as well as on delayed phase images. Due to large intrinsic tissue differences between the background liver (dark) and cysts (very bright), even very small cysts of only a few millimeters in diameter can be detected and characterized on images with much larger slice thickness. CT and ultrasound lack these properties, and hence the characterization of small hepatic lesions (mainly distinction between solid and nonsolid lesions) may be difficult. Detection and characterization on CT are mainly based on two parameters: (1) differences in X-ray attenuation and (2) differences in enhancement. On contrast-enhanced CT images, cysts appear grayish compared to the enhanced liver. On contrast-enhanced MR images, cysts appear almost as signal voids (very dark) compared to the enhanced liver. This suggests that MRI is much sensitive to gadolinium than CT is for iodine contrast media. At US, cysts appear very dark with sharp margins and increased sound transmission through the lesion. Although with the application of real-time image optimization possibilities such as beam steering, increased sound transmission may not be obvious. In addition, in many centers, it is a common practice to have a confirmation of US findings at CT or MRI, especially in patients with an underlying malignancy.
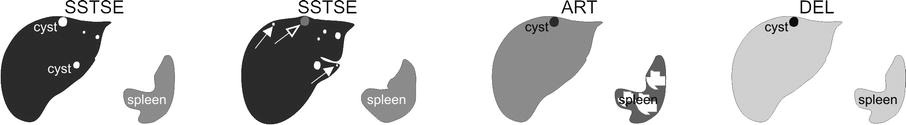
Fig. 27.1
Cysts, drawings. SSTSE: cysts are very bright with sharp demarcations. SSTSE: at a slightly higher anatomic level, a number of smaller subcapsular cysts (solid arrows) can be seen due to high intrinsic tissue contrast. One of the larger cysts shows lower signal due to partial volume (open arrow). ART: smaller cysts are not visible. One of the larger cysts shows no enhancement, DEL: the larger cyst remains unenhanced
Fig. 27.2
Cysts, multiple liver and renal cysts, MRI and CT findings. (a) Axial T2-weighted SSTSE image (SSTSE): two larger (arrows) and several smaller cysts are visible with high signal and sharp demarcation. (b) Axial SSTSE image (SSTSE): at a slightly higher anatomic level, a number of smaller subcapsular cysts (solid arrows) can be seen due to high intrinsic tissue contrast. One of the larger cysts shows lower signal due to partial volume (open arrow). (c) Axial arterial phase image (ART): one of the larger cysts shows no enhancement. (d) Axial delayed phase image (DEL): the cyst remains unenhanced. (e) CT in the portal phase (CT): the larger subcapsular cyst is visible with sharp margins, whereas the other cyst (arrow) is not well visible due to partial volume. (f) CT in the portal phase at a higher level (CT): several smaller hypodense lesions are visible (“too small to be characterized”). (g) Axial delayed phase image (DEL): the cyst with the partial volume on CT is well visible with sharp demarcation (arrow). (h) Coronal SSTSE image (SSTSE): note that multiple hepatic as well as bilateral renal cysts are also present
Fig. 27.3
Cyst, US, CT, and MRI findings. (a) Ultrasound (US) shows a typical hepatic cyst with sharp margins and increased sound transmission through the lesion (arrows) indicating its nonsolid nature. (b) Computed tomography after contrast in the portal phase (CT) shows an unenhanced cyst with sharp margins. (c) A strongly T2-weighted SSTSE image (MR-T2) shows the cyst as a very bright lesion. (d) T1 weighted after contrast in the delayed phase GRE image (MR-DEL) shows the unenhanced cyst. Note that the cyst appears much darker to the liver than on the CT image
Differential Diagnosis
At MR imaging, typical cysts will have no differential diagnosis. At US and CT, smaller lesions may have differential diagnosis with solid liver lesions, such as metastases.
Management
MR imaging often plays a decisive role in the management of patients with small hepatic cysts, particularly with an underlying malignancy.
Literature
1. Schwartz LH, Gandras EJ, Colangelo SM, et al. Prevalence and importance of small hepatic lesions found at CT in patients with cancer. Radiology. 1999;210:71–4.
2. Haider MA, Amital MM, Rappaport DC, et al. Multi-detector row helical CT in preoperative assessment of small (≤1.5 cm) liver metastases: is thinner collimation better? Radiology. 2002;225:137–42.
3. Hussain SM, Semelka RC. Hepatic imaging: comparison of modalities. Radiol Clin North Am. 2005;43:929–47.
28 Cyst IV: Adult Polycystic Liver and Kidney Disease
One of the most common extrarenal manifestations of adult polycystic kidney disease (APKD) is hepatic cysts, which occur with increasing frequency with advanced age and loss of renal function. Some refer to this condition as adult polycystic liver disease (APLD), which occurs in 34–88 % of patients with APKD. Few patients with APLD do not have associated renal cysts. Hepatic cysts usually remain asymptomatic. Some of them develop complications including (1) cyst infection or hemorrhage, (2) biliary obstruction, and (3) portal hypertension. With improved management of the end-stage renal disease, hemodialysis, and renal transplantation, patients with APKD will have increased life expectancy. As a result, complications associated with hepatic cysts may become more common.
MR Imaging Versus Computed Tomography and Ultrasound
At MR imaging, multiple hepatic cysts can be characterized based on a unique combination of findings including low signal intensity on T1-weighted sequences, very bright signal on T2-weighted sequences with sharp margins, and the absence of enhancement on all phases of dynamic gadolinium-enhanced as well as on delayed phase images. Cysts complicated with hemorrhage contain fluid-fluid levels or diffuse high signal intensity on (fat-suppressed) T1-weighted sequences. Hemorrhage is particularly present in renal cysts (Figs. 28.1 and 28.2). CT can also visualize liver and renal cysts, but hemorrhagic cysts may be difficult to detect on CT exams (Fig. 28.3). MR imaging is also preferred to CT in this patient group with renal dysfunction. Infected cysts will have imaging feature of a pyogenic liver abscess with intraluminal debris and enhancing wall.
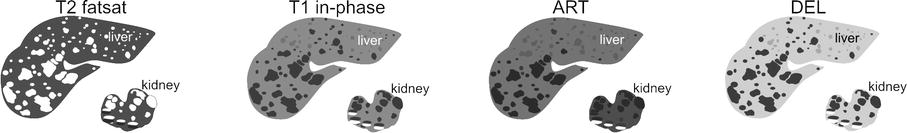
Fig. 28.1
Cysts, drawings. T2 fatsat: cysts are much brighter with sharp demarcation to the liver. Note also renal cysts. T1 in phase: cysts are hypointense to the liver. Some of the renal cysts have in part high signal due to hemorrhage (fluid-fluid levels). Note that these parts of the cysts are darker on T2 fatsat. ART: cysts show no enhancement. DEL: cysts remain unenhanced
Fig. 28.2


Cysts, multiple, simple liver, and complicated renal. (a) Axial fat-suppressed T2-weighted TSE image (T2 fatsat): multiple simple liver and renal cysts are much brighter than the surrounding liver with sharp demarcation. The complicated renal cysts with hemorrhage have darker parts. (b) Axial in-phase T1-weighted GRE (T1 in phase): hepatic cysts are hypointense to the liver. Note that parts of the complicated renal cysts are bright due to hemorrhage (fluid-fluid levels). (c) Axial arterial phase GRE image (ART): the cysts show no enhancement. (d) Axial delayed phase GRE image (DEL): the cysts remain unenhanced. (e) Coronal T2-weighted SSTSE image (T2 coronal): the hepatic and renal cysts are visible (arrow). (f) Axial opposed-phase GRE image (T1 opposed-phase) contains less artifacts than the in-phase image. The renal cysts with hemorrhage are well visible (arrow). (g) Axial portal phase GRE image (DEL): the cysts show no enhancement (arrow). (h) A detailed view from the axial delayed phase post-Gd 2D T1-weighted GRE image (DEL): the cysts remain unenhanced with sharp demarcation to the surrounding liver (arrow)
Related posts:

Stay updated, free articles. Join our Telegram channel
Full access? Get Clinical Tree
