and Michael F. Sorrell2
(1)
Herbert B. Saichek Professor of Radiology, University of Nebraska Medical Center, Omaha, NE, USA
(2)
Robert L. Grissom Professor of Medicine, University of Nebraska Medical Center, Omaha, NE, USA
1 Liver MRI: Comparison of the Two Main Approaches
Multiparametric Approach Versus Liver-Specific MRI Contrast Medium Approach
The multiparametric approach is basically a product of research and development since the introduction of MRI in 1973. The liver-specific contrast medium (gadoxetate) approach has mainly been popularized by the vendor, since the approval of gadoxetate in the USA in 2008 (Fig. 1.1). The multiparametric approach relies on a combination of multiple sequences, including the multiphasic dynamic contrast-enhanced sequence that allows the detection as well as characterization of liver lesions. In this approach, the enhancement patterns of the liver lesions, combined with the T2, T1, and DWI appearance, are important. To accurately assess the enhancement patterns of liver lesions, a well-timed arterial phase is essential. In the gadoxetate approach, the 20 min delayed hepatobiliary phase (HBP) plays the central role; most of the other sequences are often used to explain the findings on the HBP. The time between the injection of contrast and the 20 min HBP is often filled with the early dynamic phases (<5 min) and a number of other (often) redundant set of images (5 min HBP, 10 min HBP, and 15 min HBP) and/or T2-weighted sequences. The multiparametric approach can be applied to the liver as well as other organs. The gadoxetate approach is mainly applied to assess suspected or known primary liver lesions (focal nodular hyperplasia, hepatocellular adenomas, hepatocellular carcinomas) and bile leak. Gadobenate is a gadolinium-based contrast agent, which actually has a dual, a nonspecific, and a liver-specific function and allows HBP between 1 and 3 h after injection.
Fig. 1.1
Two different liver MRI approaches currently applied for liver MR imaging. (a) Multiparametric approach relies on the non-liver-specific MRI contrast media (e.g., gadobenate (MultiHance), gadobutrol (Gadavist), gadoterate (Dotarem)) and a combination of multiple sequences including T2-weighted, diffusion-weighted, chemical shift, and multiphasic dynamic contrast-enhanced sequences. This approach emphasizes the appearance of liver abnormalities on these sequences, particularly their tissue characteristics (expressed on the T2, diffusion, and chemical shift) as well as their vascularity (expressed on the dynamic contrast-enhanced sequences including a well-timed arterial phase). In the case of MultiHance, there is an option to acquire 1–2 h delayed hepatobiliary phase (HBP). (b) Liver-specific MRI contrast medium approach relies on the liver-specific contrast medium only (i.e., gadoxetate (Eovist/Primovist)). In this approach, the main focus is to acquire the 20 min HBP. Other sequences, including the dynamic multiphasic contrast-enhanced sequences and diffusion, are ancillary to the findings of the HBP
T2-weighted sequence: An important breakthrough for multiparametric approach came with the introduction of RARE (rapid acquisition with relaxation enhancement) by Jürgen Hennig in 1986, which was later modified as hybrid RARE by Don Mitchell and Eric Outwater. Scan time was significantly reduced to only a few minutes by acquiring more k-space lines per repetition time (TR). The RARE sequence also formed the basis for the much faster half-Fourier acquisition single-shot turbo spin-echo (HASTE) sequence; this sequence (aka single-shot turbo spin echo or fast spin echo) allows breath-hold imaging to cover the entire liver; the scan time per slice is in the order of a second; the entire liver can easily be covered in 15–20 s breath-hold with superb image quality.
T1-weighted sequence: Another important breakthrough for multiparametric approach came with the introduction of fast low-angle shot (FLASH) imaging in 1986, which is a gradient-echo sequence that allowed T1-weighted imaging in seconds, facilitating breath-hold MR imaging of the liver for the first time. The dynamic gadolinium-enhanced MR imaging, first described by Richard Semelka in the 1990s using FLASH, continues to be the single most important component of the modern liver MRI. FLASH sequence permitted the acquisition of the central part of the k-space data in only a few seconds, simultaneously for all slices covering the liver with the consistent T1 contrast, and allowed the assessment of the enhancement of the liver lesions. This was in the time, when CT was slow and did not allow dynamic imaging. This technical advantage of MRI, combined with the lack of ionizing radiation and a relatively safer MR contrast medium (gadopentetate) compared to hyperosmolar CT contrast media of that time, facilitated the implementation of routine multiphasic dynamic MRI. Currently, the dynamic imaging based on the fat-suppressed 3D T1-weighted sequences (VIBE/eTHRIVE/LAVA/Dixon), with high spatial resolution, maintains its central role in liver MRI. The gradient-echo T1-weighted sequence was also modified for chemical shift imaging and Dixon for fat detection and quantification.
Literature
1. Lauterbur PC. Image formation by induced local interactions: examples employing nuclear magnetic resonance. Nature. 1973;242:190–1.
2. Hennig J, Nauerth A, Friedburg H. RARE imaging: a fast imaging method for clinical MR. Magn Reson Med. 1986;3:823–33.
3. Mitchell DG, Outwater EK, Vinitski S. Hybrid RARE: implementations for abdominal MR imaging. JMRI. 1994;4:109–17.
4. McFarland EG, Mayo-Smith WW, Saini S, Hahn PF, et al. Hepatic hemangiomas and malignant tumors: improved differentiation with heavily T2-weighted conventional spin-echo MR imaging. Radiology. 1994;193:43–7.
5. Frahm J, Haase A, Matthaei D. Rapid NMR imaging of dynamic processes using the FLASH technique. Magn Reson Med. 1986;3:321–7.
6. Semelka RC, Simm FC, Recht M, et al. T1-weighted sequences for MR imaging of the liver: comparison of three techniques for single-breath, whole-volume acquisition at 1.0 and 1.5 T. Radiology. 1991;180:629–35.
7. Mitchell DG, Kim I, Chang TS, et al. Fatty liver. Chemical shift phase-difference and suppression magnetic resonance imaging techniques in animals, phantoms, and humans. Invest Radiol. 1991;26:1041–52.
2 Gadolinium-Based Contrast Agents: An Overview
Currently available gadolinium-based contrast agents (GBCAs) differ considerably in their chemical structure, biodistribution, and most importantly their safety profile. The chemical structure of the GBCAs greatly determines their safety profile. In general, the ionic GBCAs (unlike CT contrast media) are considered safer than the nonionic GBCAs; the macrocyclic GBCAs are safer than the open-chain/linear GBCAs. Based on the ionicity and the molecular configuration, four types can be considered, ranging from the safest to the least safe group: (1) macrocyclic ionic (Dotarem), (2) open chain ionic (MultiHance, Primovist/Eovist, Magnevist, Vasovist), (3) macrocyclic nonionic (ProHance, Gadavist), and (4) open chain nonionic (Omniscan, OptiMARK) (Figs. 2.1 and 2.2). Gadolinium dissociates more easily from the chelator in the open-chain-nonionic group; the skin and organ deposition of free gadolinium has been linked to the development of nephrogenic systemic fibrosis (NSF), almost invariably reported in patients with a history of severe renal dysfunction (mostly eGFR < 15 mL/min/1.73 m2).
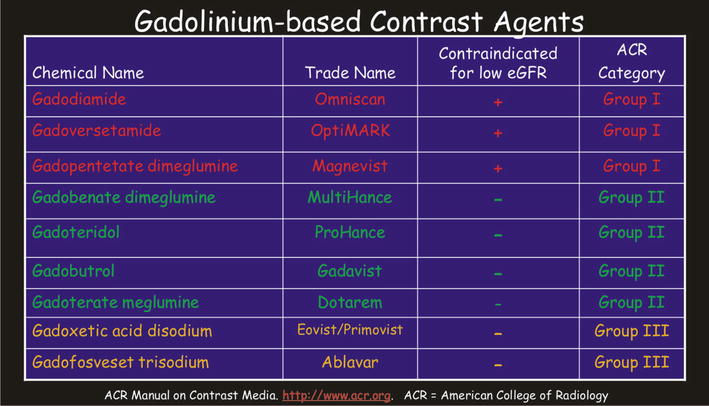
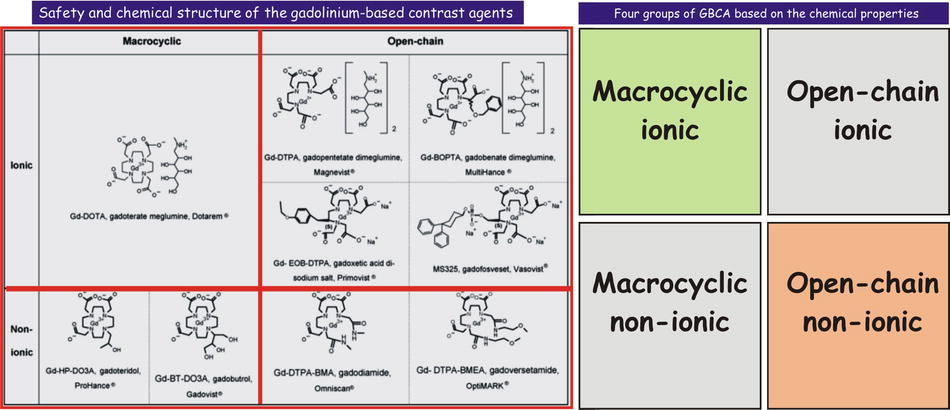
Fig. 2.1
Gadolinium-based contrast agents (GBCAs). Predominantly based on their safety record, the currently available GBCAs can be divided into three main groups. Group I is the least desirable with the poorest safety profile with contraindication for patients with low eGFR. In practice, many radiologists avoid the use of these agents with any form of renal dysfunction, including acute renal failure. Majority of the published cases of nephrogenic systemic fibrosis (NSF) are related to the use of Group I contrast agents. Group II has the best safety profile and can be used in patients with compromised renal function. In practice, however, many radiologists apply reduced dose per body weight with an eGFR of below 45 and avoid using these agents if the eGFR is below 30 and the patient is not on dialysis as well as in acute renal failure. Group III contrast agents are relatively new and need further clinical use in order to divide these into either Group I or II in the near future
Fig. 2.2
Safety and the chemical structure of the gadolinium-based contrast agents. The chemical structure of the chelate is either macrocyclic or open chain; the agents can be ionic or nonionic. In general, macrocyclic agents are more stable (stronger bond between the gadolinium and chelate). Ionic agents are considered safer than nonionic (unlike the iodine-based CT contrast agents). The figure on the right shows the four groups of the GBCAs: macrocyclic ionic is the safest, followed by the open chain ionic, macrocyclic nonionic, and open chain nonionic
Group I is comprised of three agents, including gadodiamide (Omniscan), gadoversetamide (OptiMARK), and gadopentetate (Magnevist). These agents have the least favorable safety profile and most associated with the nephrogenic systemic fibrosis (NSF). Particularly, these agents are contraindicated in patients with compromised renal functions (eGFR < 30 mL/min/1.73 m2); this corresponds to stage 4 or higher chronic kidney disease as well as patients with acute renal failure (characterized by a rapidly changing eGFR). In patients with hepatorenal syndrome or with liver transplant, these GBCAs are contraindicated at stage 3 renal disease (eGFR < 60).
Group II is comprised of the four most commonly used GBCAs: gadobenate (MultiHance), gadoteridol (ProHance), gadobutrol (Gadovist/Gadavist), and gadoterate (Dotarem). These contrast media have a favorable safety profile and often a long record (multiple years) of safe use in patients.
Group III is comprised of the newer GBCAs (gadoxetate (Eovist/Primovist), gadofosveset (Ablavar)) that need further clinical use in order to divide these into either Group I or II.
Liver-Specific GBCAs
Two GBCAs, gadoxetate (Primovist/Eovist) and gadobenate (MultiHance), have dual uptake and excretion pathway. Gadoxetate shows equal uptake and excretion via the kidneys (50 %) and liver (50 %). In addition, the described dose is only one-fourth of the most other GBCAs (0.025 mmol/kg body weight vs. 0.1 mmol/kg body weight) that probably results in a very faint early (within the first 3–4 min) vascular and organ enhancement. Particularly, the arterial phase of enhancement is often not timed and appears very faint. The major strength and advantage of gadoxetate is its ability to achieve a very intense hepatobiliary phase about 20 min after injection. The major disadvantages of gadoxetate include its faint arterial enhancement and the relatively early overlapping nonspecific and liver-specific effects making the enhancement of the vessels and lesions less conspicuous. Gadobenate is largely (95 %) excreted by the kidneys and behaves very much like a nonspecific contrast medium. Together with having a relatively higher relaxivity than most other GBCAs and accurate timing techniques (e.g., by using a bolus track technique), the early vascular and organ enhancement is quite intense. Only a small amount (5 %) is taken up by the hepatocytes and excreted into the bile ducts and bowel loops. The optimal hepatobiliary phase therefore occurs much later than with gadoxetates, between 60 and 90 min after injection. Some users consider this as a disadvantage; however, in our experience this actually is a major advantage of gadobenate compared to gadoxetate, because gadobenate’s nonspecific and liver-specific effects completely differ by 40–50 min and do not overlap. In addition, there is a window of about 3 h after injection to acquire a diagnostic hepatobiliary phase.
Literature
1. Altun E, Martin DG, Wertman R, Semelka RC, et al. Nephrogenic systemic fibrosis: change in incidence following a switch in gadolinium agents and adoption of a gadolinium policy—report from two U.S. universities. Radiology. 2009;253:689–96.
2. Shellock FG, Spinazzi A. MRI safety update 2008: part 1, MRI contrast agents and NSF. AJR Am J Roentgenol. 2008;191:1129–39.
3. Kuo PH, Kanal E, Abu-Alfa AK, et al. Gadolinium-based MR contrast agents and NSF. Radiology. 2007;242:647–9.
4. Thomsen HS. ESUR guideline: gadolinium-based contrast media and nephrogenic systemic fibrosis. Eur Radiol. 2007;17:2692–6.
3 Gadolinium-Based Contrast Agents: Uptake and Excretion Pathways
Based on the mode of their uptake and excretion via the kidneys and the liver, the currently available gadolinium-based contrast agents (GBCAs) can be divided into two groups:
1.
Nonspecific GBCAs:
(i)
Gadoterate (Dotarem)
(ii)
Gadopentetate (Magnevist)
(iii)
Gadoteridol (ProHance)
(iv)
Gadodiamide (Omniscan)
(v)
Gadoversetamide (OptiMARK)
(vi)
Gadobutrol (Gadovist/Gadavist)
(vii)
Gadofosveset (Ablavar, formerly Vasovist; a blood-pool agent)
2.
Dual nonspecific and liver-specific GBCAs:
(i)
Gadobenate (MultiHance) → 5 % liver; 95 % kidneys
(ii)
Gadoxetate (Primovist/Eovist) → 50 % liver; 50 % kidneys
GBCA Uptake and Excretion with Normal Renal and Liver Function
The nonspecific GBCAs show 100 % uptake and excretion through the kidneys in the setting of normal renal and liver function. Compare the nonspecific GBCAs to the two GBCAs (gadobenate and gadoxetate) with dual (renal and liver) uptake and excretion pathways (Fig. 3.1).
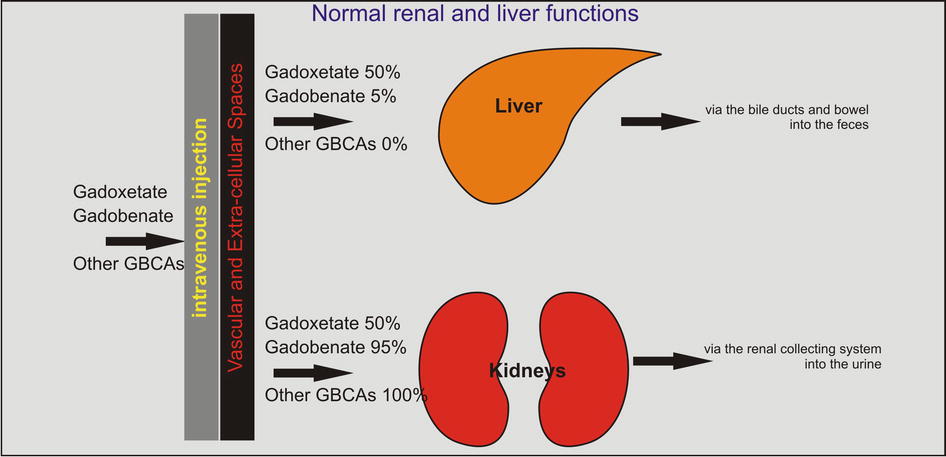
Fig. 3.1
Gadolinium-based contrast agents (GBCAs): uptake and excretion through the liver and kidneys. Two GBCAs (gadoxetate (Eovist/Primovist) and gadobenate (MultiHance)) differ from the other GBCAs (Ablavar, Dotarem, Magnevist, ProHance, and Gadavist) in regard to their hemodynamics. After the intravenous injection, most of the GBCAs are distributed throughout the vascular space and eventually excreted via the kidneys into the urine. Some GBCAs, such as Ablavar and MultiHance, have the ability to bind to the serum protein such as albumin and remain in the vascular space longer than other GBCAs. Ablavar, in particular, is specialized as a blood-pool agent due to its formulation with a macromolecule. Gadoxetate (Eovist/Primovist) and gadobenate (MultiHance) show variable renal and hepatic excretion. If the liver and the renal functions are normal, gadoxetate is equally excreted through these organs. Gadobenate, however, shows only 5 % excretion through the liver; therefore, it predominantly behaves as an extracellular GBCA with a small but very important liver-specific effect
GBCA Uptake and Excretion with Impaired or No Renal Function
With the renal dysfunction, the liver-specific GBCAs keep their excretion through the liver; however, this is limited by the transporters’ capacity within the wall of the liver cells; most of these GBCAs therefore will show prolonged circulation times (Fig. 3.2a). The nonspecific GBCAs, in comparison, entirely depend on the kidneys for their elimination from the body, have nowhere to go, and remain in the circulation for a prolonged period of time. This increases the risk for ligand-chelator dissociation (e.g., Gd-DTPA), particularly in the case of the high-risk GBCAs such as gadodiamide (Omniscan), gadoversetamide (OptiMark), and gadopentetate (Magnevist). These agents have the least favorable safety profile and are most associated with the nephrogenic systemic fibrosis (NSF). Particularly, these agents are contraindicated in patients with compromised renal functions (eGFR < 30 mL/min/1.73 m2); this corresponds to stage 4 or higher chronic kidney disease as well as patients with acute renal failure (characterized by a rapidly changing eGFR). The worst-case scenarios include severe renal dysfunction with or without liver dysfunction: the GBCAs in these patients remain in the circulation for a prolonged period of time with increased risk for free gadolinium (Gd+) organ and skin deposition.
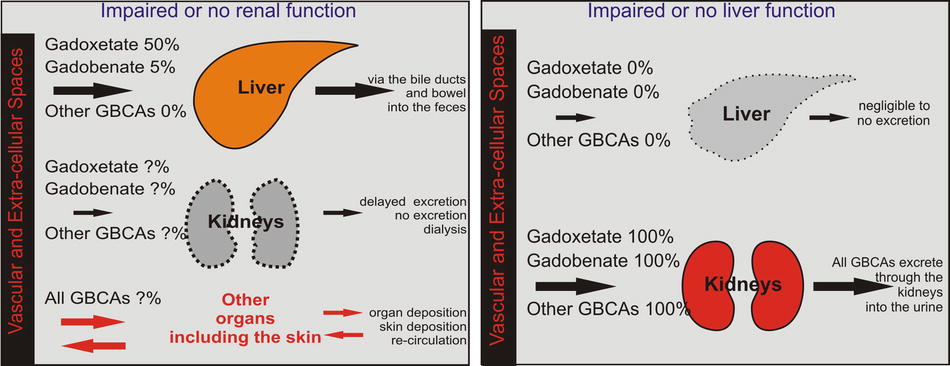
Fig. 3.2
Gadolinium-based contrast agents (GBCAs): uptake and excretion through either renal or liver dysfunction. (a) In patients with impaired or no renal function, the majority of the GBCAs cannot excrete through the kidneys and will recirculate for a prolonged period of time with increasing risk for the dissociation between the gadolinium and its chelate. Free gadolinium then can enter into the organs and the skin and can potentially cause nephrogenic systemic fibrosis. Gadoxetate and gadobenate do not really increase their excretion if the renal pathway is impaired due to the limitations of the hepatic transporters. (b) In patients with impaired or lack of liver function, all GBCAs, de facto, behave as extracellular contrast media and are solely excreted by the kidneys
GBCA Uptake and Excretion with Impaired or No Liver Function
With the liver dysfunction, the liver-specific agents behave as nonspecific contrast agents and are excreted via the kidney just like the nonspecific GBCAs (Fig. 3.2b). Therefore, in these scenarios, it is less of a safety problem. The liver-specific component of these GBCAs is, however, lost, and they will not provide the added value in regard to the assessment of the liver lesions and the bile ducts. The nonspecific GBCAs will function normally. In patients with hepatorenal syndrome or with liver transplant, however, all GBCAs are contraindicated at stage 3 renal disease (eGFR < 60). In such patients, a non-contrast MRI or MRI with half-dose of a GBCA with high relaxivity, such as gadobenate, could be considered. Interestingly, two of these three contrast agents are nonionic, open chain.
Literature
1. Altun E, Martin DG, Wertman R, Semelka RC, et al. Nephrogenic systemic fibrosis: change in incidence following a switch in gadolinium agents and adoption of a gadolinium policy—report from two U.S. universities. Radiology. 2009;253:689–96.
2. Shellock FG, Spinazzi A. MRI safety update 2008: part 1, MRI contrast agents and NSF. AJR Am J Roentgenol. 2008;191:1129–39.
3. Kuo PH, Kanal E, Abu-Alfa AK, et al. Gadolinium-based MR contrast agents and NSF. Radiology. 2007;242:647–9.
4. Thomsen HS. ESUR guideline: gadolinium-based contrast media and nephrogenic systemic fibrosis. Eur Radiol. 2007;17:2692–6.
4 Liver-Specific Contrast Agents: Uptake in the Liver and Lesions
In the 1990s and 2000s, the animal experimental work by Clement et al. and Pascolo et al. demonstrated that organic anion transporting polypeptides (OATPs), expressed at the basolateral membrane of hepatocytes, mediate the uptake of gadoxetate and that multidrug resistance-associated protein 2 (MRP2), expressed in the canalicular membrane, mediates the secretion from hepatocytes. In Figs. 4.1 and 4.2, these transporters are simply illustrated as follows: transporter I (uptake from the vascular space into the hepatocyte; aka OATP–1B1, OATP–1B3, and OATP–8) and Transporter II (excretion from the hepatocytes into the bile ducts; aka MRP2 and MRP3). In 2010, Tsuboyama et al. and Kitao et al. published landmark papers in Radiology, describing the mechanism of gadoxetate uptake with MRI-immunohistochemistry correlation.
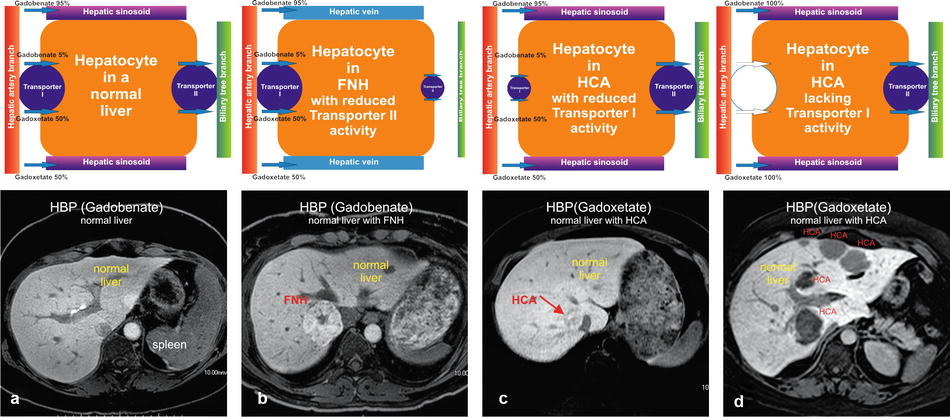
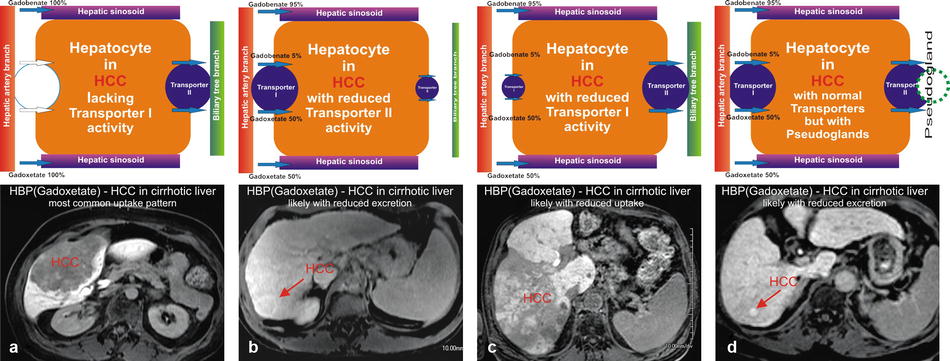
Fig. 4.1
Hepatocytes in normal liver, focal nodular hyperplasia (FNH), and hepatocellular adenomas (HCAs) with their respective transporters. (a) Hepatocyte in a normal liver contains two functioning transporters. Transporter I transports liver-specific GBCAs such as gadoxetate and gadobenate into the cell, and transporter II excretes these agents into the bile ducts. This results in a very bright liver with contrast also excreted in the bile ducts (arrow). (b) Hepatocytes in FNH have dysfunctional bile ducts and transporter II. Transporter I works properly and with normal uptake of contrast. After uptake, the contrast gets temporarily trapped, causing a persistent higher signal of the FNH than the background liver. (c) Hepatocytes in some HCA have dysfunctional transporter I, causing some uptake of contrast, which results in heterogeneous signal compared to the background liver. (d) Hepatocytes in most HCAs lack a functioning transporter I, preventing any contrast uptake into the HCA. Such HCAs appear darker than the background liver
Fig. 4.2
Hepatocytes in hepatocellular carcinomas (HCCs) within a cirrhotic liver demonstrating variable transporter activities. (a) Hepatocytes in a majority of HCCs do not have a functioning transporter I, preventing any contrast uptake, rendering such lesions darker than the background liver (arrow). (b) Hepatocytes in some HCCs have dysfunctional transporter II. Transporter I works properly with normal uptake of contrast. After uptake, the contrast gets temporarily trapped within the lesion, causing a persistent higher signal of the HCC than the background liver. (c) Hepatocytes in some HCCs have dysfunctional transporter I, causing reduced uptake of contrast, which results in heterogeneous appearance of the HCC. (d) Hepatocytes in some HCCs contain pseudoglands which cause entrapment of the contrast within the HCC, rendering the lesion with higher signal
Normal Liver
In the normal liver, the basolateral membranes of the hepatocytes show expression of both transporters I and II. Gadoxetate (50 %) and gadobenate (5 %) show uptake via transporter I and excretion via transporter II (Fig. 4.1a). The net result is the bright liver in the hepatobiliary phase (HBP) after injection of gadoxetate (at 20 min postinjection) and gadobenate (at 60 min postinjection).
Focal Nodular Hyperplasia (FNH) in a Normal Liver
The majority of FNHs probably show normal uptake (transporter I normal) and decreased excretion (decreased expression or function of the transporter II) of gadoxetate and gadobenate. The HBP shows FNH brighter than the background liver (Fig. 4.1b).
Hepatocellular Adenoma (HCA) in a Normal Liver
The majority of HCAs show no detectable uptake (probably absent transporter I) and result in hypointense appearance of HCAs on the HBP; a small subset of HCAs may show some uptake (Fig. 4.1c, d).
Hepatocellular Carcinoma (HCC) in a Cirrhotic Liver
The majority of HCCs show no detectable uptake based on the absent transporter I (OATPs) or increased expression of transporter II (MRP2/MRP3) resulting in a faster than normal excretion of contrast into the bile ducts, rendering mostly hypointense HCCs (70–80 %). Motosugi et al. reported that about 15 % of pseudolesions appear hypointense on the HBP. With the presence of transporter I and an increased transporter II with pseudogland formation or decreased transporter II, the HCC will appear hyperintense compared to the background liver on the HBP (Fig. 4.2). A recent paper by Nakamura et al. showed that the sensitivity of gadoxetate for HCC is only 69 %. Tsuboyama et al. described four different patterns of transporter I and II expression, explaining the appearance of HCC on the HBP (see the text box below):
I.
OATP – (no uptake of contrast into the hepatocytes possible) → hypointense HCC
II.
OATP + increased MRP2 at the canaliculi (faster excretion) → hypointense HCC
III.
OATP + increased MRP2 (secretion into the pseudoglands) → hyperintense HCC
IV.
OATP + decreased MRP2 (accumulation in the hepatocytes) → hyperintense HCC
Literature
1. Pascolo L, et al. Abc protein transport of MRI contrast agents in canalicular rat liver plasma vesicles and yeast vacuoles. Biochem Biophys Res Commun. 2001;282:60–6.
2. Grazioli L, et al. Accurate differentiation of focal nodular hyperplasia from hepatic adenoma at gadobenate dimeglumine-enhanced MR imaging: prospective study. Radiology. 2005;236:166–77.
3. Tsuboyama T, et al. Hepatocellular carcinoma: hepatocyte-selective enhancement at gadoxetic acid–enhanced MR imaging—correlation with expression of sinusoidal and canalicular transporters and bile accumulation. Radiology. 2010;255:824–33.
4. Kitao A, et al. Hepatocellular carcinoma: signal intensity at gadoxetic acid–enhanced MR imaging—correlation with molecular transporters and histopathologic features. Radiology. 2010;256:817–26.
5. Nakamura Y, et al. Detectability of hepatocellular carcinoma by gadoxetate disodium-enhanced hepatic MRI: tumor-by-tumor analysis in explant livers. J Magn Reson Imaging. 2013;37:684–91.
6. Kim J, et al. The value of gadobenate dimeglumine-enhanced delayed phase MR imaging for characterization of hepatocellular nodules in the cirrhotic liver. Invest Radiol. 2008;43:202–10.
7. Motosugi U, et al. Distinguishing hypervascular pseudolesions of the liver from hypervascular hepatocellular carcinomas with gadoxetic acid-enhanced MR imaging. Radiology. 2010;256:151–8.
5 MR Imaging Technique and Protocol
Typical MR imaging protocol (at 1.5T) for the liver should contain the following or similar types of sequences (Fig. 5.1):
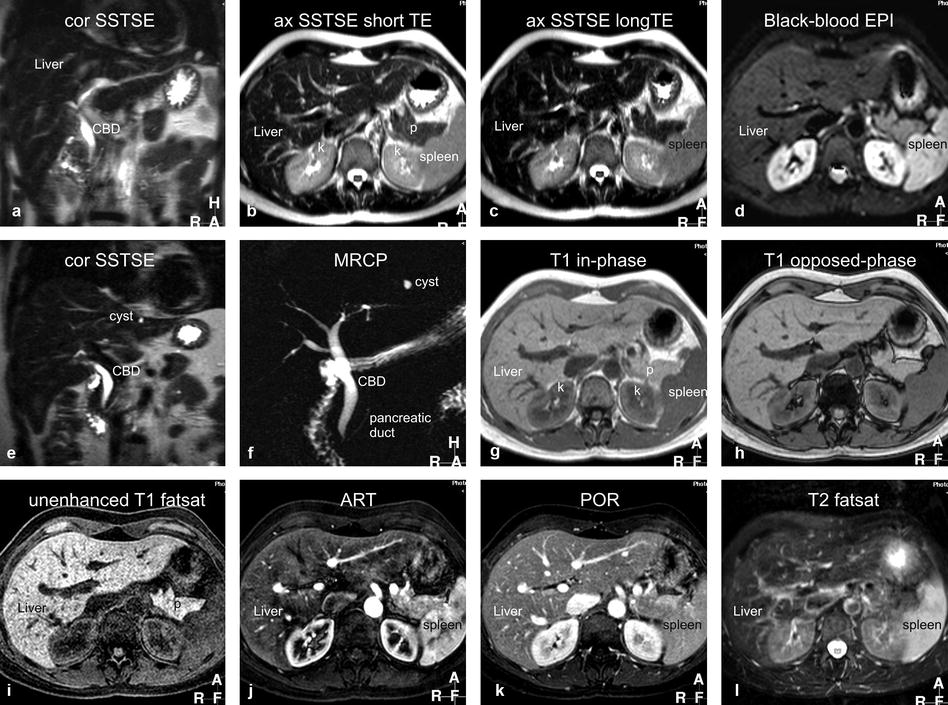
Fig. 5.1
Typical liver MRI protocol. (a) Coronal single-shot turbo spin-echo (cor SSTSE) image provides an overview of the anatomy. CBD common bile duct. (b) Axial SSTSE (ax SSTSE) image with a short echo time (TE = 80 ms) shows the liver darker than the spleen. p pancreas, k kidneys. (c) Axial SSTSE (ax SSTSE) image with a longer echo time (TE = 120 ms) shows decreased signal in the liver, spleen, and pancreas (which indicates the solid nature of the tissues). (d) Axial T2- and diffusion-weighted black-blood echo-planar imaging (BBEPI) shows the vessels dark with excellent liver-to-spleen contrast (most liver lesions follow the signal of the spleen). (e) and (f) Coronal thin-slice (5 mm) and thick-slab (40 mm) SSTSE breath-hold images as part of MRCP protocol show the relationship of the fluid-filled structures (biliary tree, the pancreatic duct, a cyst) to the solid tissues as well as an overview of the fluid-filled structures, respectively. (g) and (h) Axial T1-weighted in- and opposed-phase gradient-echo (GRE) images show the spleen darker than the liver indicating good T1 weighting; these sequences are sensitive for small amount of fat. (i) Axial three-dimensional (3D) unenhanced T1-weighted GRE image with fat suppression shows the liver and pancreas (p) with high signal intensity. (j) Axial 3D arterial phase GRE image (ART) shows intense enhancement of the arterial vessels, some enhancement of the portal vein (pv), no enhancement of the hepatic veins (hv), heterogeneous enhancement of the spleen, and intense enhancement of the pancreas. (k) Axial delayed phase image (DEL) shows enhancement of the hepatic veins (hv) and homogenous enhancement of the organs. (l) Axial respiratory-triggered, fat-suppressed, T2-weighted image (T2 fatsat) with moderate T2 weighting shows spleen with higher signal than the liver; note that – in contrast to the BBEPI – the intrahepatic vessels are bright
1.
Coronal single-shot turbo or fast spin echo (SSTSE or SSFSE) or half-Fourier acquisition single-shot turbo spin echo (HASTE): repetition time (TR), ∞; echo time (TE), 120 ms; flip angle, 90°; acquisition time, 20 s (a single breath-hold sequence) → serves as a localizer and provides an overview of the anatomy.
2.
Axial SSTSE with relatively short (80 ms) and longer (120–180 ms) TE; acquisition time, 20–25 s (two breath-holds) → detection and characterization of fluid-containing liver lesions such as cysts, hemangiomas, and biliary hamartomas.
3.
Axial black-blood echo-planar imaging (BBEPI): TR, 3,400 ms (minimum); TE, 60 ms; frequency and phase matrix, 144 × 256; field of view, 310–350 cm with a rectangular FOV 80 %; EPI factor, 109; sensitivity encoding (SENSE) factor, 2; half scan factor, 60 %; b-value, 20; acquisition time, 25 s; bandwidth per pixel in the phase-encoding direction, 9.2 Hz, and in the EPI readout direction, 1,387.1 Hz; and the polarity of the phase-encoding gradient set to posterior → provides T2-weighted images in breath-hold with better liver-to-lesion contrast than the standard T2-weighted turbo spin echo with fat suppression.
4.
Axial two-dimensional (2D) dual gradient echo (both in and opposed phases as one sequence in a single breath-hold): TR, 150–170 ms; TE, 4.2/2.1 ms; flip angle, 80–90°; acquisition time, 20 s → provides T1 information and detects focal or diffuse fatty infiltration in tumors and tissues.
5.
Axial dynamic three-dimensional fat-suppressed gradient-echo sequence (VIBE, THRIVE, LAVA):TR, minimum; TE, minimum; flip angle, 10–15°; slice thickness, 4–8 mm, interpolated to about 60 overlapping reconstructed sections of 4–2 mm; bandwidth, 62 kHz; acquisition time, 20–25 s in a single breath-hold → arterial phase is the single most important sequence and serves for the detection of liver lesions; all phases are utilized for the characterization based on the enhancement patterns of lesions.
6.
Coronal delayed three-dimensional fat-suppressed gradient-echo sequence: TR/TE, minimum; flip angle, 10–15°; slice thickness, 4–6 mm, interpolated to about 40 overlapping reconstructed sections of 2–3 mm; bandwidth, 62 kHz; acquisition time, 20–25 s in a single breath-hold → provides information about the persistent enhancement of lesions such as hemangiomas, capsular enhancement of hepatocellular carcinomas, peritoneal spread of disease, and biliary tree abnormalities.
7.
Axial T2-weighted turbo or fast spin echo (TSE or FSE) with fat saturation: TR, 2,000 ms; TE, 100 ms; flip angle, 90°; acquisition time, 2–5 min (respiratory triggered) → traditionally, this sequence has been used for the detection of solid liver lesions. Most likely, this sequence will be replaced by newer T2-weighted sequences such as BBEPI.
8.
Magnetic resonance cholangiopancreatography (MRCP) consists of a 2D heavily T2-weighted sequence with a thick slab of 30–60 mm to provide an overview of the biliary and pancreatic anatomy: TR, ∞; TE, 800 ms; flip angle, 90°; acquisition time, 2 s per slab which is typically acquired as a radial scan of 5–10 slabs around the common bile duct. This thick-slab MRCP is often combined with thin-slice coronal SSTSE with a TE of about 180 ms and thin sections (<5 mm).
6 Liver MRI: Pulse Sequence Diagram of T1- and T2-Weighted Sequences
The acquisition time (TA) is defined as TA = TR × N y (TR = repetition time and Ny = number of phase-encoding steps). A typical T2-weighted scan with a TR of 3,000 ms and phase-encoding steps of 200 resulted in a scan time of 10 min (3,000 ms × 200 = 600,000 ms, which is 600 s or 10 min). Now, the entire liver MRI exam takes less than 20 min.
Conventional T1- and T2-weighted spin-echo sequence: Spin echoes were first described by Erwin Hahn in 1950 (Hahn echoes) and later modified into a sequence, which is known as the Carr-Purcell-Meiboom-Gill (CPMG) sequence. The pulse sequence diagram (PSD) for the conventional spin echo (SE) consists of an excitation pulse of 90°, a refocusing pulse of 180° pulse, and an echo (Fig. 6.1). The repetition time (TR) is the time between the two excitation pulses (90°), and the echo time (TE) is the time between the 90° pulse and the middle of the echo. This sequence can be used to acquire T1- and T2-weighted sequences. Conventional SE is no longer applied in body or liver MRI.
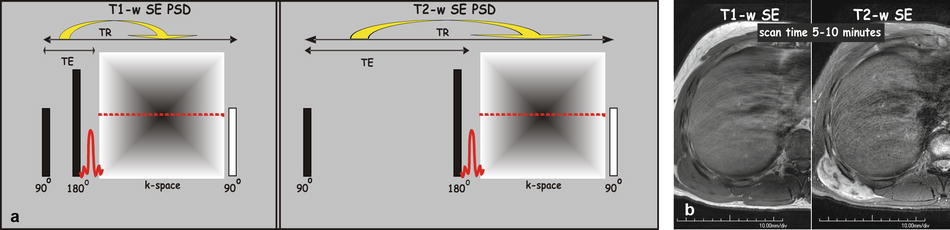
Fig. 6.1
Pulse sequence diagram (PSD) for a typical T1-weighted and T2-weighted spin-echo (SE) sequence. (a) A spin-echo sequence typically applies an excitation pulse of 90° and a refocusing pulse of 180°, which are followed by an echo. The echo time (TE) is defined as the time between the excitation pulse (90°) and the middle of the echo. The repetition time (TR) is defined as the time between two consecutive excitation pulses (90°). T1-weighted SE is characterized by a relatively short TR and shortest TE. T2-weighted SE is based on a longer TR and TE. Please note that per TR, only a single k-space line (i.e., signal corresponding to one phase-encoding step) is measured. The scan time, which is TR multiplied by the number of phase-encoding steps (TR × N y), to for instance cover the entire liver is relatively long (5–10 min). (b) T1-weighted SE image (first of the two images), through the right liver, shows bright fat and dark fluid (CSF). T2-weighted SE image shows gray fat and bright fluid. Note also the right posterior abdominal wall mass (m) that is dark on T1 and bright on T2
Turbo spin-echo or fast spin-echo sequences: Jürgen Hennig (in 1986) applied more than one refocusing pulses per TR. The number of refocusing pulses per TR is also called the turbo factor (TF) [hence the name turbo spin echo] or the echo-train length (ETL). The acquisition time in RARE (rapid acquisition with relaxation enhancement) sequence is as follows: TA = (TR × N y)/TF. The scan time is reduced by the turbo factor. For instance, with a TF or ETL of 5, the original scan time of 10 min would be only 2 min. Minimizing the echo spacing (i.e., the time in ms between the two consecutive refocusing pulses) is key to reduce the blurring artifacts. Blurring artifact (the edges of the short T2 species, for instance the solid organs, become blurred) results from the fact that the tissues with relatively shorter T2 times decay faster than the duration of the entire data collection. Currently, many centers continue to use respiratory-triggered fat-suppressed TSE or FSE sequence as part of their liver MRI protocol as a moderately T2-weighted sequence mainly to detect liver lesions (Fig. 6.2). Recently, a new T2-weighted sequence was introduced based on a three-point Dixon sequence.
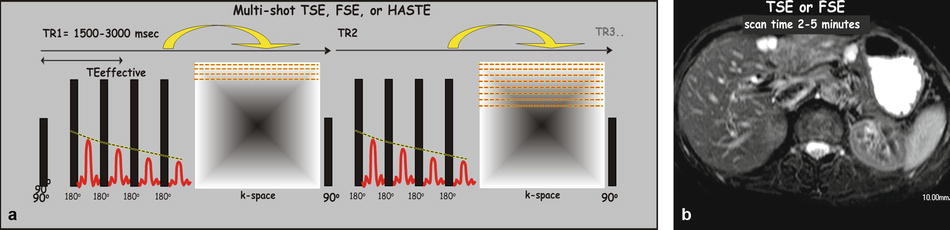
Fig. 6.2
Pulse sequence diagram (PSD) for a multi-shot turbo spin-echo (TSE) or fast spin-echo (FSE) sequence. (a) A TSE or FSE sequence typically applies an excitation pulse of 90° and a number of refocusing pulse of 180° per TR; each refocusing pulse is followed by an echo. The number of refocusing pulses per TR, known as the turbo factor (TF) or the echo-train length (ETL), is in fact the acceleration factor and lowers the scan time by that factor ((TR × N y)/TF). Each TR yields a number of k-space lines; the sequence is repeated till all the required k-space data has been acquired. Because multiple echoes are generated per TR, the TE is defined as the effective TE (time between the excitation pulse (90°) and the middle echo). (b) A TSE or FSE image for liver imaging is typically T2-weighted and utilized for lesion detection and characterization
Single-shot turbo spin-echo (SSTSE) or single-shot fast spin-echo (SSFSE) sequences: The RARE sequence also formed the basis for the much faster half-Fourier acquisition single-shot turbo spin-echo (HASTE) sequence; this sequence (aka SSTSE and SSFSE) allows breath-hold imaging to cover the entire liver; the acquisition time per slice is in the order of a second; the entire liver can easily be covered in 15–20 s breath-hold with superb image quality (Fig. 6.3).
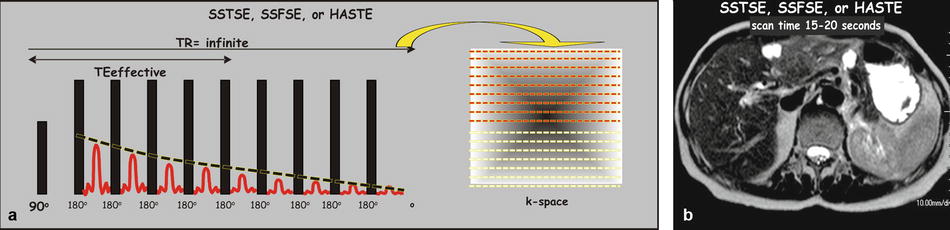
Fig. 6.3
Pulse sequence diagram (PSD) for a single-shot turbo spin-echo (SSTSE), single-shot fast spin-echo (SSFSE), or half-Fourier acquisition single-shot turbo spin-echo (HASTE) sequence. (a) An SSTSE, SSFSE, or HASTE sequence typically applies a single excitation pulse of 90° (hence the name “single shot”) and a long train of refocusing pulses, which are followed by a train of echoes. Because multiple echoes are generated per TR, the TE is defined as the effective TE (time between the excitation pulse (90°) and the middle echo). The repetition time (TR) is infinite because the excitation pulse is not repeated. The k-space symmetry allows acquisition of slightly over half of the k-space data to form an image. (b) A typical SSTSE image through the liver shows superb image quality due to very short scan time (1–2 s per image and 15–20 s to cover the liver)
T1-weighted gradient-echo sequences: As an alternative to the lengthy conventional T1-weighted spin echo, fast low-angle shot (FLASH) sequence was introduced in 1986. This is a two-dimensional gradient-echo sequence that allowed T1-weighted imaging in a few seconds, facilitating breath-hold MR imaging of the liver for the first time. Currently, the dynamic imaging is performed based on the fat-suppressed 3D T1-weighted sequences (VIBE/eTHRIVE/LAVA/Dixon), with high spatial resolution.
Literature
1. Lauterbur PC. Image formation by induced local interactions: examples employing nuclear magnetic resonance. Nature. 1973;242:190–1.
2. Hahn EL. Spin echoes. Phys Rev. 1950;80:580–94.
3. Carr HY, Purcell EM. Effects of diffusion on free precession in nuclear magnetic resonance experiments. Phys Rev. 1954;94:630–8.
4. Hennig J, Nauerth A, Friedburg H. RARE imaging: a fast imaging method for clinical MR. Magn Reson Med. 1986;3:823–33.
5. Mitchell DG, Outwater EK, Vinitski S. Hybrid RARE: implementations for abdominal MR imaging. J Magn Reson Imaging. 1994;4:109–17.
6. Patel MR, Klufas RA, Alberico RA, Edelman RR. Half-Fourier Acquisition Single-Shot Turbo Spin-Echo (HASTE) MR: comparison with fast spin-echo MR in diseases of the brain. AJNR Am J Neuroradiol. 1997;18:1635–40.
7. Frahm J, Haase A, Matthaei D. Rapid NMR imaging of dynamic processes using the FLASH technique. Magn Reson Med. 1986;3:321–7.
Related posts:
Stay updated, free articles. Join our Telegram channel

Full access? Get Clinical Tree


