Anatomy
4.1.1 Pleura and Interlobar Fissures
The outer surfaces of both lungs are covered by visceral pleura, which also surrounds the lobes and is reflected into the interlobar fissures, where it forms a double layer. The interlobar fissures are visible on chest radiographs when they are tangential to the X-ray beam. The chest cavity is lined by parietal pleura. The space between the visceral and parietal pleura contains a thin fluid film that facilitates relative movement between the pleural layers during respiratory excursions. The pleural cavity is normally at a negative pressure of approximately 5 mm H2O on expiration and as low as −20 mm H2O on inspiration. This enables the lung to remain expanded and apposed to the chest wall.
Caution
In the percutaneous needle biopsy of lung nodules, the likelihood of pneumothorax increases with the number of passes through the pleura. For this reason it is best to avoid passing the needle through the interlobar fissures, even if this may necessitate a longer pathway from skin to lesion.
The minor fissure separates the upper lobe of the right lung from the middle lobe. It is visible in PA and lateral radiographs because it has a partial tangential orientation in both projections (▶ Fig. 4.1). The major fissure of the right lung separates the lower lobe from the upper and middle lobes (see ▶ Fig. 4.1). The left lung has one major fissure separating the upper and lower lobes. The major fissure on each side is visible only in the lateral radiograph, as that is the only projection in which it is tangential to the X-ray beam.

Fig. 4.1 Standard radiographic views of the chest. (a) The pulmonary lobes are partially superimposed in the PA projection. The interlobar fissures are not visible except for a peripheral portion of the minor fissure. (b) Lateral radiograph. The interlobar fissures are visible in this projection because of their horizontal orientation relative to the X-ray beam (white lines: indicate interlobar fissures of the right lung; blue line indicates interlobar fissure of the left lung). UL, upper lobe; ML, middle lobe; LL, lower lobe.
Imaging landmarks Lung changes seen in the frontal radiograph cannot be localized to a specific lobe because the lobes are superimposed. Instead, findings are assigned to any of three lung zones: the upper zone (extending from the apex to the upper pole of the hilum), middle zone (from the upper to lower poles of the hilum), and lower zone (inferior to the hilar lower pole; ▶ Fig. 4.2a). Additionally, the outer 4 cm of lung parenchyma is called the peripheral lung and the perihilar tissue is called the central lung (▶ Fig. 4.2b).

Fig. 4.2 PA chest radiograph. (a) Changes visible in the frontal view are assigned to any of three lung zones: upper, middle, and lower. The hila serve as landmarks for defining the lung zones. (b) The lung parenchyma is divided into the central (perihilar) lung and the peripheral lung.
4.1.2 Trachea and Pulmonary Segments
The trachea extends from the larynx to the two main bronchi. It is located along the midline, anterior to the esophagus. It begins at the cricoid cartilage and ends at the carina approximately at the level of the T4 vertebra. Its walls are reinforced by horseshoe-shaped cartilage rings that are interconnected by the anular ligaments and stabilize the trachea so that it does not collapse. The posterior membranous part of the trachea, called the pars membranacea, is stretched between the two ends of the incomplete cartilage rings; it contains elastic connective tissue and smooth muscle cells. The cartilage rings are continued inferiorly into the main bronchi. In the segmental bronchi they are replaced by cartilage plates, which diminish in size and number in the smaller bronchial branches and are finally absent in the bronchioles.
The right main bronchus is steeper than the left. The angle between the two main bronchi measures 60 to 75°. Splaying of the carina is most commonly caused by an enlarged left atrium (▶ Fig. 4.3) but may also result from enlarged infracarinal lymph nodes.

Fig. 4.3 Normal and abnormal bifurcation angles. (a) The normal bifurcation angle at the carina is less than 70°. The right main bronchus in adults is more vertical than the left, which is why aspiration is more common on the right side. (b) The bifurcation angle is abnormally increased to more than 90°, due in this case to an enlarged left atrium. (c) CT (same patient as in [b]) demonstrates enlargement of the left atrium. The other cardiac chambers are not dilated.
Note
The more vertical orientation of the right main bronchus, present by the age of about 12 years, explains why aspiration is more common on the right side in adults.
▶ Fig. 4.4 illustrates the segmental anatomy of the lung. When isolated pulmonary nodules are found, the affected lung segment should be identified in the radiology report whenever possible.

Fig. 4.4 Segmental bronchi and pulmonary segments. (a) Segmental anatomy of the lung. (b) Axial CT scan with lung window setting at the level of the upper lobes. (c) Axial CT scan with lung window setting at the level of the middle lobe. (d) Axial CT scan with lung window setting at the level of the lower lobes. Right: I, apical upper lobe segment; II, posterior upper lobe segment; III, anterior upper lobe segment; IV, lateral middle lobe segment; V, medial middle lobe segment; VI, apical lower lobe segment; VII, mediobasal lower lobe segment; VIII, anterobasal lower lobe segment; IX, laterobasal lower lobe segment; X, posterobasal lower lobe segment. Left: I and II, apicoposterior upper lobe segment; III, anterior upper lobe segment; IV, superior lingular segment; V, inferior lingular segment; VI—X, same as on the right.
(Reproduced from Schünke M, Schulte E, Schumacher U. Prometheus. LernAtlas der Anatomie: Innere Organe. Illustrated by M. Voll /K. Wesker. 2nd ed. Stuttgart: Thieme; 2009.)
4.1.3 Vessels
The lung oxygenates blood delivered to it by the pulmonary arteries. Similarly to the liver, the lung also has a second vascular system: the bronchial arteries. These vessels arise from the descending aorta at the level of the T4 vertebra (▶ Fig. 4.5a), and their origins are subject to variation (▶ Fig. 4.5b). The bronchial arteries accompany the bronchi as nutrient vessels. Some of the bronchial arteries in the peripheral lung open into the perialveolar capillaries, forming anastomoses by which the bronchial and pulmonary vessels communicate. These connections may protect the lung tissue from infarction following a pulmonary embolism. The rest of the blood in the bronchial arteries drains through the bronchial veils to the pulmonary veins and also to the azygos and hemiazygos veins.

Fig. 4.5 Origin of the bronchial arteries. (a) Typical origin from the descending aorta at the level of the T4 vertebra. Marked hypertrophy of the bronchial arteries is noted due to chronic infection. (b) Variant in which the bronchial arteries arise from the left subclavian artery.
The pulmonary arteries run parallel to the bronchi and branch with them into the segmental arteries.
Note
The normal pulmonary arterial pressure is less than 25 mm Hg at rest and less than 30 mm Hg during exercise.
The pulmonary arteries, being a low-pressure system, are highly distensible. Only one-fourth of the pulmonary capillaries are perfused at rest. When the cardiac output rises during exercise, the large vessels dilate and the percentage of perfused capillaries increases. Given the normal pressure gradients that exist in the lung, the vessels in the basal lung regions are more dilated than in the apical regions when the individual is in an upright position. This relationship is altered when pulmonary venous congestion is present (see ▶ Fig. 2.11).
Imaging landmarks The right pulmonary artery runs horizontally through the mediastinum and thus appears as an oval figure in the lateral chest radiograph (see ▶ Fig. 1.2). The left pulmonary artery forms a more linear, cane-shaped figure that arches over the left main bronchus (see ▶ Fig. 1.2). The pulmonary arteries and lymph nodes form the hilar shadow in the PA or AP radiograph.
Note
The lower lobe artery on the right side is considered dilated if its diameter exceeds 12 mm in women or 15 mm in men.
The diameter of the pulmonary trunk is measurable on CT or MRI. It should not exceed 2.8 cm. The ascending aorta provides a reference standard that is independent of body size: The diameter of the pulmonary trunk should not exceed the diameter of the ascending aorta. In patients with ectasia of the ascending aorta, the descending aorta can be used instead.
4.1.4 Pulmonary Veins
The lung is drained by four pulmonary veins, which open at a steep angle into the left atrium (▶ Fig. 4.6, ▶ Fig. 4.7). The upper lobe veins drain the upper lobes plus the middle lobe of the right lung; the lower lobe veins drain the lower lobes.

Fig. 4.6 Pulmonary veins. Coronal reformatted MP RAGE image. 1, Right superior pulmonary vein; 2, right inferior pulmonary vein; 3, left superior pulmonary vein; 4, left inferior pulmonary vein.

Fig. 4.7 Pulmonary veins. Axial CT scans. (a) Right superior pulmonary vein (arrow). (b) Left superior pulmonary vein (arrow). (c) Right inferior pulmonary vein (arrow). (d) Left inferior pulmonary vein (arrow).
Imaging landmarks The pulmonary veins and arteries form vascular markings that are visible on chest radiographs. Generally the two vascular systems cannot be differentiated in the peripheral lung, although the pulmonary veins, which open into the left atrium, are more horizontal than the pulmonary arteries, which arise at a more caudal level and have a steeper orientation. The pulmonary arteries form the hilar silhouette.
4.1.5 Lung Parenchyma
The alveoli are the site where gas exchange takes place and are also the smallest functional unit of the lung parenchyma. 1 They fluctuate in size during respiration: their individual diameters are approximately 50 μm during expiration and 250 μm during inspiration. There are approximately 400 million alveoli, which provide a total gas-exchange surface area of up to 120 m2. Their histological structure is optimized for gas exchange: The alveoli have a thin basement membrane covered by squamous type I pneumocytes. Cellular thickness may be as little as 0.1 μm in places to keep the diffusion pathway short. The cells have an elongated shape, with each cell covering a relatively large surface area. Type II pneumocytes, which are more compact and have a somewhat oval shape, are interspersed among the type I cells. They form surfactant, which reduces surface tension and keeps the alveoli from collapsing during expiration. While type II pneumocytes cover only about 20% of the alveolar surface area, they comprise almost 90% of the pneumocyte population. The capillaries are embedded in the interstitium, which is extremely thin so as to shorten the diffusion pathway. The alveoli are interconnected by the pores of Kohn.
One pulmonary acinus is supplied by one terminal bronchiole (▶ Fig. 4.8). The acinus measures 6 to 10 mm in diameter. Up to 12 acini form the secondary lobule, which ranges from 1.0 to 2.5 cm in diameter, depending on its location, and is the smallest unit visible on high-resolution (HR) CT. The secondary lobules are surrounded by connective tissue septa, which are traversed by veins and lymphatics. Each encloses approximately 12 acini, the exact number ranging from a minimum of 3 to a maximum of 24 (▶ Fig. 4.9). The secondary lobules are largest in the peripheral lung, where they have a relatively uniform cuboid shape. The septa are thicker in this region (approximately 100 μm). The secondary lobules become smaller toward the center of the lung, the acini fewer in number, and the connective tissue septa thinner. The connective tissue septa in most healthy individuals cannot be defined by imaging.

Fig. 4.8 Bronchial tree. The number of bronchial divisions varies with location and ranges from approximately 10 in the perihilar region to 25 in the peripheral lung. (a) Trachea and main bronchi. (b) Segmental bronchi and alveoli. (Reproduced from Schünke M, Schulte E, Schumacher U. Prometheus. LernAtlas der Anatomie: Innere Organe. Illustrated by M. Voll/K. Wesker. 2nd ed. Stuttgart: Thieme; 2009).

Fig. 4.9 Secondary lobule. Diagrammatic representation. The bronchiole and artery run together through the center of the lobule while the veins follow the interlobular septa.
Note
The secondary lobule is the smallest unit enclosed by connective tissue in the lung. It is the most important anatomical landmark for the interpretation of high-resolution pulmonary CT.
The interlobular septa in the secondary lobule are the principal anatomical landmarks for the interpretation of high-resolution CT data sets. 1 They are composed of connective tissue and separate the secondary lobules from one another. They arise from the pleura and are part of the “peripheral connective-tissue framework” that covers the exterior of the lung and permeates it in the form of interlobar septa. These septa transmit the lymphatic vessels of the lung and the pulmonary veins. Thickening of the interlobular septa is a feature of many interstitial lung diseases and occurs in lymphangitic carcinomatosis as well as pulmonary venous congestion (▶ Fig. 4.10). Two other important structures in the secondary lobule are the artery and bronchus, but they are visible only in pathologic states. At the center of each secondary lobule is one artery and one bronchus, each approximately 1 mm in diameter. The bronchus at this level is called a preterminal bronchiole. Because of the great variability in the size of the secondary lobule it is not possible to identify the generation of the bronchus. 2 Bronchi and arteries divide in an irregular dichotomous pattern, i.e., they always divide into two vessels of different diameters. A centrilobular bronchus 1 mm in diameter has a wall thickness of approximately 0.15 mm, which is below the resolution limit of HRCT. Bronchi and arteries are embedded in a connective tissue framework that originates from the hila and permeates the lung. The central arteries and bronchi in the secondary lobule are surrounded by functional lung parenchyma.

Fig. 4.10 Thickening of the interlobular septa. (a) Thickened interlobular septa (arrow) in a patient with pulmonary venous congestion. The thickened septa are especially prominent in the subpleural lung. (b) The interlobular septa are not visualized in a healthy lung.
4.2 Tracheobronchial System
4.2.1 Normal Variant: Tracheal Bronchus
Brief definition A tracheal bronchus is an accessory bronchus that arises directly from the supracarinal trachea. A tracheal bronchus that supplies the entire upper lobe is also called a “pig bronchus” or bronchus suis. The incidence of this variant is low, at approximately 1%.
Imaging signs CT directly visualizes the accessory bronchus and can identify the lung parenchyma supplied by it (▶ Fig. 4.11).

Fig. 4.11 Tracheal bronchus. (a) 3D reconstruction from a CT data set displays the high origin of the right upper lobe bronchus from the supracarinal trachea. (b) Multiple stenotic sites are visible in the lower trachea, the right main bronchus, and in the bronchus of the anterior upper lobe segment, leading to hypoventilation and atelectasis.
Clinical features Most patients with a tracheal bronchus are asymptomatic. Recurrent episodes of pneumonia may occur if there is stenosis or obstruction.
Key points CT can define the location and extent of the tracheal bronchus and detect possible sites of tracheal stenosis.
4.2.2 Tracheal Stenosis and Tracheopathia Osteochondroplastica
Brief definition Acquired tracheal stenosis may result from long-term mechanical ventilation, inflammation, or intra- or extraluminal tumors. Tracheopathia osteochondroplastica is characterized by the formation of osseous or cartilaginous nodules in the submucosa, which in some cases may cause tracheal stenosis. The peak age incidence is after the fifth decade, with a predilection for males.
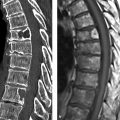
Imaging signs CT can differentiate compression by an extraluminal mass from stenosis due to scarring. The location and extent of the stenosis can also be evaluated with CT. The location of the osseous or cartilaginous nodules can be determined in tracheopathia osteochondroplastica (▶ Fig. 4.12).

Fig. 4.12 Tracheopathia osteochondroplastica. (a) Axial CT scan shows ossifications with typical sparing of the pars membranacea. (b) Coronal reformatted image defines the craniocaudal extent of the process.
Clinical features The cardinal symptoms of tracheal stenosis are dyspnea and stridor. Tracheopathia osteochondroplastica may be asymptomatic when not associated with tracheal stenosis.
4.2.3 Bronchiectasis
Brief definition Bronchiectasis is an abnormal dilatation of bronchi. Most commonly it is caused by weakening of the bronchial walls due to recurrent inflammation combined with raised intraluminal pressure like that caused by mucous plugging with a check-valve mechanism that restricts expiration. This combination may occur as a result of recurrent bronchopneumonia, cystic fibrosis, alpha1-antitrypsin deficiency, ciliary dyskinesia syndrome, chronic aspiration of gastric juice, and other diseases giving rise to the described pathogenic mechanism. In turn, sites of bronchiectasis create microbial reservoirs with a potential for recurrent infections.
Imaging signs Areas of bronchiectasis appear on chest radiographs as bandlike structures of increased lucency that are often framed by thickened bronchial walls (▶ Fig. 4.13). This finding is called the “tram-track sign.” Bronchi that are completely filled with mucus appear as dense bands (▶ Fig. 4.14). On CT, the bronchi are dilated to a diameter larger than the accompanying artery. If the ratio of bronchial to arterial diameter is greater than 1.5, there is bronchiectasis (see ▶ Fig. 4.13b). Bronchiectasis is classified by its morphology as cylindrical, saccular, or cystic. There may be mucus retention due to impaired clearance of secretions.

Fig. 4.13 Bronchiectasis in cystic fibrosis. (a) Chest radiograph shows a positive tram-track sign in the right upper lobe (circle). (b) Axial CT shows bronchial dilatation.

Fig. 4.14 Mucus-filled bronchi due to mucus retention in the form of a mucocele. (a) Chest radiograph shows bandlike opacities pointing toward the hilum in a V-shaped pattern. (b) Coronal reformatted CT image shows mucus-filled bronchi in the right upper lobe and bronchiectasis on the left side.
Clinical features A common symptom of bronchiectasis is a morning cough productive of sputum. Patients suffer from recurrent bronchopulmonary infections.
Differential diagnosis As a rule, bronchiectasis is easily diagnosed on CT scans. In rare cases bronchiectasis with mucus retention may be mistaken for an abscess or cavitating mass.
Key points Bronchiectasis is an abnormal dilatation of bronchi caused by recurrent inflammation and weakening of the bronchial walls combined with raised intraluminal pressure due to plugging by mucus or debris. The chest radiograph typically shows parallel “tram-track” structures. CT permits direct visualization of the dilated bronchi.
4.2.4 Bronchiolitis
Brief definition Bronchiolitis is an inflammation of the bronchioles that may have various causes. Acute infectious bronchiolitis in infants and small children may be caused by adenoviruses, respiratory syncytial virus, chlamydiae, or Mycoplasma pneumoniae. Due to the small diameters of the bronchioles in children under 3 years of age, the inflammation typically causes bronchiolar obstruction with a check-valve mechanism and overinflation of the lungs. Bronchiolitis in older children and adults may be caused by the organisms mentioned in addition to bacteria (Haemophilus influenzae, atypical mycobacteria, Mycobacterium tuberculosis) and fungi such as Aspergillus species.
Imaging signs Affected bronchial walls appear blurred and thickened on the plain chest radiograph. The lung is overinflated in children under 3 years of age (▶ Fig. 4.15); this feature is absent in older children and adults. HRCT shows centrilobular nodules and a characteristic “tree-in-bud” pattern. The latter is caused by plugging of the terminal and respiratory bronchioles by cells, mucus, and debris. As a result, the bronchioles create an arborizing pattern that resembles a budding tree, which is most pronounced in the outer third of the lung parenchyma (▶ Fig. 4.16).

Fig. 4.15 Bronchiolitis in a 5-month-old child. Chest radiograph demonstrates overinflation of the lung. Bilateral perihilar ringlike structures are end-on views of wall-thickened bronchi. The tram-track signs in both upper lobes are from wall-thickened bronchi viewed in longitudinal projection. The blurred appearance of the bronchi is due to infiltration of the peribronchial connective tissue. Hilar enlargement is caused by associated lymphadenopathy.

Fig. 4.16 Bronchitis and bronchiolitis. The bronchial walls on the right side are thickened. Sharply circumscribed centrilobular nodules (arrows) correspond to bronchioles filled with mucus, cells, and debris. The tree-in-bud pattern (circled area) visible at the periphery and near the interlobar fissure is caused by obstructed bronchioles sectioned by the CT slice. Centrilobular densities with blurred margins represent peribronchial alveolar infiltrates.
Note
The tree-in-bud sign is typical of cellular infiltrates in response to infection and is virtually pathognomonic for an infection.
Clinical features Small children present with acute dyspnea, tachypnea, and occasional cyanosis. The symptoms improve over a period of several days. Adults complain of dry cough and dyspnea.
Differential diagnosis Bronchiolitis due to other causes can be differentiated by careful history taking (allergen exposure in sensitized patients, dysphagia suggesting aspiration, and so on) and laboratory tests.
Key points Infectious bronchiolitis leads to overinflation of the lungs in children under 3 years of age. The tree-in-bud sign is the hallmark of infection on CT scans, which are obtained principally in adult patients.
4.2.5 Constrictive Bronchiolitis
Brief definition Constrictive bronchiolitis is characterized by a peribronchial fibrosis that causes luminal narrowing of the bronchioles. This creates a check-valve mechanism, leading to overinflation of affected lung areas. Constrictive bronchiolitis can have a variety of causes that include infection, connective tissue diseases, drug toxicity, graft-versus-host disease after bone marrow transplantation, or a chronic rejection response after heart or lung transplantation.
Imaging signs The chest radiograph is usually normal. A mosaic density pattern is characteristically present on CT scans. Images at end-expiration show increased density in unaffected areas and regional air trapping in affected areas, which differs from the homogeneous expiratory density increase seen in the lung parenchyma of healthy individuals (▶ Fig. 4.17). Perfusion in these hypoventilated regions is reduced by the Euler–Liljestrand mechanism, causing a compensatory increase of perfusion in the unaffected areas with an accentuated mosaic pattern. The bronchial walls may be thickened. The involvement of small bronchi leads to the appearance of sharply circumscribed centrilobular nodules.

Fig. 4.17 Axial CT scans after lung transplantation in patients with and without constrictive bronchiolitis. (a) Image at end-inspiration in a patient with constrictive bronchiolitis, in rejection after bilateral lung transplantation. (b) Image at end-expiration in the same patient as in (a) shows patchy areas of decreased density. (c) Image at end-inspiration in a patient without constrictive bronchiolitis after left lung transplantation. (d) Image at end-expiration in the same patient as in (c) shows homogeneous increased density of the lung parenchyma.
Caution
The tree-in-bud pattern is not characteristic of constrictive bronchiolitis.
Clinical features The cardinal symptoms are dyspnea and dry cough.
Differential diagnosis Differentiation is required mainly from cryptogenic organizing pneumonia (COP) and acute bronchiolitis.
Key points Constrictive bronchiolitis may be caused by various diseases. The common end point is fibrotic narrowing of the small airways. Many patients have a normal chest radiograph. CT shows regional overinflation with expiratory air trapping as a characteristic sign.
4.2.6 Emphysema, Alpha1-Antitrypsin Deficiency, and Chronic Obstructive Pulmonary Disease
Brief definition Emphysema is defined as enlargement of the alveolar air space due to destruction of the alveolar septa. A homogeneous distribution across the secondary lobules is called panlobular emphysema and occurs in patients with alpha1-antitrypsin deficiency. Centrilobular emphysema, on the other hand, shows an asymmetrical distribution around the terminal bronchus at the center of the secondary lobule. This type of emphysema is smoking-related and occurs in the setting of COPD. The upper lobes and apical lower lobes are most severely affected as a rule. Advanced stages of centrilobular emphysema may progress to panlobular emphysema. Subtypes are paraseptal emphysema, which spreads beneath the pleura and may be complicated by spontaneous pneumothorax, and paracicatricial emphysema caused by retraction due to scarring of adjacent parenchyma. Alpha1-antitrypsin inhibits trypsin and other elastases that are acutely released from inflammatory cells such as neutrophilic granulocytes and alveolar macrophages in response to inflammation. The function of elastases is to enable inflammatory cells to migrate rapidly through the tissue to an inflammatory focus. An alpha1-antitrypsin deficiency or chronic inflammation creates an imbalance which culminates in destruction of the alveolar walls.
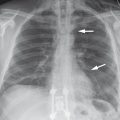
Imaging signs The upright chest radiograph shows flattening of the diaphragm due to overinflation of the lungs; this is the most sensitive and often earliest sign of pulmonary emphysema (▶ Fig. 4.18). The retrosternal airspace is increased to more than 2.5 cm, and the distance between the sternum and spinal column is also increased. The retrosternal contact area of the right ventricle is decreased to less than 3 cm. The lateral radiograph shows bulging of lung parenchyma into the intercostal spaces. The costophrenic angles are increased to more than 90° in both projections. Lung lucency is markedly increased in the advanced stage. Emphysematous bullae may be visible as hyperlucent areas. The threshold attenuation value for diagnosing emphysema on CT scans is >950 HU. The heart remains small, and pulmonary vascularity is decreased due to parenchymal destruction. Centrilobular and panlobular emphysema can be differentiated by HRCT (▶ Fig. 4.19).

Fig. 4.18 Pulmonary emphysema. Chest radiographs show hyperlucent lungs with marked flattening and depression of the diaphragm. The retrosternal contact area is decreased. (a) PA radiograph. (b) Lateral radiograph.

Fig. 4.19 Centrilobular and panlobular pulmonary emphysema. HRCT. (a) Centrilobular pulmonary emphysema. (b) Panlobular pulmonary emphysema.
Clinical features The main symptom is slowly progressive dyspnea.
Key points Pulmonary emphysema is characterized by parenchymal destruction beyond the terminal bronchioles and results from an imbalance between elastases and inhibitory enzymes. Pulmonary overinflation is marked by flattening and depression of the diaphragm and hyperlucency of the lung. Cor pulmonale is present due to the rarefaction of vessels in the pulmonary circulation.
4.2.7 Atelectasis
Brief definition Atelectatic lung areas are hypoventilated but perfused, with the result that blood is shunted to the arterialized side. The term “atelectasis” comes from the Greek ateles meaning “incomplete” and ektasis meaning “expansion.” Four types are distinguished by their pathogenic mechanism:
Compression atelectasis: This type results from extrinsic compression of the lung parenchyma and is almost always present in patients with pleural effusions (▶ Fig. 4.20). Compression by a chest-wall tumor is a less common cause.
Absorption atelectasis: This type results from the obstruction of a bronchus. The most common cause in intensive care patients is mucous plugging. In ambulatory patients, it is necessary to exclude tumors that obstruct the bronchial lumen by extrinsic pressure or occlude it due to endobronchial growth (▶ Fig. 4.21). Absorption atelectasis takes 24 hours to develop in patients breathing room air; room air consists of approximately 78% nitrogen, which has low solubility in the blood and is absorbed very slowly. Atelectasis develops more rapidly in patients ventilated with oxygen-enriched air due to the higher solubility of oxygen.
Adhesive atelectasis: Adhesive atelectasis results from surfactant deficiency. This type of atelectasis is rarer than the first two and may occur, for example, in pulmonary embolism patients with deficient surfactant formation in the affected areas. It is also encountered in premature infants: surfactant formation begins in the 24th week of gestation.
Contraction atelectasis occurs in areas that border scars.

Fig. 4.20 Compression atelectasis. (a) Chest radiograph shows right-sided pleural effusion. (b) CT shows compression atelectasis of the right lower lobe (arrow) with a unilateral pleural effusion (asterisk). The mediastinum is not shifted because the mass effects of the pleural effusion and atelectasis cancel out.

Fig. 4.21 Absorption atelectasis associated with a bronchogenic carcinoma in the central left lung. The segmental bronchus of the anterior lower lobe segment is obstructed. (a) Chest radiograph shows the borders typical of atelectasis. (b) Left central mass (arrow) shows little contrast with the atelectasis (dashed arrow). Vessels are defined within the atelectatic segment.
Caution
Atelectasis in different pulmonary lobes leads to characteristic patterns of opacity and to displacement of the diaphragm and mediastinum (▶ Fig. 4.22). Awareness of these patterns is important in the diagnosis of atelectasis, which may be the initial sign of a pulmonary mass.

Fig. 4.22 Typical patterns of opacity produced by atelectasis and pulmonary infiltrates. Diagrammatic representation. Atelectases are shown in red, infiltrates in blue.
Imaging signs Atelectases appear as opacities on chest radiographs, usually without an air bronchogram. In absorption atelectasis, the mediastinum is generally shifted toward the affected side, occupying the space vacated by atelectatic lung. Lower lobe atelectasis may also be associated with elevation of the ipsilateral hemidiaphragm. The borders of the atelectasis are sharply defined, and the opacity pattern typical of a particular lobe can be identified (see ▶ Fig. 4.22). Atelectatic lung parenchyma shows marked contrast enhancement on CT. The pulmonary vessels are crowded together and enhance with IV contrast medium due to continued perfusion of the atelectatic lobe.
Clinical features The clinical presentation is determined by the disease underlying the atelectasis. In patients with absorption atelectasis caused by a tumor, the main clinical findings are B symptoms (undesired weight loss, fever, night sweats) and cough. Intensive care patients with atelectasis may show decreased oxygenation due to intrapulmonary shunting. Patients with significant pleural effusion present mainly with dyspnea.
Differential diagnosis Pneumonic infiltrates are an important differential diagnosis but are more likely to produce a mass effect and a positive air bronchogram extending farther into the peripheral lung.
Key points Partial pulmonary atelectasis is common in intensive care patients as a result of retention of mucus (absorption atelectasis) or pleural effusion (compression atelectasis). Areas of atelectasis appear as sharply circumscribed opacities on the chest radiograph, and CT shows marked enhancement of the atelectatic lung parenchyma. Atelectasis in ambulatory patients requires exclusion of bronchial compression by an endoluminal or extraluminal tumor. Atelectasis in different lobes produces characteristic radiographic patterns with the displacement of adjacent structures.
4.3 Lung
4.3.1 Congenital Malformations
Malformations of the lung can be classified according to site of involvement as malformations of the lung parenchyma, bronchi, or vessels. Malformations and variants of the pulmonary vessels can in turn be classified by the affected vessels and type of anomaly (▶ Fig. 4.23). The entities overlap in diseases such as pulmonary sequestration and pulmonary artery aplasia.

Fig. 4.23 The spectrum of pulmonary vascular anomalies.
Malformations of the Lung
Symptoms common to lung malformations are dyspnea, cyanosis, failure to thrive, recurrent pneumonia, and hemoptysis. The clinical spectrum depends on the severity of disease and can range from onset of symptoms in adulthood to respiratory distress in the newborn.
Pulmonary Aplasia and Agenesis
Brief definition Pulmonary agenesis is a rare anomaly in which there is unilateral or bilateral absence of the lungs. Bilateral pulmonary agenesis is incompatible with postnatal life, but the majority of cases are unilateral. There is compensatory overinflation of the existing lung. The pulmonary artery is absent on the affected side. Associated cardiac anomalies are common, and tracheoesophageal fistula may be present.
Imaging signs The ipsilateral bronchus and pulmonary artery are absent. The mediastinum and heart prolapse toward the affected side. The affected hemithorax is smaller than the contralateral side, and many children will develop scoliosis. The chest radiograph shows opacity of the affected hemithorax with overinflation of the contralateral lung. CT or MRI can demonstrate the pulmonary agenesis (▶ Fig. 4.24, ▶ Fig. 4.25).
Clinical features Patients may be asymptomatic. Infants with a tracheoesophageal fistula exhibit dyspnea after nursing. Pulmonary arterial hypertension may develop and will determine the prognosis. Treatment is symptomatic. Fistulas are surgically repaired.

Fig. 4.24 Agenesis of the left lung. Chest radiograph shows complete opacity of the left hemithorax.

Fig. 4.25 Agenesis of the right lung. MRI shows the heart occupying the right hemithorax in a patient with right pulmonary agenesis.
Key points Pulmonary agenesis or aplasia is a rare anomaly. Bilateral agenesis is incompatible with postnatal life. In unilateral cases, possible pulmonary hypertension will determine the prognosis. The chest radiograph allows a presumptive diagnosis, which is confirmed by CT or MRI. The affected hemithorax is occupied by the heart and mediastinum. There is compensatory overinflation of the contralateral lung.
Cystic Adenomatoid Malformation of the Lung
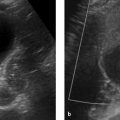
Brief definition Cystic adenomatoid malformation of the lung results from abnormal budding of the terminal bronchi early in the first trimester of pregnancy. This leads to an overgrowth of bronchial tissue, which, being derived from the terminal bronchioles, is devoid of cartilage. Alveoli are absent in the affected regions, which are occupied by cysts. There is no predilection for a particular lobe. The malformed tissue is usually confined to one lobe and may produce a mass effect causing compression of the esophagus and trachea and a mediastinal shift. Cystic adenomatoid malformation is frequently diagnosed at prenatal ultrasound. Malignant transformation with the formation of various types of sarcoma or bronchoalveolar carcinoma is known to occur, and therefore resection is the treatment of choice even for smaller lesions.
Imaging signs Cystic adenomatoid malformation of the lung appears on chest radiographs as a homogeneous opacity with smooth margins and no air bronchogram (▶ Fig. 4.26). Mediastinal shift may be apparent. The dysplastic bronchial structures may have a connection to the tracheobronchial tree, in which case the cysts can drain and may appear as ring shadows on chest radiographs. CT and MRI can demonstrate the cystic nature of the lesions. The ipsilateral lung may be hypoplastic.

Fig. 4.26 Cystic adenomatoid malformation of the left lower lobe. (a) Axial CT with a soft tissue window shows homogeneous opacity with smooth borders. (b) Lung window setting shows absence of an air bronchogram.
Clinical features Compression of the fetal esophagus may occur, leading to polyhydramnios. Compression of the ipsilateral lung leads to hyopoplasia of that lung. Approximately 50% of affected newborns exhibit respiratory distress. Recurrent infections may be the only symptom in children with smaller lesions.
Differential diagnosis
Lymphangioma additionally affects the neck as a rule. It can be traced in continuity from that region to the pulmonary apex, with extension into the mediastinum.
With a congenital diaphragmatic hernia, the diaphragm is not visualized and the gastric bubble is not found at its typical location.
Bronchogenic cysts can be very difficult to distinguish from cystic adenomatoid lung malformation and, when large, may produce the same set of symptoms. Resection is the treatment of choice for both entities.
Key points Cystic adenomatoid malformation of the lung results from abnormal budding and overgrowth of terminal bronchioles and leads to the formation of cystic dysplastic tissue that is usually confined to one lobe. The malformation may compress the ipsilateral lung parenchyma, leading to pulmonary dysplasia on that side. Compression of the trachea and esophagus may occur. Half of affected newborns exhibit respiratory distress. Imaging can demonstrate the cystic tissue and associated mass effect. The differential diagnosis should include congenital diaphragmatic hernia. The treatment of choice is resection.
Congenital Lobar Emphysema
Brief definition Congenital lobar emphysema refers to the overinflation of one pulmonary lobe or segment. Possible causes are a check-valve mechanism due to circumscribed bronchomalacia (a wall cartilage defect may lead to expiratory collapse with an obstructive check-valve mechanism), bronchial stenosis, or presence of a mass, or may be idiopathic. The left upper lobe is affected in 50% of cases, while the right upper and middle lobes each account for approximately 20% of cases.
Imaging signs The affected lung area is hyperlucent on the chest radiograph. Vascular markings are decreased (▶ Fig. 4.27). Pronounced overinflation may cause mediastinal shift and the atelectasis of adjacent, unaffected pulmonary segments.

Fig. 4.27 Congenital pulmonary emphysema in the apicoposterior segment of the left upper lobe.
Clinical features Due to the pathogenic mechanism described above, the disease becomes clinically apparent only with the onset of respiration after birth. In 25% of cases, dyspnea manifests postnatally with the onset of respiration. Approximately 50% of children manifest dyspnea and cyanosis during the first month of life. In milder forms of the anomaly, the diagnosis may be suggested by recurrent episodes of pneumonia during the first months of life. The treatment of choice is segmentectomy or lobectomy.
Differential diagnosis The identification of vascular markings in congenital lobar emphysema permits differentiation from pneumothorax and congenital cysts. Another important differential diagnosis is Swyer–James syndrome.
Key points Congenital lobar emphysema may result from a check-valve mechanism with inspiratory overinflation of the affected lobe or segment. The left upper lobe is affected in one-half of cases, and the right upper and middle lobes are each affected in 20%. The cause is usually a circumscribed cartilage defect in the bronchus to the affected lobe, destabilizing the bronchial lumen and leading to circumscribed bronchomalacia. Affected children show early symptom onset with dyspnea and cyanosis, generally enabling the condition to be diagnosed during the first months of life. Only a small percentage of patients have recurrent episodes of pneumonia as their dominant symptom. The treatment of choice is resection of the affected lobe.
Congenital Diaphragmatic Hernia or Diaphragmatic Defect
Brief definition Congenital diaphragmatic hernia refers to partial or complete congenital absence of the diaphragm. The left hemidiaphragm is affected in more than 90% of cases. The herniation of intestinal organs into the chest leads to pulmonary hypoplasia, which may also affect the contralateral side if the mediastinum is displaced and the right lung is also compressed. Today almost 70% of affected children survive the condition as a result of early treatment. If the lung volume is very small prenatally, the placement of a tracheal balloon by fetal surgery in the 26th week of gestation can raise the intrapulmonary pressure and stimulate lung growth. The balloon is removed a few weeks later. Reportedly, this procedure can increase survival rates by 30 to 40%. The incidence of the disease is approximately 1:4,000 births. The cause is still unknown but presumably involves a failure of closure of the pleuroperitoneal folds in the sixth week of gestation. Almost 50% of cases are diagnosed by prenatal ultrasound. The prognosis depends on the degree of pulmonary hypoplasia and the persistence of pulmonary hypertension in the newborn.
Imaging signs The herniation is detectable sonographically by approximately the 18th week of gestation. The ultrasound-determined ratio of head circumference to lung volume is useful in making a prognosis: The longest lung diameters are measured at the level of the cardiac four-chamber view. The two values are multiplied together and divided by the head circumference. If the result is less than 1, the prognosis for survival is poor (survival rate <30%) and current best practice is to proceed with fetal tracheal balloon occlusion. Prenatal MRI also enables volumetry of the lung. Postnatal chest radiography shows the presence of herniated abdominal viscera within the thorax (▶ Fig. 4.28).
Clinical features The degree of pulmonary hypoplasia determines the severity of postnatal respiratory distress. Because one-half of affected children have coexisting congenital heart disease, heart failure is common. The abdomen is scaphoid. Auscultation reveals absence of breath sounds in the left hemithorax, but intestinal sounds are audible in that region. Children with a small diaphragmatic defect may be initially asymptomatic.

Fig. 4.28 Congenital diaphragmatic hernia on the right side. The right hemithorax is filled with bowel loops.
Differential diagnosis With hypoplasia or aplasia of the lung, the diaphragm is intact. Postnatal chest radiography displays the gastric bubble below the diaphragm.
Key points Congenital diaphragmatic hernia is generally diagnosed by prenatal ultrasound and is detectable by the 18th week of gestation. The prognosis depends on the severity of pulmonary hypoplasia.
Pulmonary Sequestration
Brief definition Pulmonary sequestration results from an accessory lung bud and consists of aberrant lung tissue that lacks a normal connection with the bronchial tree. The sequestrum receives its blood supply from a systemic artery that usually arises from the descending aorta. Intralobar sequestrations, which account for 75% of all pulmonary sequestrations and do not have a separate pleura, are distinguished from extralobar sequestrations, which are enclosed within their own pleura. Extralobar sequestrations may also be infradiaphragmatic. Fistulas may be present between the esophagus and sequestered lung.
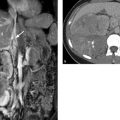
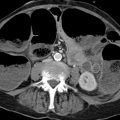
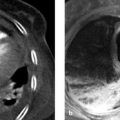
Imaging signs Sequestra are most commonly located in the left basal lung. The chest radiograph may show a well-circumscribed, partially lobulated opacity in the affected segment. CT or MRI can demonstrate the arterial supply. The sequestered parenchyma is usually not aerated, and fluid-filled cysts are typically present (▶ Fig. 4.29). The venous drainage of an intralobar sequestration usually occurs via the pulmonary veins. An extralobar sequestration drains via the azygos–hemiazygos system.
Clinical features Pulmonary sequestrations often contain cysts that gradually fill with mucus and may perforate into the tracheobronchial tree. This connection may then form a pathway for superinfection of the sequestered lung, manifested clinically by recurrent episodes of pneumonia. Due to the systemic arterial supply to the hypofunctioning tissue, recurrent hemoptysis may also occur. The treatment of choice is resection.

Fig. 4.29 Intralobar pulmonary sequestration on the right side. (a) Axial T1W image shows cysts filled with protein-rich fluid in the anomalous lung tissue (arrow). (b) Maximum intensity projection shows the large-caliber artery arising from the aorta.
Differential diagnosis
Infradiaphragmatic sequestra may be impossible to differentiate from other masses. Diagnosis in these cases must rely on postoperative histology.
A paravertebral sequestration requires mainly differentiation from neuroblastoma. The large-caliber supply artery is a key differentiating feature.
Key points Pulmonary sequestration is most commonly located in the posterior portion of the left lower lobe. The hallmark of pulmonary sequestration is a large supply artery arising from the aorta, which differentiates it from other masses. Resection is the treatment of choice for symptomatic cases with recurrent pneumonia and hemoptysis.
4.3.2 Infections
Pneumonia
Brief definition Pneumonia may be caused by a broad spectrum of infectious organisms that includes fungi and viruses in addition to classic bacterial pathogens. While viral pneumonias show an interstitial pattern of involvement, bacterial pneumonias spread in the alveolar air spaces and generally do not permit a specific diagnosis based on morphological imaging findings. A definitive diagnosis requires isolation of the causative organism from sputum or blood cultures. Pneumonias have three, somewhat different pathogenic mechanisms that involve different routes of spread:
Lobar pneumonia: This form is characterized by the spread of inflammation in the alveoli, to the alveolar duct, and to the terminal bronchioles as well as between alveoli through the pores of Kohn. Lobar pneumonia spreads in stages, all of which are rarely seen nowadays or occur in a mild form due to the early initiation of antibiotic therapy:
Congestion: The initial response is an exudation of protein-rich fluid into the alveolar space and an influx of monocytes.
Red hepatization: Capillary damage allows extravasation of red cells and fibrin into the alveoli; the parenchyma becomes heavy and grossly resembles liver tissue in its color and consistency.
Gray hepatization: Within a few days the red cells are phagocytosed; the lung tissue becomes dry and grayish, and gray hepatization is achieved. Perfusion is maintained during these stages and is not diminished. Because the alveolar space is filled with inflammatory cells and debris and can no longer participate in gas exchange, nonoxygenated blood is shunted into the systemic circulation, and hypoxemia develops.
Yellow hepatization: In the last stage the phagocytosing granulocytes undergo purulent transformation and the tissue inflammation resolves.
Bronchopneumonia: The inflammation in bronchopneumonia spreads along terminal and respiratory bronchioles to the alveoli. This leads to the multifocal spread of infiltrates, creating a patchy pattern of involvement. There is no lobar predilection.
Interstitial/atypical pneumonia: This type of pneumonia is caused by viruses, the fungus Pneumocystis jiroveci, or Rickettsia bacteria and involves the interstitium. Because the alveoli are spared, the infiltrate does not follow a typical pattern, hence the alternate term “atypical pneumonia.”
Note
Classic lobar pneumonia is very rare today owing to early antibiotic therapy. Streptococcus pneumoniae and Haemophilus influenzae are the principal causative organisms of lobar pneumonia.
The differentiation between community-acquired pneumonia and nosocomial pneumonia is clinically relevant:
Nosocomial pneumonia: This term is applied to pneumonia that was not incubating on admission and develops more than 48 hours after hospitalization. Pneumonia that develops several weeks or months after hospitalization is also classified as nosocomial because colonization by hospital organisms is still demonstrable at that time. Current guidelines do not specify a time limit, but 4 to 6 weeks is generally accepted. Nosocomial infections are usually mixed infections, the most common organisms being Pseudomonas aeruginosa, Enterobacteriaceae (Escherichia coli, Klebsiella spp., Enterobacter spp.), Haemophilus influenzae, Acinetobacter baumannii, and Stenotrophomonas maltophilia. Foremost among the gram-positive organisms that cause nosocomial pneumonia are Staphylococcus aureus and Streptococcus pneumoniae. The incidence of nosocomial pneumonia is 5 to 15 per 1000 ventilation days. 3 The mortality rate in ventilated patients is 20%.
Community-acquired pneumonia: This refers to pneumonia occurring in immunocompetent patients who have not been hospitalized. The main causative organisms are Streptococcus pneumoniae, Mycoplasma pneumoniae, and Haemophilus influenzae.
Pneumonia in immunocompromised patients: This is a separate category with a different spectrum of causative organisms. Opportunistic organisms such as Pneumocystis jiroveci and cytomegalovirus are predominant. Immunocompromised status may result from chemotherapy for solid or hematological malignancies, HIV infection in the AIDS stage, previous organ or bone marrow transplantation, immunosuppressant therapy for autoimmune disease, or at least 4 weeks of corticosteroid therapy at a maintenance dose of at least 10 mg/day.
Selection of imaging modalities Chest radiography is sensitive in the diagnosis of clinically suspected pneumonia because of the sharp contrast between pneumonic infiltrates and healthy lung, and it provides reasonable confidence in the assessment of therapeutic response.
Note
One of the most common indications for chest radiography is for evaluating the presence and extent of infiltrates in patients with suspected pneumonia. Chest radiography detects infiltrates with a sensitivity of 70% but is inferior to CT in patients with subtle findings (sensitivity 100%).
Low-dose CT can be used in cases where it is necessary to detect subtle findings or incipient infiltrates, as in immunocompromised patients. “Positive air bronchogram” refers to the visualization of still-aerated bronchi within an infiltrated region. MRI has proved equivalent to CT in several studies, as infiltrates visualized with T2W sequences are very hyperintense to unaffected tissue, which is almost devoid of signal due to its aeration. Additionally, MRI can detect interstitial edema and ground-glass opacity with the same sensitivity as CT. MRI has not yet become established in routine clinical settings, however, due to its longer scan times and more limited availability.
Imaging signs Imaging findings for specific types of pneumonia:
Lobar pneumonia: homogeneous opacity of the affected lobe or segment. Bronchi that are still aerated appear as well-defined lucencies within the opacity (▶ Fig. 4.30).
Bronchopneumonia: focal opacities that coalesce in severe cases. The bronchial walls are thickened, as demonstrated particularly well by bronchi viewed end-on in the frontal radiograph and on CT (▶ Fig. 4.31). CT in bronchopneumonia shows centrilobular opacities, which may also coalesce. Vessels are no longer visible in areas with confluent infiltrates.
Interstitial pneumonia: the intralobar septa are thickened in this type of pneumonia. Enlargement of hilar lymph nodes is very rarely seen. With proper antibiotic therapy, the infiltrates will regress in 50% of patients within 2 weeks, in approximately 70% of patients by 4 weeks, and in 80% by 6 weeks. Infection with the fungus Pneumocystis jiroveci is characterized by ground-glass opacities (▶ Fig. 4.32), which often spare a narrow strip beneath the pleura. Generally the lymph nodes are not enlarged. Thickening of the interlobular septa is evident in up to 40% of patients.

Fig. 4.30 Lobar pneumonia of the right lower lobe. Positive air bronchogram.

Fig. 4.31 Bronchopneumonia. (a) Chest radiograph shows patchy infiltrates. (b) CT shows thickening of the bronchial walls. The infiltrates are distributed around the bronchi as evidence of bronchogenic spread.

Fig. 4.32 Pneumocystis jiroveci pneumonia. (a) Chest radiograph shows low-density infiltrates. (b) CT shows ground-glass opacities with subpleural sparing.
Bacterial pneumonia as well as bronchial stenosis may be associated with abscess formation. Extrapulmonary abscesses may also spread contiguously to the lung. The abscess can be seen on chest radiographs only if it communicates with the tracheobronchial tree and an air crescent is visible in the abscess cavity. As in other organs, CT shows a nonenhancing area of liquefaction (▶ Fig. 4.33).

Fig. 4.33 Lung abscesses in pneumonia.
Clinical features Typical symptoms are fever, productive cough, and audible crackles. Laboratory tests show a left shift, elevated C-reactive protein, and leukocytosis.
Differential diagnosis Pulmonary venous congestion is the most important radiological differential diagnosis, especially in supine radiographs obtained in ICU patients.
Septic Emboli
Brief definition Septic pulmonary embolism refers to the hematogenous spread into the lungs of thrombi that contain microorganisms (usually Staphylococcus aureus). The infectious particles may originate from sources such as valvular endocarditis, a superinfected central venous catheter or port system, or IV drug abuse. The thrombi remain lodged in the peripheral vessels. An infiltrate forms initially, which then liquefies within a few days to form a small cavity. Treatment consists of IV antibiotics and eradication of the source.
Imaging signs The chest radiograph shows multiple faint, rounded opacities with or without cavitation. They occur predominantly in the peripheral and basal lung. CT can often reveal the relationship of the emboli to blood vessels (▶ Fig. 4.34).

Fig. 4.34 Septic pulmonary emboli. (a) Solitary foci show central liquefaction (arrow). (b) The peripheral location of the emboli (arrow) in proximity to blood vessels is typical.
Clinical features Patients are febrile and show laboratory signs of inflammation.
Key points Septic pulmonary emboli most commonly occur in the peripheral lung. The foci cavitate within a short time. CT can document proximity to vessels.
Tuberculosis
Primary Tuberculosis
Brief definition Tuberculosis is an infection with aerobic gram-positive organisms of the genus Mycobacterium. The causative organisms are, in descending order of frequency, M. tuberculosis, M. bovis (transmissible by cattle, especially in countries without compulsory pasteurization of milk, such as Asia), M. africanum (lymph node involvement), and M. microti. The 2013 WHO report states that in 2012 an estimated 8.6 million people worldwide developed tuberculosis and 1.3 million died from the disease. Endemic regions are Asia, Africa, and the countries of the former Soviet Union. Multidrug-resistant strains no longer sensitive to the standard antibiotics rifampicin and isoniazid are becoming more widespread in these regions. In extremely drug-resistant (XDR) tuberculosis, the bacteria are also resistant to many second-line antibiotics. Initial diagnosis is by light microscopic examination with Ziehl–Neelsen stain. If this does not detect acid-fast rods (i.e., rods that retain stain after washing in an acid solution), a bacterial culture should be grown. Culture takes approximately 4 weeks due to the slow replication of mycobacteria. A primary infection denotes initial contact with tuberculosis before antibodies have been developed. Pulmonary tuberculosis is acquired by droplet inhalation, which often occurs in childhood. This stage is asymptomatic in immunocompetent patients or may present with symptoms of a mild cold. The mycobacteria are phagocytosed in the alveolar space to form a Ghon focus, a caseating granuloma that contains mycobacteria at its center. Transport to the regional (hilar) lymph nodes leads to hilar lymphadenopathy with enlargement of the hilar nodes. The Ghon focus and associated lymphadenitis are called the primary complex (also called the Ranke complex). In immunocompetent individuals, the primary complex heals by fibrosis and may calcify. Viable bacteria remain walled-off within the healed focus and may be reactivated years or even decades later due to a weakened immune status. This can lead to bronchogenic spread of the infectious organisms and the development of pneumonia.
Caution
Primary pulmonary tuberculosis is very rarely detected due to its mild clinical presentation in immunocompetent individuals (absence of symptoms, or symptoms of a slight cold).
Imaging signs Imaging findings consist of a faint infiltrate in the lower or middle lobe or, less commonly, in the perihilar portions of the upper lobe and hilar lymphadenopathy on the ipsilateral side (▶ Fig. 4.35).

Fig. 4.35 Primary tuberculosis in a 7-year-old girl. (a) Frontal chest radiograph shows enlarged lymph nodes. (b) Hilar and mediastinal lymphadenopathy. (c) Primary infiltrate in the upper lobe.
Postprimary Tuberculosis
Brief definition Postprimary tuberculosis may follow the primary infection and is based on hematogenous dissemination of the causal organisms, which may spread to almost all organs in the body including the lung.
Imaging signs Postprimary tuberculosis commonly affects the upper lobe or the apical segment of the lower lobe (▶ Fig. 4.36), where ventilation is good and there is less perfusion than in other lung areas. Hilar lymphadenopathy is absent in immunocompetent patients but is generally present in AIDS. Cavitation is typical and occurs in half of all patients. The tree-in-bud pattern on CT is characteristic of bronchogenic spread. Tuberculosis may also be manifested as pleurisy; this condition is unilateral, it is not associated with infiltrates or lymphadenopathy, and its imaging appearance is indistinguishable from that of pleural effusion due to other causes. Postprimary tuberculosis often heals by scarring with upward retraction of the hila (▶ Fig. 4.37).

Fig. 4.36 Postprimary tuberculosis with typical upper lobe involvement. (a) Chest radiograph demonstrates a cavity in the infiltrated upper lobe. (b) CT shows communication with the tracheobronchial tree.

Fig. 4.37 Healed tuberculosis. Chest radiograph shows typical upward retraction of the hila.
Clinical features Patients may present with B symptoms, chronic cough, chest pain, and hemoptysis.
Differential diagnosis Postprimary tuberculosis with cavitation requires differentiation from adenocarcinoma and lung abscess. Miliary tuberculosis is a subtype of postprimary tuberculosis that occurs in immunocompromised patients. It is characterized by innumerable fine nodules 1 to 2 mm in diameter distributed throughout the lung (▶ Fig. 4.38).

Fig. 4.38 Miliary tuberculosis. (a) Chest radiograph shows numerous fine nodules distributed throughout the lung. (b) Centrilobular nodules on axial CT.
Related posts:
Stay updated, free articles. Join our Telegram channel

Full access? Get Clinical Tree


