Lung Cancer
Vicky Goh
Peter Hoskin
Lung cancer is the most common cause of cancer mortality worldwide. In the United States, approximately 226,160 newly diagnosed cases of lung cancers were predicted for 2012, with 160,340 lung cancer associated deaths.1 Histologically, there are four main types of lung cancer: squamous carcinoma, adenocarcinoma, small cell carcinoma, and large cell carcinoma. For treatment purposes, squamous carcinoma, adenocarcinoma, and large cell carcinoma are taken together as non–small cell carcinoma (NSCLC), making up 85% of lung cancers. Worldwide there has been a decline in small cell carcinoma, but the incidence of adenocarcinoma has increased above that of squamous carcinoma, for example, in Japan and the United States.
The growth and spread of a lung tumor depends on its pathologic subtype. Adenocarcinoma is the slowest growing lung cancer and may be present as peripheral lung lesions sometimes for years prior to diagnosis. Squamous and large cell tumors are more rapidly growing, invading locally initially with later metastatic spread, commonly starting via the regional lymphatics. Small cell carcinoma disseminates early beyond the thorax. In terms of spread lymphatic involvement, it tends to start at the ipsilateral hilum, then subcarinal area, followed by paratracheal and contralateral mediastinal nodes and then supraclavicular nodes. The most commonly involved distant metastatic sites are the adrenal glands, liver, bone, contralateral lung, and brain.
Current treatment options for NSCLC include radical surgery or radiotherapy for early stage disease, with or without adjuvant therapy, chemoradiotherapy for locally advanced disease, and palliative chemotherapy for metastatic disease. Nevertheless, outcome for NSCLC remains bleak, with overall 5-year survival ranging from 70% in early stage (operable) disease to less than 5% in advanced (inoperable) disease.2 The primary therapeutic approach for small cell lung cancer is systemic chemotherapy. In recent years, manipulation of the tumor vasculature has emerged as a promising therapeutic strategy, and angiogenic inhibitors are now available for lung cancer. For example, the monoclonal antibody to vascular endothelial growth factor, bevacizumab, has now been shown to improve response rates and survival (12.3 vs. 10.3 months; p = .003 median overall survival) when combined with chemotherapy alone (carboplatin/paclitaxel) in the first-line treatment of advanced non-squamous NSCLC.3
Conventional Imaging Assessment of Lung Cancer
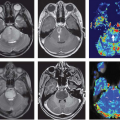
Conventional imaging plays a central role in the characterization of lung lesions, diagnosis and staging, therapeutic assessment, and surveillance of lung cancer. Plain radiographs, computed tomography (CT), magnetic resonance imaging (MRI), endobronchial or endoluminal ultrasound, and positron emission tomography (PET)-CT are part of the diagnostic algorithm in patients with suspected lung cancer (Fig. 62.1).4
Nevertheless, conventional imaging has its limitations. For example, contrast enhanced CT is most widely performed for therapy response assessment and relies on changes in tumor size to determine response (most commonly using Response Evaluation Criteria in Solid Tumors criteria.5 However, this may be poor at predicting early response (because of the lag in tumor shrinkage, which is generally seen late in the course of treatment). This may also be relatively poor at assessing response to novel therapeutic agents that are cytostatic rather than cytoreductive.6,7,8 Postradiotherapy, the associated inflammatory and fibrotic changes in the adjacent lung parenchyma following radiotherapy may also confound response assessment, and in this scenario, fluorodeoxyglucose (FDG) PET-CT has a role in response assessment.
Dynamic Contrast Enhanced Techniques in Lung Cancer
Rationale for Functional Vascular Imaging
Dynamic contrast-enhanced imaging combines functional assessment of the vasculature with excellent anatomical detail and may be incorporated easily into standard imaging protocols. Contrast enhancement in tumors using low molecular weight contrast agents (<1 kDa) reflects the rate of delivery to the tumor, tumor vascular volume, vascular leakage, diffusion back into the intravascular space, as well as recirculation and subsequent excretion (mainly via the renal route). Both qualitative and quantitative information can be obtained from the temporal changes in Hounsfield unit attenuation with CT and gadolinium concentration with T1-weighted MRI in blood vessels and tissue (Table 62.1).
 FIGURE 62.1. Schema showing the imaging workup of suspected lung cancer. EBUS/EUS, endobronchial/endoluminal ultrasound; FDG PET/CT, positron emission tomography/computed tomography; MRI, magnetic resonance imaging. |
TABLE 62.1 COMPARISON of DYNAMIC CONTRAST-ENHANCED COMPUTED TOMOGRAPHY AND MAGNETIC RESONANCE IMAGING TECHNIQUES | ||||||||||||||||||||||||||||||||||||
|---|---|---|---|---|---|---|---|---|---|---|---|---|---|---|---|---|---|---|---|---|---|---|---|---|---|---|---|---|---|---|---|---|---|---|---|---|
| ||||||||||||||||||||||||||||||||||||
With CT this includes regional blood flow (blood flow per unit volume or mass of tissue), regional blood volume (the proportion of tissue that is comprised of flowing blood), and flow-extraction product (the rate of transfer of contrast agent from the intravascular to extravascular space) from which the permeability-surface area product (the product of permeability and total surface area of capillary endothelium in a unit mass of tissue) can be derived. With MRI this includes transfer constant (Ktrans; volume transfer constant between blood plasma and the extravascular-extracellular space), rate constant (flux rate constant between the extravascular-extracellular compartment and blood plasma), volume (fraction) of the extravascular extracellular space (per unit volume), and volume (fraction) of the plasma space (per unit volume). The measures derived from CT and MRI reflect a similar physiology, but there may be subtle differences in individual parameters. For example, both flow-extraction product and Ktrans reflect the rate of transfer of contrast agent from the intravascular to extravascular space, but for FE this is modeled from whole blood, while for Ktrans this is modeled from blood plasma only.
By reflecting angiogenesis and perfusion, dynamic contrast-enhanced techniques may improve lesion characterization, tumor phenotyping, and prognostication at presentation and therapy response assessment.
Tumor Angiogenesis
Lung tumors can be supplied by the bronchial and pulmonary circulation. This is predominantly a bronchial supply for centrally located tumors; however, peripherally located tumors may have a predominant pulmonary arterial supply. Development of a viable blood supply is essential for tumor growth, tumor proliferation, and metastasis.9 This occurs through sprouting from pre-existing vessels or vasculogenesis, de novo vascular formation through recruitment of circulating endothelial progenitor cells. The initiation of tumor angiogenesis can be triggered by the activation of oncogenes and inactivation of tumor suppressor genes, and it is influenced by the tumor microenvironment: hypoxia, glucose deprivation, and low pH can lead to the initiation of angiogenesis.10
Pro-angiogenic factors that have been described in lung cancer include vascular endothelial growth factor (VEGF), acidic and basic fibroblast growth factors, platelet-derived growth factor, angiopoietins (Ang-1 and Ang-2), epidermal growth factor, placental growth factor, interleukin-8, integrins, and tumor necrosis factor-α. Naturally occurring inhibitors of angiogenesis include thrombospondin-1, angiostatin, endostatin, transforming growth factor β, and tissue inhibitor of metalloproteinase-1, −2, and −3.
The tumor vasculature is morphologically and functionally distinct and spatially heterogeneous. Tumor vessels are thin and tortuous, characterized by a relatively high endothelial cell proliferation rate, incomplete endothelium, relative absence of smooth muscle or pericyte investiture, and hyperpermeability resulting in high interstitial fluid pressure. As a consequence, malignant lesions may appear more vascular, although this will be heterogeneous in distribution.
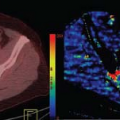
Microvessel density (MVD) is a commonly used immunohistologic measure of angiogenesis. In patients with operable NSCLC, significant associations have been found between high MVD count and VEGF overexpression (Fig. 62.2).11,12 Nevertheless, the lack of standardization in the methods used for the estimation of MVD reported in the literature significantly limits its role as a prognostic marker in NSCLC. Two systematic reviews of MVD as a prognostic marker in NSCLC have produced conflicting results.13,14 There are also issues with sampling error due to the underlying spatial heterogeneity of the vasculature.
Dynamic Contrast-Enhanced Techniques as a Biomarker for Angiogenesis and Hypoxia
Dynamic contrast-enhanced (DCE) imaging techniques have been suggested as a reliable biomarker of tumor angiogenesis in NSCLC, because they can reflect both perfusion (and conversely hypoxia) and angiogenesis. Using CT, peak enhancement in patients with solitary pulmonary nodules has been correlated significantly with both MVD and VEGF, irrespective of the benign or malignant nature of the nodules.15 In patients with operable NSCLC, CT peak enhancement, blood flow, blood volume, and permeability surface area product have been shown to correlate significantly with MVD.16,17,18 Li et al.16 showed that CT perfusion correlated with CD34 expression (r = 0.715; p = <.001) assessed in six tumor regions: three in the central region, three peripheral. Ma et al.17 showed that CT peak enhancement and blood flow correlated with CD34 expression assessed in five hotspots in VEGF-positive but not VEGF-negative tumors. Peak enhancement, blood flow, and relative blood volume have also been shown to be significantly higher in VEGF-positive compared with VEGF-negative tumors.17,18,19 Blood volume measurements have also been found to be negatively correlated to markers of hypoxia (pimonidazole; r = − 0.48; p = .004).20 Nevertheless, one of the challenges of clinicopathologic correlative studies is the comparison of in vivo with ex vivo findings. Tacelli et al.21 have shown that areas of low regional tumor blood volume but high Ktrans have higher CD34 expression (assessed in three hotspots in the nonnecrotic tumor portion) than areas of high regional tumor blood volume and high Ktrans (72.1 vs. 47.9, p = .038), which they postulated could be related to the degree of tumor interstitial pressure.
Using MRI, maximum peak signal intensity obtained using an MRI acquisition of every 10 seconds for 4 minutes after intravenous gadolinium injection in 36 patients with solitary pulmonary nodules (56% malignant) was positively
correlated with CD34 expression at the tumor margin (r = 0.49; p = .03).22 Similarly, maximum enhancement ratio and slope of the signal intensity time curve, obtained with a low temporal sampling protocol (0, 1, 2, 3, 4, 5, 6, and 8 minutes after intravenous gadolinium injection) in patients with a peripheral pulmonary carcinoma was positively correlated with CD34 expression.23
correlated with CD34 expression at the tumor margin (r = 0.49; p = .03).22 Similarly, maximum enhancement ratio and slope of the signal intensity time curve, obtained with a low temporal sampling protocol (0, 1, 2, 3, 4, 5, 6, and 8 minutes after intravenous gadolinium injection) in patients with a peripheral pulmonary carcinoma was positively correlated with CD34 expression.23
 FIGURE 62.2. Histologic images of a squamous cell carcinoma (A) and adenocarcinoma (B) showing hematoxylin and eosin (left panel) and CD34 (right panel) staining: microvessels demonstrate CD34 brown stain. |
DCE-MRI parameters can also reflect angiogenesis detected by other imaging modalities. In a small study that included 13 patients with locally advanced or metastatic NSCLC, DCE-MRI initial area under the curve was shown to have a moderate positive correlation with PET 18F-galacto-RGD (reflecting alphavbeta3 expression), and also 18F-FDG (reflecting glucose metabolism and downstream marker for angiogenesis) in selected tumor areas (derived via cluster analysis) but not for the whole tumor due to the heterogeneity of expression and PET uptake.24
DCE-MRI parameters can also reflect VEGF expression. The relation between DCE-MRI parameters and VEGF-A expression has been studied in a preclinical murine lung cancer xenograft model.25 Different isoforms of VEGF-A may be found in tumors including VEGF-121, VEGF-165, and VEGF-189: tumor angiogenesis induced by these isoforms can have different vascular characteristics that are reflected by DCE-MRI Ktrans. Tumors overexpressing VEGF-189 versus VEGF-161 and VEGF-121 demonstrated the greatest perfusion and vascular leakage extending to the tumor core by day 35 compared with other isoforms.25
 FIGURE 62.3. Axial contrast-enhanced magnetic resonance imaging (MRI) (A) and contrast-enhanced computed tomography (CT) images (B, mediastinal windows; C, lung windows) in a patient with a poorly vascularized non–small cell lung cancer demonstrating a higher contrast-to-noise ratio may be achieved with MRI than CT. |
Technical Considerations
There are challenges for MRI for thoracic imaging including the relative low signal related to low proton density of air-filled lungs, susceptibility artifacts related to the air–tissue interfaces, and motion artifacts related to respiration and cardiac pulsation. Compared to CT, it has higher contrast and does not impose a radiation burden (Fig. 62.3). Contrast enhancement can be assessed dynamically with CT and MRI using a low temporal sampling technique (>5 seconds between CT acquisitions or >10 seconds between MRI acquisitions), with qualitative assessment of the contrast enhancement time curve (shape, peak enhancement, enhancement ratio, washin and washout rate), or by a high temporal sampling technique (1 to 2 seconds between acquisitions) and subsequent quantitative assessment via kinetic modeling of the temporal changes in tumor enhancement, allowing more physiologically related parameters to be assessed.26,27
Changes in enhancement or signal intensity can be rapid after contrast injection, and measurement accuracy relies on the ability of the technique to model the pharmacokinetics of the tracer. Increasing the temporal sampling rate of MRI requires a tradeoff with spatial resolution, the signal-to-noise ratio, and volume of coverage. This is an advantage of CT over MRI. Using a high temporal sampling technique (<2 seconds between acquisitions), a large volume coverage can be achieved (>16 cm), with good spatial resolution. A comparative protocol with MRI would afford coverage on the order of 1 to 2 cm. With CT, this enables whole tumor evaluation or evaluation of multiple target lesions in the lungs, thus improving clinical applicability.
Different kinetic models can be applied, which should be matched to the frequency of data acquisition. For example, with high temporal sampling DCE-CT acquisition, a deconvolution approach can be appropriate and is provided by some of the major CT manufacturers in their software platforms (GE and Siemens Healthcare; Fig. 62.4). With T1 DCE-MRI, a study comparing kinetic models of increasing complexity in the lung (classical Kety, modified Kety, and adiabatic approximation of the tissue homogeneity model in the time domain),28 with a 4-second temporal resolution, found that the latter model was the most appropriate for a lung tumor as opposed to the modified Kety model for normal lung parenchyma: the 4-second temporal resolution was insufficient to separate flow and contrast agent leakage for normal lung parenchyma.26
Related posts:


Stay updated, free articles. Join our Telegram channel

Full access? Get Clinical Tree


