Lung Cancers
Steve Jiang
Loren Mell
Ajay Sandhu
Treatment of lung cancer is a formidable challenge. Even patients presenting with disease localized to the thorax generally have poor long-term survival and disease control. In-field recurrences are common, despite the use of concurrent chemotherapy and increasing doses of radiation. Although tumor biology likely influences the aggressive clinical course of most lung cancers, targeting inaccuracies and tumor motion also may cause geographical miss, resulting in poor locoregional control with radiotherapy. Second, the tolerance of normal tissues, such as esophagus and normal lung, limits the dose of radiation that can be delivered to the tumor. Image-guided radiation therapy (IGRT) technologies improve target delineation, targeting uncertainties, and tumor motion management, and permit dose escalation and/or reduced normal tissue dose, which ideally will lead to improved treatment outcomes.
Historically, targeting uncertainties and crude delivery techniques mandated that primary lung cancers and/or their draining lymph nodes be treated with large “swaths” of high-dose radiotherapy. Within this high dose, the large majority of tissue volume constituted frankly normal tissue at low risk of tumor infiltration. As such, there should be little wonder that conventional lung cancer treatments have been fraught with toxicity both decreasing quality of life and limiting possibilities for dose escalation or combining therapies. The targeting uncertainties for lung cancer treatment draw mostly from both regular and irregular tumor motion relating to respiratory physiology as well as uncertainties in accurate identification of tumor location within a complex anatomy.
TARGET DELINEATION BASED ON BIOLOGIC IMAGING
The major functional imaging modality currently used in lung cancer staging and targeting is [18F]fluorodeoxyglucose ([18F]FDG) positron emission tomography (PET). PET is now considered standard in the imaging workup of most lung cancers. [18F]FDG-PET significantly improves lung cancer localization compared with CT alone,1, 2, 3, 4, 5 identifying additional sites of distant and subclinical metastatic spread in up to 30% of patients,3,6 which enables better selection of patients for appropriate therapy. More importantly, given the high negative predictive value of PET, areas not involved by cancer may be prudently spared inclusion within the high-dose volume.7 PET is also invaluable for radiotherapy target delineation, especially in non-small-cell lung cancer (NSCLC), where it may alter treatment volumes in 25% to 50% of patients.8,9
Many studies have investigated the role of [18F]FDG-PET in radiotherapy planning for NSCLC.10, 11, 12, 13, 14, 15 A prospective analysis in NSCLC10 showed that [18F]FDG-PET significantly changed gross tumor volume (GTV) and planning target volume (PTV) in the majority of patients. PET also affects treatment planning parameters, such as the lung volume receiving >20 Gy (V20),16 and improves interobserver volume definition for radiotherapy planning.13 Practically, PET-guided target delineation is typically achieved by fusing a diagnostic PET or PET/computed tomography (CT) image with the planning CT. Alternatively, PET/CT simulation has been implemented at some institutions.16
An established application of PET is in conjunction with CT imaging for contouring the nodal GTV. Nodal regions are generally delineated on a CT using mediastinal windows. The threshold for tumor detection with [18F]FDG-PET is approximately 5 to 10 mm, so PET may not identify the full extent of disease. Whether lymph node regions that are negative by mediastinoscopy and appear normal on PET or CT should be treated electively in patients with NSCLC is controversial. However, a large study found that omitting elective nodal irradiation does not result in a high incidence of isolated nodal failures outside the GTV.17
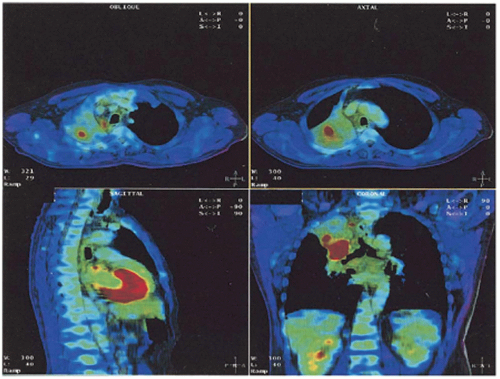
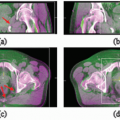
PET may also be useful in the delineation of the primary tumor.18 For example, [18F]FDG-PET is helpful in distinguishing tumor from atelectasis10,11 (Fig. 11.1), although inflammation may result in false-positive results due to nonspecific abnormal FDG uptake. Standardized uptake value (SUV) thresholds have been proposed to guide tumor demarcation, such as SUV >2.519 or >40% to 50% of the maximum SUV, but the universal validity of such thresholds is unclear.20 Parallel to the development of four-dimensional (4D) CT and 4D cone beam CT (CBCT), 4D PET imaging has recently emerged as an effective method for obtaining phase-resolved metabolic information.21, 22, 23 It is important to note that 4D PET not only provides tumor motion information, but also allows more accurate SUV calculation because of improved definition of the tumor target volume and activity distribution.23
BIOLOGICALLY BASED DOSIMETRY (DOSE PAINTING)
In theory, the SUV could even be used as a basis for prescribing heterogeneous doses within the primary tumor (i.e., to a
biologic tumor volume). However, in addition to indicating malignancy, the SUV depends on a host of other factors, including tumor motion and technical differences in image acquisition and processing.20,23 Incorporation of biologic imaging data into IMRT treatment is an active area of research.24, 25, 26, 27 Presently, a substantial element of clinical judgment is needed to tailor target volumes appropriately to the individual patient and clinical situation.
biologic tumor volume). However, in addition to indicating malignancy, the SUV depends on a host of other factors, including tumor motion and technical differences in image acquisition and processing.20,23 Incorporation of biologic imaging data into IMRT treatment is an active area of research.24, 25, 26, 27 Presently, a substantial element of clinical judgment is needed to tailor target volumes appropriately to the individual patient and clinical situation.
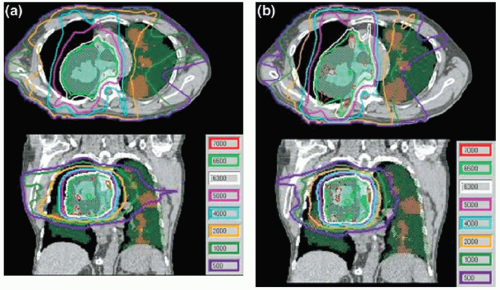
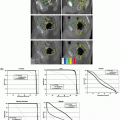
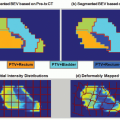
A few studies have explored other applications of functional imaging in lung cancer. Rasey et al.28 showed that [18F]fluoromisonidazole PET is useful for detecting hypoxia in a variety of cancers and that the hypoxic fraction (median, 47%) could be consistently quantified in lung tumors. Technetium-99m single-photon emission CT (SPECT) has been used successfully to identify functioning regions of lung for avoidance using IMRT planning (Fig. 11.2).29, 30, 31, 32 Generally, the V10 or V20 of functioning lung and other lung dose-volume parameters can be reduced using SPECT-guided conformal radiotherapy, without compromising PTV coverage.
Although such biologic targeting is still not commonly used in the clinic, the application of such information (if valid) may be dramatic. In such a case, the dose of radiation could be heterogeneously distributed or “painted” such that higher dose correlated to tissues where tumor recurrence was more likely. Likewise, dose painting might remove dose from areas with lower risk of involvement or higher risk of toxicity. Dose painting would be potentially facilitated by a variety of technologic innovations, including IMRT or even scanning pencil beams.24, 25, 26, 27 At any rate, dose painting in response to patient-specific assessments or imaging would constitute a truly adaptive radiotherapy approach.
THREE-DIMENSIONAL MOTION ASSESSMENT
The purpose of simulation is to acquire patient image data and to build a reference patient geometric model for treatment planning. The patient model consists of models for all organs at risk and, importantly, a model for the target. Generally, CT imaging is the primary platform for creating these simulation models because of its reliable spatial accuracy and straightforward correlation of tissue density to Hounsfield units for radiation attenuation and scattering calculations. Significant organ motion is a hallmark of lung tumors and normal tissues within the thorax. This organ motion perturbs the ultimate dose deposition and must be handled carefully, especially if treatment fields are designed with small margins. Motion artifacts in radiotherapy are significant because, unlike diagnostic scans, treatment planning scans in the thorax and abdomen are commonly performed as the patient breathes freely.
The average speed of lung and liver tumors is on the order of 1 cm/s. This is estimated by assuming that the peak-topeak motion amplitude is approximately 2 cm and the breathing period is approximately 4 seconds. Depending on the scanning speed along the patient long axis relative to the tumor motion speed, there are three types of motion artifacts,
characterized in terms of the displacement of the tumor mean position and the distortion of the tumor shape.
characterized in terms of the displacement of the tumor mean position and the distortion of the tumor shape.
If the scanning speed is much slower compared to the tumor motion speed, we capture a smeared tumor image, where the tumor mean position is quite accurate but the tumor shape is enlarged along the motion directions. This was the case in the past when the scanner was very slow. Some radiation oncology professionals still reduce the scanning speed to obtain a smeared image for the purpose of designing the internal target volume (ITV). We do not recommend this technique for defining ITV because the CT number in the smeared area is hard to interpret and the ITV boundary is hard to determine. This is similar to a PET scan, which takes about 20 minutes and generates a smeared target image with SUVs that are hard to interpret.
If the CT scanning speed is much faster than the tumor motion speed, then we capture the target position and shape at an arbitrary breathing phase, like a snapshot. The tumor shape is accurately captured; however, its mean position is displaced. This might be the case when using some very high-speed multislice fan or CBCT scanners in the future.
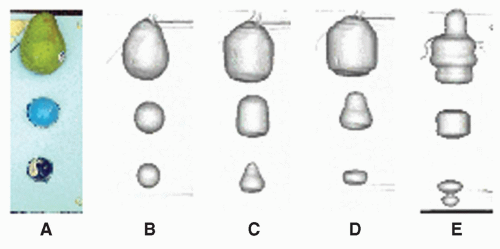
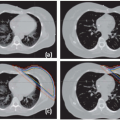
If the scanning speed is comparable with the tumor motion speed, which is the case with most currently available helical CT scanners, both the captured tumor mean position and shape can be heavily distorted. This scenario has been carefully reviewed by Chen et al.33 Based on an experiment (as shown in Fig. 11.3) and computer simulations, they concluded that distortions along the axis of motion could result in either a lengthening or shortening of the target. In addition to shape distortion, the center of the imaged target can be displaced by as much as the amplitude of the motion.
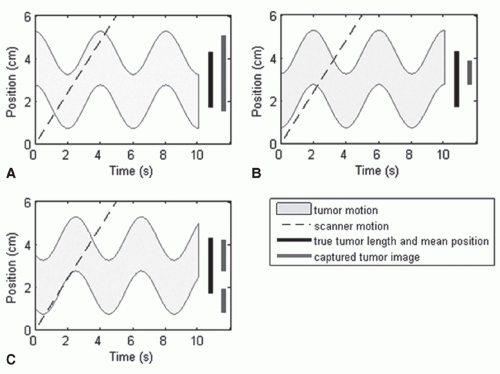
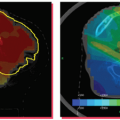
Among the three scenarios mentioned in the list, the third one is the worst and the most relevant to current clinical practice. Recently, Lewis and Jiang34 presented a theoretical model that explains the source of motion artifacts and the relationship between motion artifacts and motion parameters of the scanner and of the tumor, as shown in Figure 11.4. It was shown that an understanding of the relationship between the scanning speed and the maximum tumor velocity might enable one to mitigate certain types of motion artifacts. Lewis and Jiang34 found that splitting artifacts can be eliminated if the scanning speed is above the maximum tumor velocity. Slow scanning speeds were shown to be useful for obtaining accurate ITVs, and fast scanning speeds were shown to be useful for obtaining accurate tumor shapes. In both cases, an upper bound on the maximum possible error was calculated as a function of the scanning speed. A set of special scanning speeds that allow for an accurate representation of tumor shape along the craniocaudal direction were obtained, and a relationship between the maximum displacement of the tumor mean position and the magnitude of its shape distortion was derived.
FOUR-DIMENSIONAL COMPUTED TOMOGRAPHY
One way to reduce the motion artifacts during scanning is to have the patients hold their breath, which can be very difficult for many radiotherapy patients, especially for those with poor pulmonary function. Another way is to gate the CT scanner (i.e., images are only acquired at a particular breathing phase). A more powerful technique for providing patient geometry throughout the breathing cycle is called respiration-correlated or 4D CT scanning. The basic idea for 4D CT scan is that, at every position of interest along a patient’s long axis, images are oversampled and each image is tagged with breathing phase information. After the scan is done, images are sorted based on the corresponding breathing phase signals. Thus, many three-dimensional (3D) CT sets are obtained, each corresponding to a particular breathing phase, and together constitute a 4D CT set that covers the whole breathing cycle.
Various institutions have developed 4D CT scans with slightly different flavors. Ford et al.35 created a 4D CT scan method with a single spiral CT scan, using a respiration wave form supplied by an external patient monitor. They used a pitch of 0.5, a gantry rotation period of 1.5 seconds, and a 180-degree reconstruction algorithm, resulting in approximately 5-mm slice spacing at a given phase for typical respiration periods. A similar method of acquiring 4D CT images from a spiral CT scan was developed in parallel by Vedam et al.36 The implementation of Low et al.37 was based on a multislice CT scanner operated in the cine mode and a digital spirometer-measured tidal lung volume as the breathing phase signals for retrospective slice sorting. Pan et al.38 developed a cine scanning protocol for 4D CT scan in axial mode. At each couch position, the scans are continuously acquired for a time interval greater than or equal to the average respiratory cycle plus the duration of the data for an image reconstruction. The x-ray is turned off during CT couch translation to the next position, and the acquisition is repeated until the prescribed volume is completely scanned. Following data acquisition, the CT data are registered into respiratory phases based on either an internal anatomic match or an external respiratory signal. Keall et al.39 developed a method of acquiring 4D thoracic CT scans using a multislice helical method. They interfaced a commercial position-monitoring system used for respiratory-gated radiotherapy with a third-generation multislice scanner and modified 4D cardiac reconstruction methods to allow 4D thoracic CT acquisition.
A 4D CT scan can account for respiratory motion to generate images with less distortion than 3D CT. These 4D images also contain respiratory motion information pertaining to tumor and organs that is not available in a 3D CT image. Compared to gated axial scans, multiple phases of respiration are imaged with 4D CT in approximately the same scanning time required to image a single phase with a gated axial scan. This technology can be used for respiratory-gated treatment to identify the patient-specific phase of minimum tumor motion,40 determine residual tumor motion within the gate interval, and compare treatment plans at different phases. It also can be used for nongated treatment planning to define ITV by combining GTV at all breathing phases or using a method called maximum intensity projection (MIP). Of course, 4D CT will also play a vital role in futuristic 4D radiotherapy, when the tumor is tracked dynamically during treatment using a multileaf collimator (MLC).41
That said, 4D CT is not without its problems, which include increased imaging dose,42 CT tube heating, and data management. More importantly, a 4D CT scan is not really 4D: temporal information is mapped into one breathing cycle. Irregular respiration will cause artifacts in 4D CT images. Although patient coaching can improve the regularity of breathing patterns and reduce residual artifacts, the efficacy of this technique still merits further study.43 We believe that the improved 4D CT technique, especially with emerging fast multiple slice scanners, will become the standard clinical practice for CT simulation for radiotherapy of thoracic and abdominal tumors.
MOTION CONTROL
Once the motion characteristics of the tumor (and normal tissues) are characterized, they must be managed in a consistent
fashion between simulation and treatment. Otherwise, unnecessarily large treatment margins would be required to ensure that the target is adequately treated according to the dose prescription.
fashion between simulation and treatment. Otherwise, unnecessarily large treatment margins would be required to ensure that the target is adequately treated according to the dose prescription.
Motion control devices fall into three general categories: (a) dampening, (b) gating, and (c) chasing. The category of dampening includes the systems of abdominal compression aimed at decreasing one of the largest contributors to respiratory motion related to the diaphragm.44, 45, 46, 47, 48, 49 Also included in this category are the systems using breath-hold maneuvers to “freeze” the tumor in a reproducible stage of the respiratory cycle (e.g., deep inspiration).50, 51, 52, 53 Gating systems follow the respiratory cycle using a surrogate and use an electronic beam activation trigger allowing irradiation to only occur during a specific segment (e.g., end expiration).54, 55, 56, 57 Tracking systems literally move the radiation beam along the same path as the tumor from the beam’s eye view.58, 59, 60, 61, 62 Tracking may be accomplished by moving the entire accelerator, moving the aperture (e.g., with the MLC), or moving the patient on the couch counter to the motion of the tumor. All of these techniques will be discussed more in subsequent sections of this chapter.
In the case of gating and breath-hold, the beam is triggered on and off, constituting a duty cycle (lengthening the total treatment time), which is avoided by the other systems. In any case, the acquisition of planning information must include the same consideration for motion accounting as the treatment in order to achieve accuracy. Despite available motion control equipment, some uncertainty continues to require that the PTV is larger than the GTV.
IMAGE-GUIDED PATIENT SETUP
Stay updated, free articles. Join our Telegram channel

Full access? Get Clinical Tree


