(1)
Department of Radiology, John H Stroger Jr Hospital of Cook County, Chicago, IL, USA
Trauma
Diagnosis
Testicular Rupture
Imaging Features
1.
Discontinuity of the tunica albuginea
2.
Poorly defined testicular margins
3.
Hypoechoic or hyperechoic areas in the testicular parenchyma from hematoma or infarction
4.
Decreased or no flow in affected areas
5.
Hematocele

Fig. 19.1
Testicular rupture from gunshot injury. US of the right testis (a, b) shows discontinuity of the tunica albuginea (short thin arrows), hypoechoic regions of hematoma, and edema within the testes (long thin arrows) and surrounding hematocele (arrowhead). (c) The appendix of the testes also has areas of hematoma with decreased echogenicity (arrow). (d) Color Doppler US shows flow in the normal testicular parenchyma and no flow in the areas of hematoma (arrows)
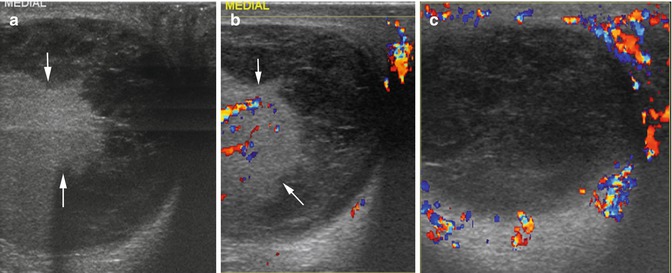
Fig. 19.2
Testicular rupture with hematocele. History of blunt trauma 10 days prior. Grayscale and color Doppler US of the right testis (a, b) show extrusion of the testicular parenchyma outside the tunica albuginea (between arrows) with intact vasculature. Heteroechoic hemorrhagic fluid is seen in the tunica vaginalis space surrounding the protruding testicular contents. (c) Scrotal wall shows increased vascularity due to reactive changes from trauma
Diagnosis
Hematocele
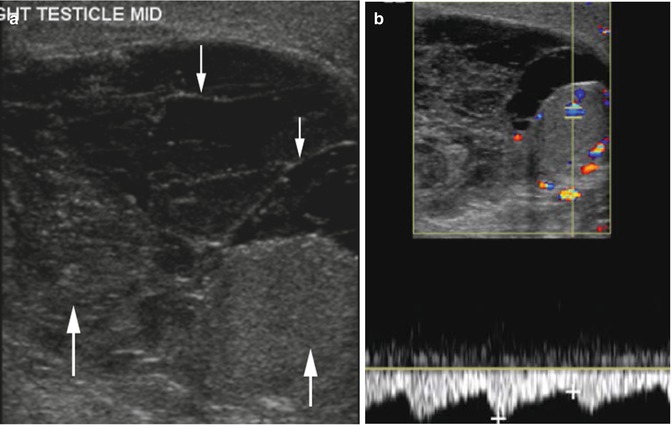
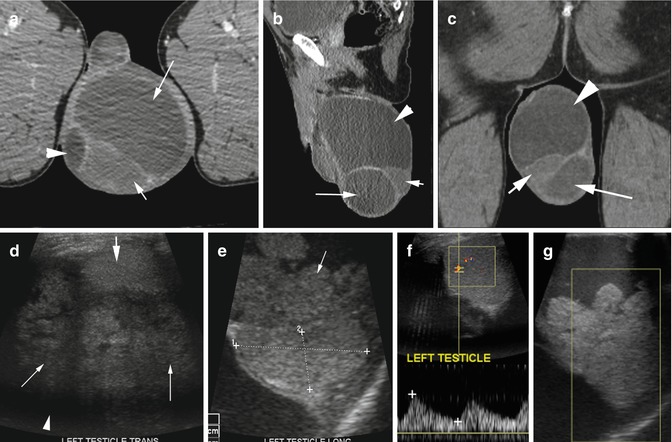

Fig. 19.3
Hematocele. History of gunshot injury of the upper thigh and perineum 2 weeks prior. Sonogram of the right scrotum (a, b) shows hematocele with solid hematomas (thick arrows) and areas of fibrin strands (thin arrow). (b) Doppler study shows minimal increase in diastolic flow in the testes from reactive changes with no clinical signs of infection

Fig. 19.4
Hydrocele with focal hematoma. History of the enlarging left scrotum with no known trauma. (a) Axial and (b) sagittal and (c) coronal reformatted CT images show high-density hemorrhagic fluid (long arrow) and hydrocele (arrowhead) surrounding the testes (short arrow). Sonogram (d, e) shows the left testis (thick arrow and caliper) surrounded by echogenic lobulated thrombus (thin arrows) with large hydrocele (arrowhead). (f) Spectral study (g) Color Doppler shows normal flow to the testes and no flow in the hematoma. Pathology showed no evidence of infection or tumor
Diagnosis
Testicular Fracture with Intratesticular Hematoma
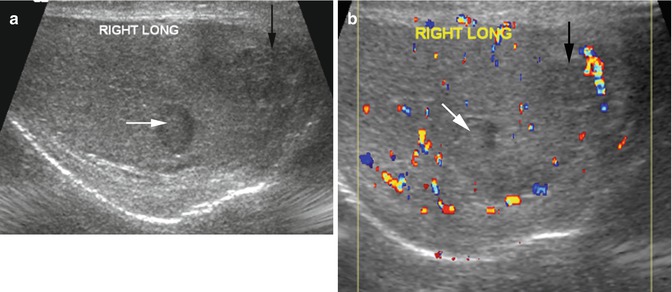

Fig. 19.5
Testicular fracture with intratesticular hematoma from gunshot injury to the penis. Grayscale US (a) shows two hematomas, one with increased echogenicity and is well marginated (white arrow) and the larger is ill-marginated with irregular low echogenicity (black arrow). Tunica albuginea is intact. (b) Color Doppler study shows flow around the hematomas (white and black arrows) and in the rest of the testicular parenchyma
Diagnosis
Post-trauma Intratesticular Gas
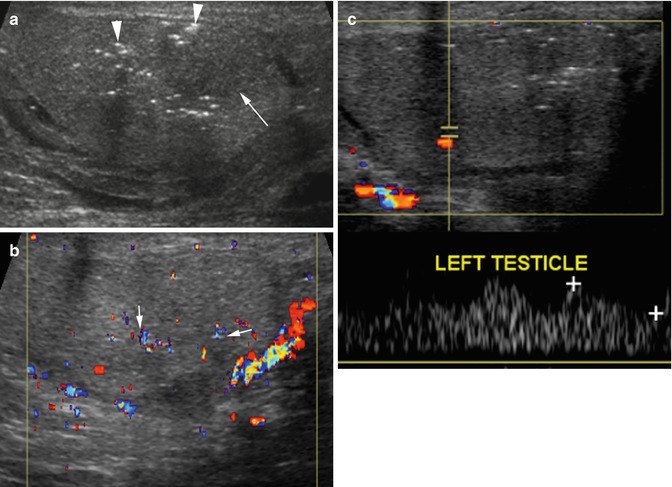

Fig. 19.6
Intratesticular gas post gunshot injury. Grayscale US (a) shows scattered punctate, increased echogenicity with faint posterior dirty shadowing from gas (arrowhead) in the testicular parenchyma mostly adjacent to the hematoma seen as area of decreased echogenicity (arrow). (b) Color Doppler US shows twinkling artifacts from the gas (arrows). (c) Spectral waves are seen to be preserved in the normal parenchyma
Diagnosis
Hematoma Epididymis
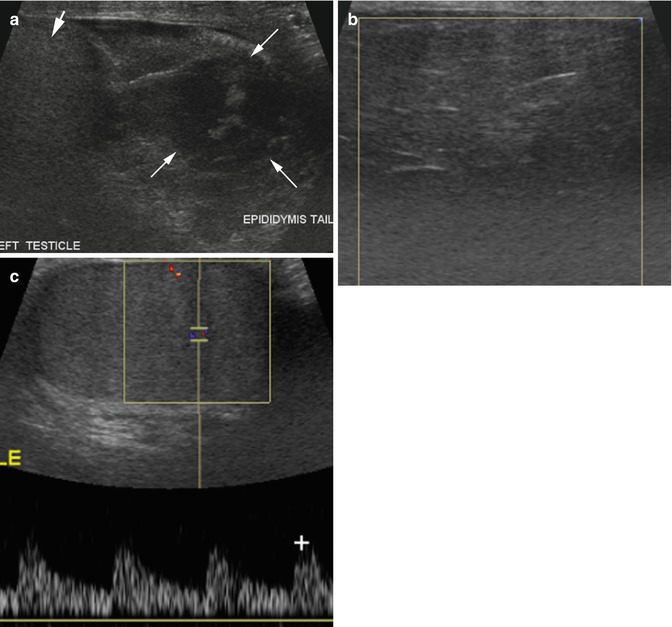
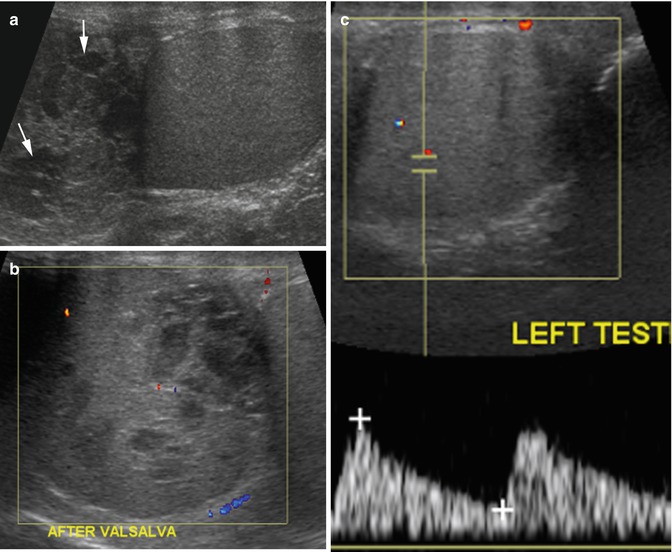

Fig. 19.7
Hematoma tail epididymis. History of blunt trauma. (a) Grayscale ultrasound shows a large tail of epididymis with heterogeneous density (arrows) with normal uniform echogenicity of the testes (short arrow). Color Doppler study (b) shows no flow in the epididymis with (c) normal spectral flow in the testes

Fig. 19.8
Hematoma of the head of epididymis post-trauma. Sonogram of the left testis. (a) Grayscale study shows enlarged head of the left epididymis with multiple well-defined hematomas with low-level echoes (arrows). (b) Color Doppler shows very little flow is seen in the epididymis. (c) The testes shows normal echogenicity and normal spectral waves
Diagnosis
Post-trauma Gas Perineum
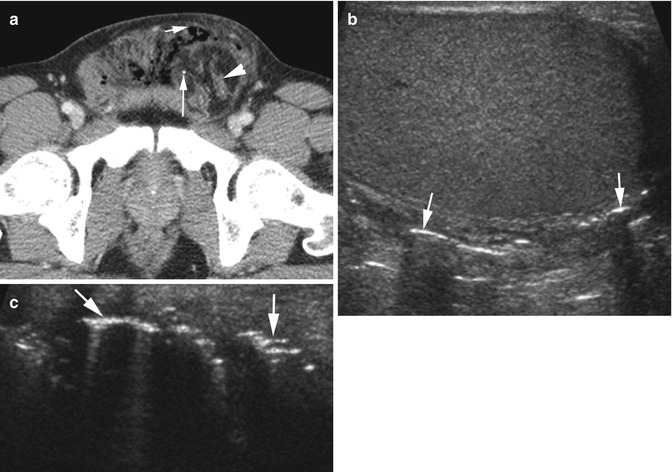
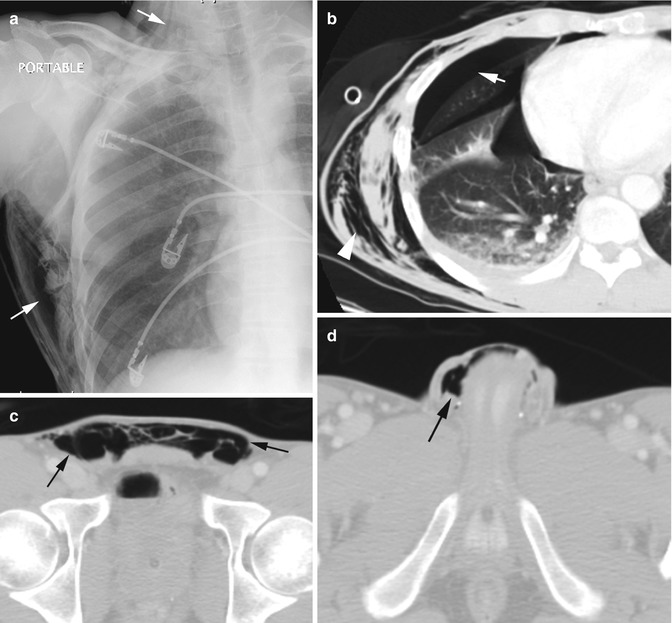

Fig. 19.9
Gas in soft tissue of the perineum from gunshot injury. (a) Axial CT shows gas (short thin arrow) in the perineum anteriorly. Herniation of the omentum and small bowel is seen in the left inguinal canal (arrowhead) and a small metallic fragment (long arrow). (b, c) Grayscale US shows multiple linear focal gas showing increased echogenicity with posterior dirty shadowing in the soft tissues outside the testes (arrows)

Fig. 19.10
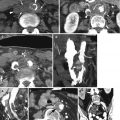
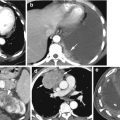
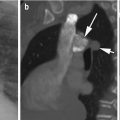
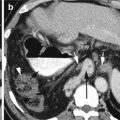
Trauma of the right thorax with pneumothorax and thoracic wall emphysema tracking up to the scrotum. (a) Chest radiograph shows air in soft tissues of the thoracic wall (arrows). (b) CT of the chest shows pneumothorax (arrow) and air in the thoracic wall soft tissues (arrowhead). (c, d) Axial CT of the pelvis shows air dissecting down the subcutaneous tissue plane of the anterior abdominal wall (arrows) up to the scrotum, more on the right side (arrow)
Infection
Diagnosis
Fournier Gangrene
Imaging Features
1.
CT—soft tissue inflammation, fluid and/or abscess, and gas collection
2.
US:
Thickened and edematous scrotal wall with hyperemia
Hyperechoic foci with dirty shadowing from gas collections
May have reactive unilateral or bilateral hydrocele
Testes and epididymis are often normal
3.
Radiography—soft tissue air involving the scrotum or perineum, inguinal region, and anterior abdominal wall
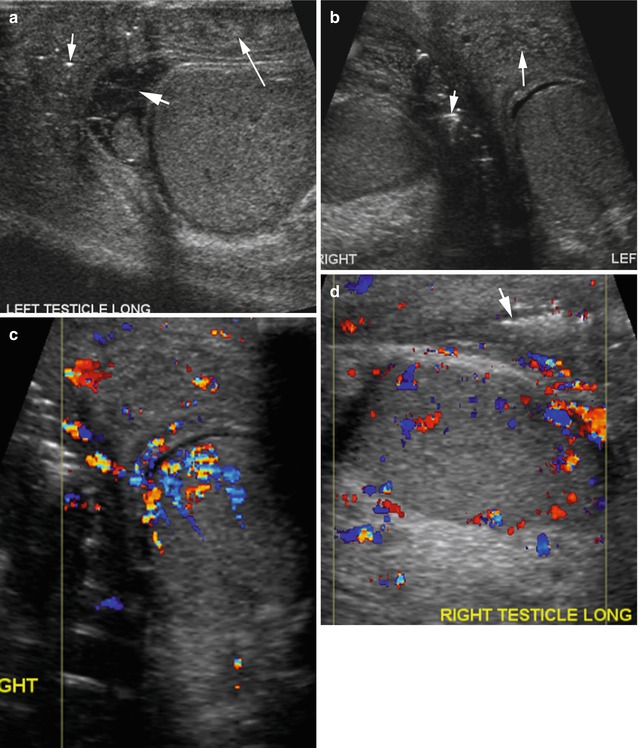
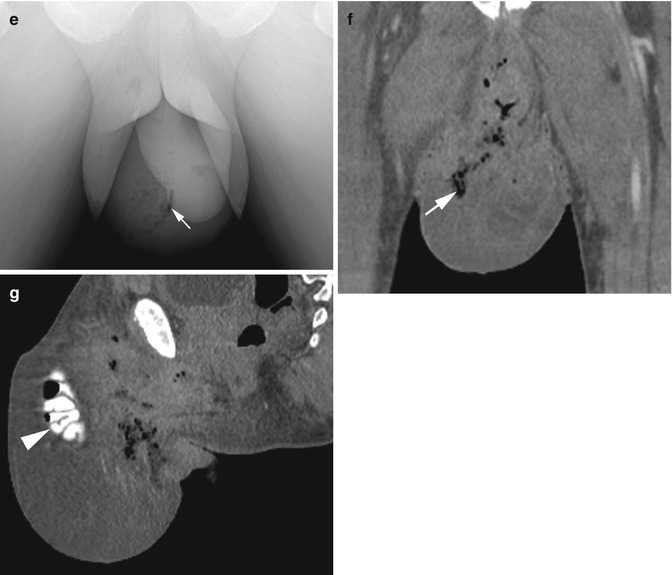
Fig. 19.11
Fournier gangrene in three patients. Patient 1: (a) Longitudinal and (b) transverse grayscale US views of the scrotum show diffuse scrotal wall thickening with onion skin appearance due to layered edema (long arrow) in the fascial planes. Gas in the wall is seen as hyperechoic foci with dirty shadowing (short arrow also in d). Small hydrocele with strands (thick arrow) is also seen. (c, d) Color Doppler study shows increase flow to the scrotal wall due to cellulitis and to the testis bilaterally from epididymo-orchitis. Patient 2: (e) Radiograph of the pelvis shows streaky gas overlying the right scrotum (arrow). Patient 3: (f, g) Coronal and sagittal reformatted CT images show diffuse bilateral scrotal wall swelling with gas streaks (white arrow) and contrast-filled herniated small bowel (arrowhead)
Diagnosis
Abscess Scrotal Wall
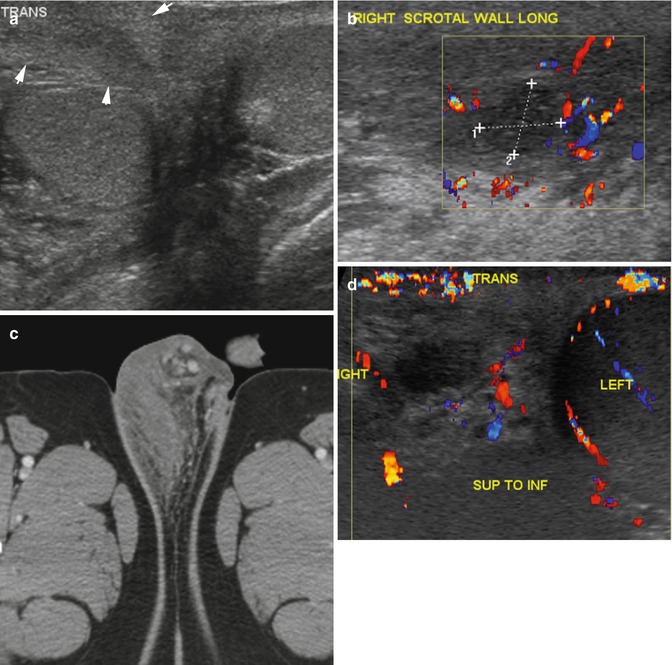
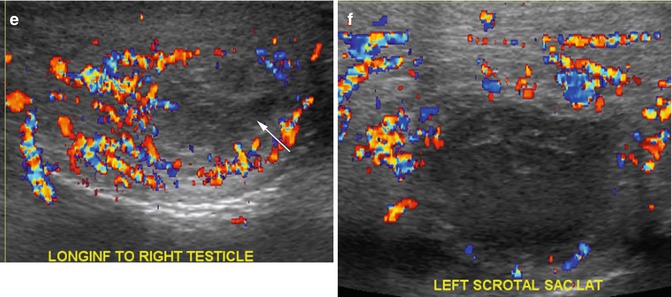


Fig. 19.12
Abscess scrotal wall in three patients. Patient 1: (a) Grayscale US shows diffuse wall thickening over the right testis (arrows). (b) Color Doppler shows increased flow around an avascular abscess (calipers) on the same area. (c) Axial CT shows increased edema and soft tissue thickening on the right side of the perineum and scrotal wall. Patient 2: (d, e) Color Doppler US in transverse and longitudinal views shows large low echogenic abscess (arrow) in the median raphe with increased flow around it. Patient 3: (f) Color Doppler US shows cellulitis of the left scrotal wall with hyperemia and focal heterogeneous low echogenic abscess with no vascular flow
Epididymitis, Orchitis, Abscess, and Pyocele
Imaging Features
1.
Epididymitis—enlarged epididymis, hypoechoic or hyperechoic, and hyperemia with high-flow, low resistance pattern
2.
Orchitis—enlarged testes with heterogeneous echogenicity, hyperemia, and high-flow, low resistance pattern arterial flow and increased venous flow
3.
Pyocele—septated or complex heterogeneous hydrocele
4.
Abscess—complex heterogeneous fluid collection with surrounding hyperemia
Diagnosis
Intratesticular Abscess
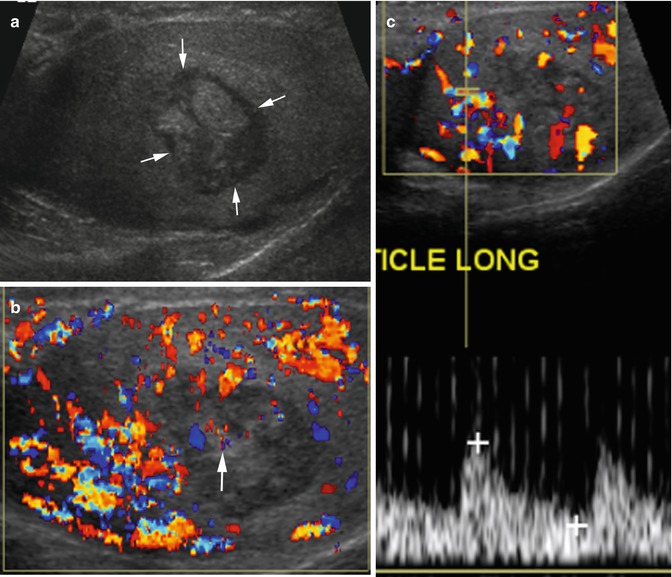
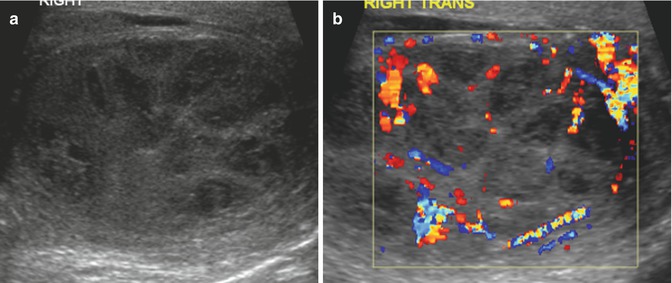

Fig. 19.13
Intratesticular abscess. History of gonorrhea and HIV infection. Grayscale US (a) shows a well-marginated intratesticular abscess with internal irregular echogenicity (arrows). (b) Color Doppler study shows increased vascularity of the testes from orchitis. The solid portion within the abscess is a granulation tissue showing vascularity (arrow). (c) Spectral study shows increased flow in the testes

Fig. 19.14
Multiple intratesticular abscesses. A patient with intellectual disability and urethral stenosis. Grayscale (a) and color Doppler sonogram (b) of the right testis show multiple abscesses as focal fairly well-defined areas of heteroechoic decreased echogenicity having increased flow to the intervening testicular parenchyma
Diagnosis
TB Orchitis


Fig. 19.15
Tuberculous orchitis, biopsy proven. History of scrotal pain and swelling not responding to antibiotic therapy. Grayscale and color Doppler sonogram (a, b) show diffuse discrete hypoechoic nodules (arrows) in the left testis rimmed by thin mildly echogenic wall. Increased vascularity is seen around the nodules. The scrotal wall is also thick on the left side. (c) The right testis shows normal echogenicity and vascularity
Diagnosis
TB Epididymitis
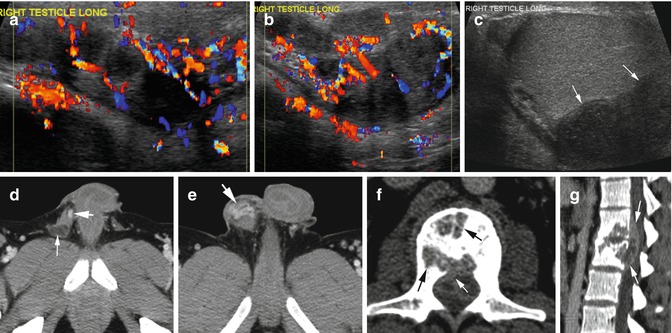

Fig. 19.16
Tuberculous epididymitis and spondylitis. (a, b) Color Doppler sonogram shows enlargement and hyperemia of the tail and body of the epididymis with multiple hypoechoic nodules. The head (not shown) was normal in size. (c) Grayscale US shows nodules at the tail causing extrinsic pressure on the testes (arrows). (d, e) Axial CT shows a low-density nodule (thin arrow) and dilated vessels in the thick right spermatic cord up to the tail of the epididymis (thick arrow). (f, g) Axial and sagittal reformatted CT show destructive changes in L1–L2 vertebral bodies (black arrows) and decrease in disk space, and epidural extension (white arrows) was proven to be TB spondylitis with epidural abscess
Diagnosis
Epididymo-orchitis with Epididymal Abscess
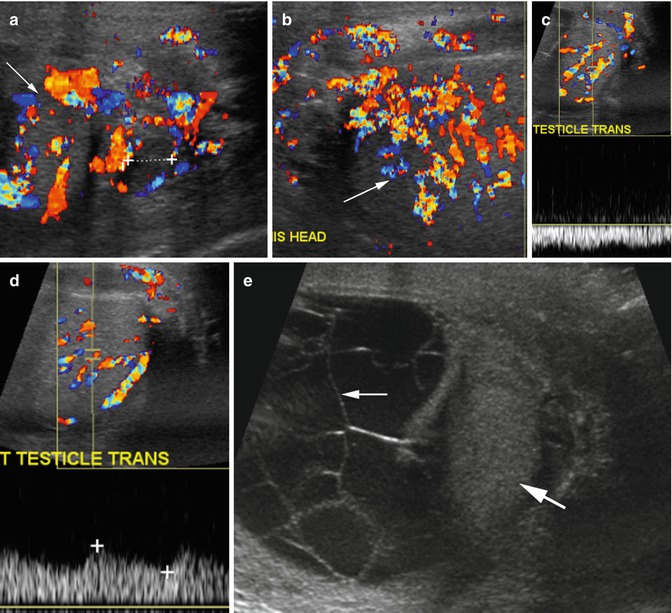

Fig. 19.17
Epididymo-orchitis with epididymal abscess and pyocele. (a, b) Color Doppler US shows enlarged epididymis with abscess at the tail (caliper in a) and increased vascularity of the testes (arrow) and epididymis. Spectral Doppler of testes shows (c) increased venous flow and (d) low-resistance arterial flow. (e) Grayscale US shows a pyocele with septations (thin arrow) compressing the left testis (thick arrow)
Diagnosis
Pyocele
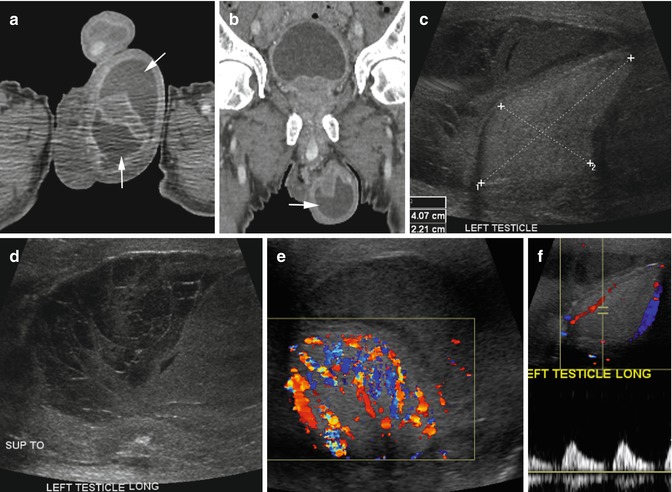

Fig. 19.18
Pyocele. A diabetic patient with scrotal swelling. (a, b) Axial and coronal reformatted CT images show infected hydrocele with large fluid collection in the left scrotum with enhancing rim (arrows). (c) Grayscale US shows tunica vaginalis space distended with low echoic heterogeneous fluid compressing the testes (calipers). The fluid shows septations in its upper part (d). (e) Color Doppler shows increased vascularity of the testes from orchitis. (f) Spectral study shows good systolic flow from the orchitis but absence of diastolic flow from venous compression by the large pyocele
Diagnosis
Seminal Vesicle Abscess


Fig. 19.19
Seminal vesicle abscess. Ten cc of pus was removed. Axial (a), coronal (b), and sagittal (c) reformatted CT images show seminal vesicle abscesses bilaterally, larger on the right side with rim enhancing fluid collections (arrow). (d) Abscessogram shows contrast in the seminal vesicle abscess (thick black arrow) draining into the prostatic urethra through the ejaculatory duct (white arrow) and contrast refluxing into the bladder (thin black arrow)

Fig. 19.20
Seminal vesicle metastasis from clear cell renal cell carcinoma. History of past left nephrectomy for RCC now with diffuse metastasis. (a) Axial CT shows enhancing mass in the left seminal vesicle with small cystic lesions (arrows). (b) Coronal reformatted image shows complex mass in the left seminal vesicle (arrow), cystic metastasis in the left adrenal gland (arrowhead), and absent left kidney. (c) Axial image of the chest shows diffuse miliary metastasis
Testicular Ischemia
Imaging Features
1.


The spectral waveform varies depending on severity and duration of ischemia. It can be:
(a)
Monophasic wave with absence of dicrotic notch
(b)
Increased arterial flow resistance with decreased diastolic flow or reversal of diastolic flow
(c)
Absent arterial flow
Stay updated, free articles. Join our Telegram channel

Full access? Get Clinical Tree


