96 Maximizing Magnetic Susceptibility
Figure 96.1 presents scans from a patient with multiple cavernous angiomas using (A, C) fast spin echo (FSE) and (B, D) gradient echo (GRE) T2-weighted techniques at (A, B) 1.5 T and (C, D) 3 T. The lesions, seen as small, focal, low signal intensity abnormalities, are much more evident on the GRE scans due to phase dispersion from local gradient (susceptibility) effects. The result is a clearly demarcated area of signal loss. Susceptibility-related effects are also more prominent at higher fields, leading to highest sensitivity on (D) the GRE scan at 3 T.
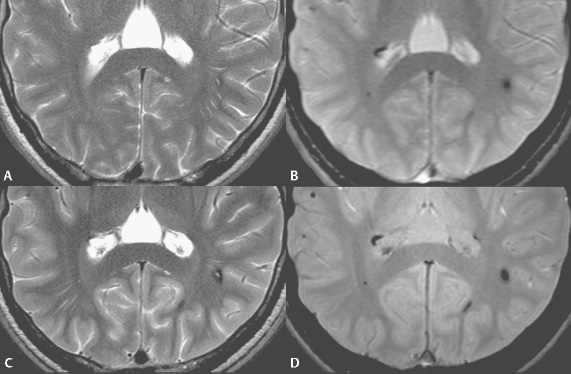
Fig. 96.1
Stay updated, free articles. Join our Telegram channel

Full access? Get Clinical Tree


