The blood-brain barrier (BBB) is a functional concept to describe unique features of intracranial blood vessels that prevent many substances in the systemic circulation from entering the brain. In the setting of acute ischemic stroke, loss of blood-brain barrier (BBB) integrity is believed to be a precursor to hemorrhagic transformation. CT and MR imaging may evaluate BBB integrity by detecting leakage of intravenously administered contrast media into the extravascular space. In its simplest form, BBB integrity is assessed qualitatively, by determining the presence or absence of contrast enhancement on structural images of the brain. When dynamic contrast-enhanced (DCE) MRI or CT is combined with a suitable pharmacokinetic model, one can quantify and spatially map BBB integrity throughout the brain.
Thrombolytic therapy with recombinant tissue plasminogen activators (rtPA) is the main treatment available for acute ischemic stroke, yet use of rtPA is currently limited to patients presenting within 4.5 hours of symptom onset, because of the increased risk of hemorrhagic transformation (HT) if it is administered later. There is strong evidence that the HT process begins at the microvascular level. There are also a growing number of reports implicating rtPA as either a primary cause or as an aggravating factor in BBB breakdown. Following intravenous injection of contrast material, extravasation of contrast (through a damaged BBB) is an accurate predictor of subsequent HT. Imaging assessment of BBB integrity may predict the likelihood of hemorrhagic transformation on a patient-by-patient basis, rather than using the same simple 4.5-hour time limit for all patients. This could potentially extend the therapeutic time window in patients with evidence of BBB stability, and potentially exclude some patients from receiving rtPA if they have a high risk of hemorrhage despite falling within the 4.5-hour time window. In this article, we discuss the application of permeability imaging in acute ischemic stroke using MRI and CT.
MRI methods for the assessment of BBB integrity
In the 1980s, the introduction of paramagnetic intravascular contrast agents, such as gadolinium chelate gadopentetate dimeglumine (Gd-DTPA), made possible the investigation of BBB integrity using MRI. Gd-DTPA is the most widely used MR contrast agent. It is a freely diffusible, extracellular tracer with a molecular size of 550 Da. The chelator moiety, DTPA, governs the kinetics of the entire compound and clearance occurs primarily via glomerular filtration. The contrast enhancement is produced by the paramagnetic Gd 3+ core of the agent, which is known to reduce T1 in a concentration-dependent manner.
For assessment of permeability, Gd-DTPA is administered intravenously, usually as a bolus (manual or power) injection. As the contrast agent passes through the microvasculature of the brain, it is almost entirely confined to the intravascular space. In regions of BBB breakdown, however, the contrast-agent can extravasate and accumulate in the interstitium. Once in the extravascular space, voxels with higher concentrations of contrast agent will appear bright on T1-weighted MR images. We will now discuss the use of standard (static) postcontrast T1-weighted MR imaging and dynamic contrast-enhanced MR imaging for the detection of BBB breakdown.
Postcontrast T1-Weighted MRI to Predict HT in Acute Ischemic Stroke
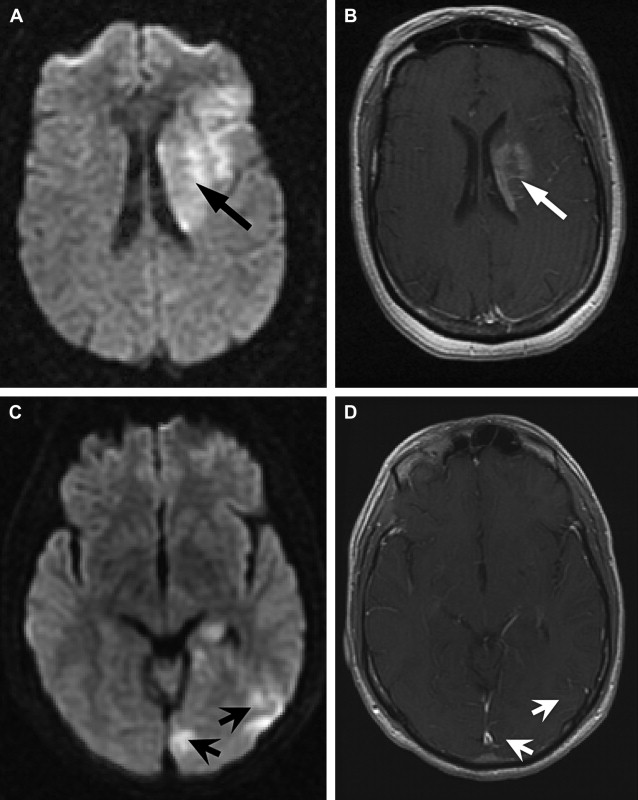
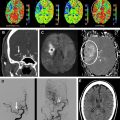
The detection of contrast leakage into brain parenchyma can be attempted with static T1-weighted MR imaging. As with brain tumors, the rationale for static contrast-enhanced MRI is that any tissue supplied by vessels with compromised BBB should eventually become conspicuous as a region of signal enhancement on T1-weighted images. Enhancement on T1-weighted images in hyperacute infarcts is indeed associated with subsequent HT. High-resolution T1-weighted images are generally acquired at least several minutes after the intravenous (IV) bolus injection of contrast agent (usually 0.1 mmol/kg Gd-DTPA) to allow for sufficient tracer accumulation in the parenchyma at sites of BBB disruption. Although qualitative visual evidence of parenchymal enhancement (that is, contrast extravasation) on postcontrast T1-weighted MRI is a highly specific (specificity ∼85%) predictor of HT, it is infrequent during the crucial hours after symptom onset, and insensitive (sensitivity ∼35%), which may make the test unsuitable for therapeutic decision making. Because it provides only a “snapshot” of a dynamic process (ie, contrast extravasation via breaches in BBB integrity), postcontrast T1-weighted MRI could be problematic during the hyperacute or acute phase of injury in acute ischemic stroke. Postcontrast T1-weighted images of 2 HT cases imaged fewer than 6 hours after symptom onset at our institution are provided in Fig. 1 to illustrate this problem. At present, it remains to be demonstrated that these images can be acquired at just the right moment to capture the onset of BBB breakdown and offer adequate sensitivity within the current 4.5-hour treatment window.
In part, the low sensitivity of postcontrast T1-weighted MRI for secondary hemorrhage may be a consequence of persistent ischemia or microvascular obstruction in the acute phase such that contrast fails to accumulate sufficiently within the infarct despite local BBB disruption. A 1999 report demonstrated that the addition of a continuous low-dose infusion of contrast to the initial bolus dose could improve the sensitivity of postcontrast T1-weighted MRI. Although a lengthy infusion is clearly unsuitable for the purpose of acute ischemic stroke treatment decision making, the development of convenient measures that increase the signal-to-noise ratio (SNR) may enable us to detect BBB disruption, where it exists.
Dynamic Contrast-Enhanced MRI
Rationale and acquisition strategy
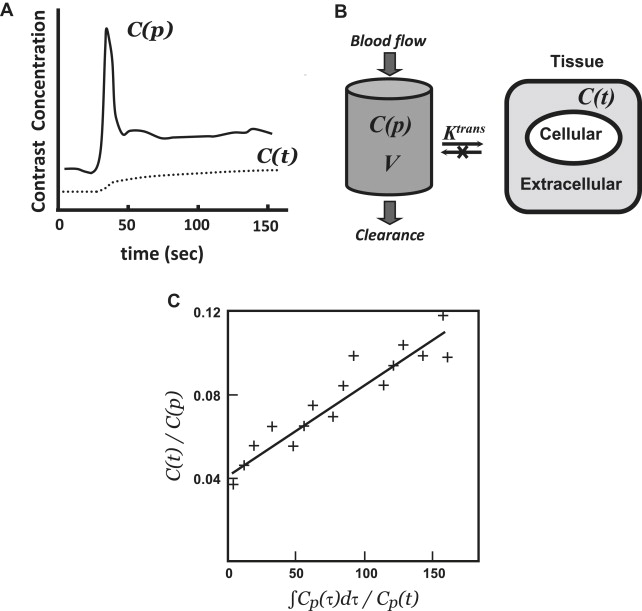
Dynamic contrast-enhanced MRI (DCE-MRI) typically involves intravenous bolus injection of a gadolinium contrast agent followed by T1-weighted gradient-recalled echo (GRE) imaging of the brain repeated dozens of times over the course of several minutes. Then, assuming a linear relationship between image MR signal intensity as a function of time ( SI [t]) and contrast-agent concentration as a function of time ( C[t] ), one can generate a set of concentration versus time curves for each voxel or region of the brain. One also typically generates at least one curve consisting exclusively of blood plasma data ( C[p] ) ( Fig. 2 A). As with postcontrast T1-weighted imaging, evidence of enhancement indicates that contrast material has escaped the confines of the intravascular compartment via breaches in the BBB. The advantage of the dynamic T1-weighted imaging technique is that one can quantify contrast accumulation as a function of time, apply an appropriate pharmacokinetic model to the time-varying C(t) and C(p) data-sets, and estimate BBB permeability in standard units of mL/100 g/min.
The most common MRI sequence used in brain DCE-studies, including those performed at our institution, is a 3-dimensional (3D) GRE sequence with a short repetition-time (TR), short echo-time (TE), and a flip angle of approximately 20° at 1.5 T. Three-dimensional volume acquisitions are favored over 2D equivalents in DCE-MRI of the brain, as they permit the simultaneous sampling of the signal intensity in tissue and in blood and are more likely to encompass a large vessel from which one can generate an arterial input function (a considerable challenge in brain DCE ). In addition to coverage, a 3D DCE acquisition offers the advantage of maximizing the saturation of inflowing blood while minimizing precontrast inflow enhancement. Furthermore, the 3D GRE sequence is less sensitive to geometric distortions or magnetic susceptibility than equivalent echo-planar sequences.
The temporal resolution of the DCE sequence must be sufficient to capture the blood-brain flow of contrast anticipated for the pathology of interest. By definition, the temporal resolution of the acquisition will improve with shorter TRs (ie, more images can be collected per unit time); TE should also be short, but this choice is related more directly to mitigating susceptibility-related signal loss caused by the transit of the paramagnetic contrast-agent through the microvasculature. The TR prescribed for brain DCE-MRI studies is typically less than 10 ms. Although a 3D volume acquisition necessarily increases TR relative to single-slice approaches, this is becoming less of an issue as more centers gain access to parallel imaging techniques (eg, sensitivity encoding using multiple receiver coils ).
Pharmacokinetic modeling
The initial step in pharmacokinetic analysis is the conversion of MR signal intensity to contrast-agent concentration. The difference in SI between pre- and postcontrast images using a T1-weighted GRE sequence can be expressed as:
△ S I = k ( 1 T 1 p o s t − 1 T 1 p r e ) = k △ ( 1 T 1 ) = k △ R 1
The next step is to model the relationship of the tissue contrast agent concentration C(t) to the concentration time curve of the contrast agent in blood C(p) to gain insight into the physiological process of exchange of the agent between the intravascular and the extracellular space. To achieve this, concentration time curves from both tissue of interest and reference vascular structures are mathematically fitted using a pharmacokinetic model, which enables the derivation of quantitative modeling parameters.
In many cases, the pharmacokinetic models that are applied to DCE-MRI data were originally developed for nuclear medicine tracers. Most of these are compartmental models, which define the tissue space as a volume with both intravascular and extravascular compartments. The generalized 2-compartment analysis proposed by Tofts and colleagues defines 2 tracer parameters of physiological interest: the transfer constant, K trans [s −1 ] and the distribution volume, v e (ie, the fraction of the extravascular-extracellular space occupied by tracer in mL/g):
Related posts:
 Imaging Acute Stroke is Rapidly Evolving
 Arterial Spin Label Imaging of Acute Ischemic Stroke and Transient Ischemic Attack
 MR Perfusion Imaging in Acute Ischemic Stroke
 Intra-arterial Stroke Therapy: Recanalization Strategies, Patient Selection and Imaging
 Noninvasive Carotid Artery Imaging with a Focus on the Vulnerable Plaque
 ASPECTS and Other Neuroimaging Scores in the Triage and Prediction of Outcome in Acute Stroke Patients
Stay updated, free articles. Join our Telegram channel

Full access? Get Clinical Tree


