Anatomy and Embryology
Meninges
The meninges, which form the coverings of the brain and spinal cord, develop from the meninx primitiva. The neural tube is surrounded by this dense cellular layer shortly after the neural tube closes. As early as 32 days and as late as 44 days of gestation, the meninx primitiva begins to cavitate to form the cerebral cisterns by gradually decreasing its cellular component and enlarging its intercellular space. The periphery of the meninx primitiva, however, develops more dense cellularity to become the primitive dura mater.
The earliest subarachnoid space (SAS) is ventral to the brainstem. As this space expands, the prepontomedullary cisterns and anterior spinal SAS are formed. At approximately 41 days, the space is extended to create perimesencephalic and dorsal mesencephalic cisterns. The primitive meninx is composed of totipotential mesenchymal cells of neural crest origin. The remnants of incomplete differentiation of these pluripotential cells may be seen as deposits of fat, or lipomas, in and around the basal cisterns, corpus callosum, and cavernous sinuses. The order of regression of the primitive meninx is reflected in the distribution of lipomas. Thus intracranial lipomas are thought most appropriately to represent developmental rather than neoplastic pathology of the meninges.
This network of concentric membranes consists of the pachymeninx (dura mater) and the leptomeninges (arachnoid and pia mater) ( Fig. 18-1 ). The dura mater is the most superficial membrane, a thick tough structure composed of dense connective tissue. The dura is composed of two layers: (1) an outer periosteal layer, which is highly vascularized, serves as the true periosteum of the inner table of the calvaria, and is not of meningeal origin, and (2) an inner meningeal layer, which is derived from the meninx. The cranial dural layers split to form the venous sinuses.

The term dura (from Latin durus, meaning “hard”) is an apt descriptor of the structure that maintains the position of the cerebral hemispheres and posterior fossa structure by its reflections, such as the falx cerebri and tentorium cerebelli. The arachnoid and pia mater constitute the leptomeninges (from Greek lepto and meninx, meaning “slender membrane”). The delicate arachnoid is adjacent to the inner surface of the dura and is thinner over the convexities than at the base of the brain. The pia mater is a fine membrane that extends into the depths of the sulci.
Extraaxial Spaces
The meninges delimit the extraaxial compartments of the central nervous system (CNS). The epidural space is created when the dura is separated from the calvaria. Although the subdural space (between the dura and arachnoid membranes) has conventionally been characterized as a potential space containing minimal fluid, cells of the arachnoid actually form an intimate network with those of the meningeal dural layer. Electron microscopy has provided evidence that cells belonging to the inner dural layer may be found on both sides of this space when collections form in the subdural space. The subdural space, therefore, is formed by cleavage through the inner layer of the dura rather than by a true separation of dura and arachnoid and as such probably exists only in pathologic states.
The SAS (between the arachnoid and pia mater) contains cerebrospinal fluid (CSF), which flows throughout the CNS and drains into the venous sinuses through the valves of the arachnoid granulations. The pia and the arachnoid are joined by fine connective tissue and cellular septa that traverse the SAS. Near the base of the brain, though, the pia and arachnoid widely separate to accommodate the basal cisterns. Perivascular, or Virchow-Robin, spaces were originally thought to be potential pathways connecting the CSF and deep brain structures by virtue of continuity with the SAS. More recent studies, however, have concluded that perivascular spaces are within the subpial space, separated from the SAS by pia mater ( Fig. 18-2 ).

Extraaxial Collections
Fluid collections in the epidural space assume a localized biconvex configuration as a result of the strong force needed to detach the firmly adherent dura from the inner table of the calvaria. The outer dural layer is most tightly adherent at sutures; classic teaching therefore holds that epidural collections do not cross suture lines. Uncommon exceptions to this rule do occur, however. After administration of paramagnetic contrast medium, the dura adjacent to an epidural hematoma (EDH) has a curvilinear enhancing appearance. An inflammatory reaction with formation of granulation tissue on the outer surface of the dura may produce increased thickness and intensity of enhancement in the dura immediately subjacent to an EDH, as demonstrated in Figure 18-3 .

Greater tissue contrast and multiplanar imaging capability contribute to the superior sensitivity of magnetic resonance imaging (MRI) compared with computed tomography (CT) in detecting small subdural fluid collections. MRI is especially useful in cases of subacute subdural hematoma (SDH), which may appear isodense to cortex on CT. Subdural hygromas result from leakage of CSF into the subdural space, probably after a tear in the arachnoid. MRI can distinguish SDH from subdural hygroma by improved detection of blood products, which are absent in a hygroma, but it cannot distinguish normal from infected subdural fluid, because peripheral dural enhancement may be seen in both infected and noninfected subdural collections ( Fig. 18-4 ). A diffusely enhancing infected subdural collection may mimic an en plaque meningioma.

Magnetic Resonance Imaging
MRI is substantially more sensitive than CT for visualizing both normal and abnormal meninges ( Fig. 18-5 ). Beam-hardening and other artifacts adjacent to the calvaria may be partly responsible for the diminished detection of meningeal enhancement with CT. Experimental evidence suggests that more intense enhancement results in areas of blood-brain barrier disruption with gadolinium (Gd)-DTPA–enhanced MRI than with CT performed after iodinated contrast.

It has been suggested that MRI may be as sensitive as or even superior to CT in detecting subarachnoid hemorrhage (SAH) in the subacute and chronic phases and when a fluid-attenuated inversion recovery (FLAIR) pulse sequence is used. Other evidence suggests that FLAIR sequences may result in false-negative interpretations in the setting of SAH.
Normal Meninges on MRI
The normal meninges may demonstrate short segments of thin, low signal intensity on standard spin echo sequences. Intravenous (IV) administration of Gd-DTPA results in enhancement of the normal cranial dura, which lacks a blood-brain barrier, in an interrupted pattern of short linear segments that is typically most prominent parasagittally ( Figs. 18-6 and 18-7 ). Field strength may influence the conspicuity of “normal” meningeal enhancement as well as detection of pathologic enhancement. Earlier literature reported a distinct lack of enhancement of normal meningeal structures with relatively low-field-strength MRI. The greater signal-to-noise levels achieved at relatively higher field strengths potentiate increased detection of meningeal enhancement (see Fig. 18-6 ).


Cohen and colleagues reported that meningeal enhancement present on more than three contiguous 1.5 tesla (T) spin echo MRI was highly correlated with significant intracranial abnormality. Thick, long, or intensely enhancing segments, as well as nodular meningeal enhancement, are particularly suspect. The normal falx and dura may occasionally enhance in a thin uniform pattern. The typical lack of normal meningeal enhancement observed in MRI of the spine may reflect the absence of the vascular outer dural layer that is found in the cranial pachymeninx.
MRI for Detection of Meningeal Disease
The optimal imaging protocol for detection of meningeal disease is based on (1) technique, (2) sensitivity, (3) role, (4) cardinal signs, and (5) principal patterns ( Box 18-1 ).
- •
Axial FLAIR image
- •
Axial T1-weighted image
- •
Axial and coronal T1-weighted image after administration of a double or a triple dose of gadolinium with a fat-saturation pulse or magnetization transfer
FLAIR, fluid-attenuated inversion recovery.
Imaging Technique
The selection of MRI has a significant impact on the conspicuity of normal meningeal enhancement and sensitivity in detecting meningeal disease (see Figs. 18-6 and 18-7 ). Numerous factors influence the appearance of the meninges on MRI, including (1) the presence and amount of MR contrast agent administered, (2) the type of pulse sequence performed, and (3) the exact pulse sequence parameters.
For partial saturation (spin echo or gradient echo), short echo time (TE) sequences, crucial imaging parameters include the repetition time (TR) and excitation flip angle. The shorter the TR, the greater the degree of saturation of magnetization (i.e., decreased signal intensity) from all imaged tissues. As a result, contrast-enhancing tissue will be more conspicuous against the more saturated (i.e., hypointense) background tissues on a typical short TR, large flip-angle gradient echo study than on a spin echo study. Therefore the normal meninges usually exhibit diffuse enhancement on such ultrashort TR, large flip-angle gradient echo imaging sequences (see Fig. 18-7 ). Imaging plane also affects visualization of meningeal enhancement; the coronal plane is preferred to axial MRI data for evaluating meningeal enhancement over the cerebral convexity.
Similarly, factors that either increase signal from the meninges or decrease signal from background tissues enhance the contrast-to-noise ratio (CNR) and therefore the conspicuity of the enhancing meninges. Double-dosing and triple-dosing of paramagnetic contrast agents have demonstrated improved detection of parenchymal lesions with MRI, and there is evidence to support a similar dose effect for enhanced MRI of meningeal disease. More recently, cases of leptomeningeal metastases that had been diagnosed by MRI and high-dose (0.3 mmol/kg) gadolinium that were not visualized with standard dosing (0.1 mmol/kg) technique have been reported ( Fig. 18-8 ). Also, the use of fat saturation or magnetization transfer options increases the CNR by decreasing the signal from the background tissues.

Sensitivity of MRI
In the past, nonenhanced spin echo MRI was insensitive in detecting meningeal disease. The advent of the FLAIR sequence has greatly improved the sensitivity of MRI performed in the absence of gadolinium to detect meningeal and SAS abnormalities. Singer and coworkers evaluated the use of FLAIR MRI in 62 patients (21 with proven SAS or meningeal disease) and 41 control patients. The sensitivity, specificity, and accuracy of FLAIR for SAS disease were 85%, 93%, and 90%, respectively. Although all six cases of acute SAH were interpreted as abnormal on FLAIR images in the Singer series, this was a source of false-negative interpretation in the series by Williams and associates.
Poor detection of SAH has been attributed to the relatively high oxygen tension in the SAS, which does not permit evolution to deoxyhemoglobin, and to the diluting effect of CSF. In 24 patients who underwent both FLAIR and Gd-enhanced T1-weighted MRI, FLAIR imaging (sensitivity, specificity, and accuracy of 86%, 91%, and 89%, respectively) was superior to Gd-enhanced T1-weighted imaging (43%, 88%, and 74%).
Williams and coauthors prospectively evaluated 376 consecutive cases performed with FLAIR imaging and showed that FLAIR may result in false-negative diagnoses of meningeal or SAS disease in cases of infectious meningitis, carcinomatosis, and SAH. In this series a false-positive diagnosis of meningeal or SAS pathology was made in the presence of normal and hyperintense cortex, susceptibility artifact, prominent pial vessels, concatenated saturation pulse, or flow artifact. Neoplastic or inflammatory processes involving the SAS are best evaluated with paramagnetic contrast agents for visualization of enhancement of the accompanying meningeal involvement ( Fig. 18-9 ).

Role of Imaging
Before and after gadolinium administration, MRI plays an important role in the diagnosis of meningeal neoplasm in the asymptomatic patient when CSF cytologic examination results are equivocal or when lumbar puncture is contraindicated. Imaging, however, does not replace CSF examination in diagnosis of meningeal neoplasm.
The limited sensitivity of CSF cytologic examination continues to be a significant obstacle and reinforces the complementary role of imaging. The percentage of positive spinal CSF cytology in cases of primary CNS tumors with histologically confirmed meningeal involvement varies from 12% to 63% and is increased in symptomatic patients. With meningeal metastases from non-CNS neoplasms, CSF cytology was positive in 45% to 80% of cases, with higher yields after multiple spinal taps. CSF flow cytometry increases the detection of CSF spread of hematologic malignancies over cytologic examination alone. The modest sensitivity of CSF cytology has fueled the search for CSF tumor markers to detect dissemination of neoplasm. Recent literature suggests that markers such as CA 15-3 may have value in detecting breast carcinoma in CSF, and nuclear magnetic spectroscopy may have value in detecting metabolites in CSF indicating disseminated lung adenocarcinoma. Additional tumor markers that may be detected in CSF to indicate leptomeningeal neoplasm include transforming growth factor (TGF)-β1, vascular endothelial growth factor (VEGF), urokinase-type plasminogen activator (uPA), and tissue-type plasminogen activator (tPA).
Like CSF cytology, tumor detection with CSF markers may also be hampered by suboptimal sensitivity and specificity.
The sensitivity of MRI in detecting meningeal neoplasm was originally reported to be lower than that of CSF cytology, with high false-negative rates: 30% to 33% for MRI and 58% for CT. The early studies, however, may have unwittingly introduced a selection bias by using positive cytology as an inclusion criterion. Later series comparing CT myelography with MRI and cytology showed a higher detection rate of CSF metastases with MRI (range, 65%-72%) than with CT myelography (range, 45%-47%) and cytology (29%).
A Memorial Sloan-Kettering Cancer Center study showed that when the patient cohort was not restricted to patients with positive cytologic findings, the rate of detection of meningeal carcinomatosis was increased. This study examined 137 patients with signs and symptoms of meningeal disease. CT and MRI were assessed for signs of meningeal or SAS neoplasm, including hydrocephalus, enhancement of the dura, leptomeninges, and cranial nerves. Leptomeningeal metastases were identified in 77 of 137 patients. The diagnosis of leptomeningeal metastases was based on the clinical and imaging findings alone in 31% of those cases. Abnormal imaging findings were reported much more frequently in cases of solid tumor primaries (90%) than in hematologic neoplasms (55%). More recent studies confirm these findings. A caveat in using MRI for the diagnosis of leptomeningeal tumor involvement, therefore, is that MRI is less sensitive in detecting involvement of the meninges resulting from hematologic malignancies than in detecting detecting solid tumors.
When the distinction between meningeal neoplasm and inflammatory meningeal disease cannot be established by CSF and clinical data, MRI can support the diagnosis of neoplasm and guide meningeal biopsy. Although infectious meningitides are often uncovered by CSF analysis, MRI may be used to target meningeal biopsies when needed.
Cheng and coworkers reported an improved yield from meningeal biopsy specimens in cases of chronic meningitis when tissue specimens were obtained from enhancing regions identified on MRI study ( Fig. 18-10 ). MRI has an advantage over CSF examination in its ability to characterize bulky neoplastic disease that may be more responsive to radiation therapy. Because CSF cytologic examination produces a higher false-negative rate in focal than in diffuse disease, imaging may be of particular value in detecting focal spread of neoplasm to the meninges or SAS. MRI also has the potential to allow noninvasive monitoring of treatment response, although it is conceivable that the imaging abnormalities may persist beyond the eradication of neoplastic cells in the CSF. In a series of patients with coccidioidal meningitis, diminution of meningeal enhancement was seen in treated patients with improving CSF profiles. Therefore MRI also may be useful as a means of monitoring response to therapy in fungal meningeal disease.

Imaging is a useful adjunct for the diagnosis of neoplastic meningeal disease in the appropriate clinical setting, along with CSF examination to exclude infectious or noninfectious processes of the meninges.
Finally, imaging may allow the clinician to assess outcome, in that diffuse leptomeningeal involvement confers a poor prognosis.
Cardinal Imaging Signs of Meningeal Pathology
The main imaging findings that have been associated with meningeal pathology are as follows :
- •
Hydrocephalus ( Fig. 18-11 )

FIG 18-11
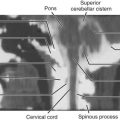
Hydrocephalus with ependymal enhancement and pia–subarachnoid space abnormality. A, Axial T1-weighted image obtained after gadolinium administration shows enlargement of the lateral ventricles and thin linear ependymal enhancement. B, There is a pia-subarachnoid enhancement pattern between the cerebellar folia and along the third cranial nerves, indicating meningeal spread of small cell lung carcinoma in a patient with multiple cranial neuropathies.
- •
Dura and arachnoid enhancement or signal abnormality (see Fig. 18-10 )
- •
Pia and SAS enhancement or signal abnormality (see Fig. 18-11 )
- •
Subependymal enhancement or signal abnormality ( Fig. 18-12 )

FIG 18-12
Focal nodular ependymal enhancement. A, Nodular enhancement of the ependyma of the frontal horns was the probable entry point for subarachnoid spread of melanoma. B, Sagittal T1-weighted image of the lumbar spine shows nodular enhancing drop metastases to the cauda equina (arrowheads).
Hydrocephalus may or may not be associated with enhancement of the meninges or ependyma. In this setting, hydrocephalus alone implies a resorptive block to CSF flow. Hydrocephalus may occur in the setting of SAH, infectious or noninfectious meningitis, and neoplasm. In the patient with neoplastic meningeal disease, hydrocephalus is more likely when leptomeningeal invasion or SAS has occurred rather than when neoplasm is limited to the dura.
Enhancement of the meninges may occur in the spine or brain. Meningeal or subependymal enhancement may be focal ( Fig. 18-13 ) or diffuse (see Fig. 18-12 ) and may have either a smooth or nodular contour ( Fig. 18-14 ; see Fig. 18-13 ). Diffuse leptomeningeal involvement is a harbinger of a worse prognosis than focal disease. Although a nodular pattern of enhancement may suggest neoplasm, it is not specific; nonneoplastic entities (e.g., sarcoidosis) may also produce nodular thickening of the meninges (see Fig. 18-14A and B ). Infiltration of the leptomeninges overlying the convexities or in the basal cisterns may result in sulcal or cisternal obliteration on a noncontrast T1-weighted image ( Fig. 18-15 ) or a FLAIR sequence (see Fig. 18-9 ). Minimal shortening of T1 and T2 relaxation times in the cisternal CSF (“dirty CSF sign”) may be seen on nonenhanced MRI (see Fig. 18-15 ). In rare instances, subarachnoid tumor or inflammatory exudates may result in distention of the SAS or perivascular (subpial) spaces ( Fig. 18-16 ).


Imaging Patterns
Two distinct patterns of meningeal enhancement or signal abnormality may be observed with MRI. The dura-arachnoid pattern follows the inner contour of the calvaria ( Fig. 18-17 ), whereas the pia mater–SAS pattern extends into the depths of the sulci ( Fig. 18-18 ). Enhancement or signal abnormality surrounding the brainstem is always of the pia mater–SAS type, in that the arachnoid is clearly separated from the pia mater by the intervening basal cisterns in this region. Although pia mater–SAS enhancement does occur more commonly in the setting of meningitis than with tumor involvement, both inflammatory and neoplastic processes may demonstrate either pattern. A diffuse appearance favors an inflammatory etiologic mechanism, whereas nodular meningeal enhancement suggests a neoplasm ( Boxes 18-2 to 18-6 ).


Infectious
Adjacent petrous apicitis/sinusitis/mastoiditis
Adjacent abscess or cerebritis
Fungal infection (Aspergillus)
Noninfectious Inflammatory
Reactive
Calvarial metastasis
Subdural or epidural hematoma
Acute infarction
Iatrogenic: catheter or craniotomy
Sarcoidosis
Neoplastic
Meningioma
Breast carcinoma
Prostate carcinoma
Lymphoma
Posttransplant lymphoproliferative disorder (PTLD)
Infectious
Bacterial (unusual)
Noninfectious Inflammatory
Reactive
Diffuse calvarial metastases
Extensive subdural hematoma
Iatrogenic: response to catheter or craniotomy
Low intracranial pressure states
Cerebrospinal fluid leak
After lumbar puncture (unusual)
Spontaneous intracranial hypotension (rare)
Hypertrophic cranial pachymeningitis (rare)
Wegener’s granulomatosis (rare)
Multiple sclerosis (rare)
Neoplastic
Breast carcinoma
Prostate carcinoma
Infectious
Bacterial meningitis
Tuberculous meningitis (basal)
Fungal (Aspergillus, Cryptococcus, Coccidioides)
Viral (herpes)
Adjacent abscess or cerebritis
Spirochetal (neurosyphilis)
Noninfectious Inflammatory
Reactive
Sarcoid
Subarachnoid hemorrhage
Multiple sclerosis (rare)
Vascular
Pial vascular malformation (e.g., Sturge-Weber syndrome)
Subarachnoid hemorrhage
Superficial siderosis
Granulomatous angiitis
Hamartomatous
Meningioangiomatosis
Neoplastic
Primary CNS
Glioblastoma multiforme
Astrocytoma
Primitive neuroectodermal tumor
Medulloblastoma
Germinoma
Ependymoma
Secondary neoplasm
Melanoma
Breast carcinoma
Lung carcinoma
False-positive on FLAIR image
Normal, hyperintense cortex (especially at convexities)
Susceptibility artifact
Prominent pial vessels
Flow artifact (especially in basal cisterns)
CNS, central nervous system; FLAIR, fluid-attenuated inversion recovery.
Infectious
Bacterial
Spirochetal
Neurosyphilis
Lyme disease
Viral (“aseptic”) meningitis
CMV
Varicella-zoster (spinal in AIDS)
Noninfectious Inflammatory
Reactive
Irritative (“aseptic”) meningitis
Response to foreign material:
Contrast agents
Chemical (e.g., ruptured dermoid)
Subarachnoid hemorrhage
Vascular
Subarachnoid hemorrhage
Neoplastic
Primary CNS
AIDS lymphoma
Glioblastoma multiforme
Astrocytoma
Primitive neuroectodermal tumor
Primary leptomeningeal gliomatosis (very rare)
Secondary neoplasm
Melanoma
Breast carcinoma
Lung carcinoma
False-positive result on FLAIR image
Concatenated saturation pulse
AIDS, acquired immunodeficiency syndrome; CMV, cytomegalovirus; CNS, central nervous system; FLAIR, fluid-attenuated inversion recovery.
Dura-arachnoid pattern.
Because the dura and arachnoid are closely approximated, the distribution of meningeal enhancement does not reliably distinguish purely pachymeningeal (dural) from leptomeningeal (arachnoidal and pial) involvement. As a result the dura-arachnoid pattern of enhancement does not imply that the leptomeninges or the SAS is spared. This fact has practical importance because some authors report a lower incidence of positive CSF cytologic findings with the dural pattern, in contrast to the pial pattern, implying a lack of SAS neoplasm.
A surprisingly moderate rate (55%) of positive CSF cytologic results was reported in a subset of 11 patients with a dura-arachnoid enhancement pattern on MRI. The presence of malignant cells in the CSF of patients in this subgroup implies neoplastic involvement of the arachnoid and SAS. This confirms the limitation of MRI in distinguishing abnormal enhancement of the dura from that of the arachnoid. When restricted to the dura, however, meningeal carcinomatosis often results in negative CSF cytology; in this setting, MRI can play an important role in disease detection.
The dural tail sign, once considered specific for meningioma, may be observed in a wide variety of other extraaxial lesions, including schwannoma ( Fig. 18-19 ), dural metastases ( Fig. 18-20 ), lymphoma, tuberculoma, and sarcoidosis. Occasionally a dural tail may be seen in association with intraaxial mass lesions such as gliomas or non-CNS metastases. Although this imaging feature has been useful in suggesting the diagnosis of meningioma, its lack of specificity may occasionally cause misleading interpretation of MRI. Similar signal, shape, and enhancement characteristics found with several of these lesions may further confound the distinction between meningiomas and other entities.


Pia mater–subarachnoid space pattern.
Similarly, the pia mater–SAS pattern of enhancement may reflect neoplasm within the SAS, tumor infiltration of the pia mater, or both. The pia mater–SAS pattern is more common in patients with infectious meningitis than in those with a neoplasm, although the pia mater–SAS distribution is not at all specific for inflammation.
A higher rate of positive CSF cytologic findings has been reported in conjunction with the pia mater–SAS pattern than with the dura-arachnoid pattern of enhancement in cases of neoplasm. This may reflect the anatomy of the blood-brain barrier with respect to the meninges. The dura lacks a blood-brain barrier because its capillary endothelium has a discontinuous cell layer, whereas the outer layer of the arachnoid has capillaries with a continuous cell layer and tight junctions. Bloodborne neoplastic cells, therefore, may gain access to the dura more easily than to the SAS. A pia mater–SAS pattern may reflect SAS enhancement, pial enhancement, or both. Gadolinium may leak through capillary tight junctions that have been disrupted by neoplastic invasion of the meninges and directly enter the CSF.
Related posts:
Stay updated, free articles. Join our Telegram channel

Full access? Get Clinical Tree


