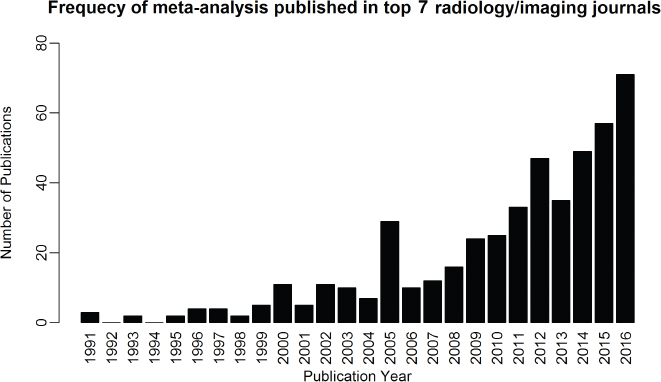
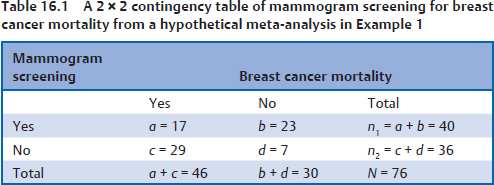
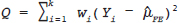
16 • To explain basic statistical and methodological issues related to meta-analysis. • To explain concepts of effect measures. • To explain two broad modeling approaches: fixed versus random effects model. • To discuss heterogeneity and its implications. • To provide examples of different meta-analytic applications including intervention and diagnostic test accuracy (DTA) reviews. Meta-analysis is a statistical method that combines findings from multiple studies that aim to address the same clinical and scientific question. Meta-analysis methods are used in a wide range of disciplines including medical, social, and educational research. Broadly speaking, meta-analysis may be conducted to achieve two objectives: synthesis and analytic goals. In the context of the synthesis objective, a well-conducted meta-analysis allows for estimation of parameters of interest with better precision and may enable detecting genuine effects with increased power. The analytic goal allows understanding of inconsistencies in effects across studies, exploring potential reasons for the inconsistency, and generating new hypotheses that can be evaluated in a new prospective study. Meta-analysis has a broad application and combines estimates across studies for different purposes such as evaluation of intervention effect for clinical outcomes or prognosis and assessment of accuracy of a diagnostic test. Both experimental and observational study designs are amenable to meta-analysis. Experimental studies include the common parallel group randomized controlled trials (RCTs) as well as nonstandard designs such as cluster randomized trials and cross-over trials. Studies assessing the accuracy of a diagnostic test are observational in nature. However, it is possible to have RCTs within a meta-analysis if the purpose of the review is to combine the effects of performing a diagnostic test vs. no such test on some clinical endpoint. The meta-analysis model choice depends on the nature of the outcome of interest. Meta-analysis can be applied to synthesize effect measures that are calculated from a variety of underlying data structures. Distributional assumptions that reflect the nature of the underlying variables dictate the statistical modeling framework that is used to estimate the relative treatment effects. Meta-analysis has gained increasing popularity in medical research over the last three decades and radiology is no exception. To show an example of the growth in applications of meta-analytic models in medical imaging, journals falling under the subject category “Radiology, Nuclear Medicine & Medical Imaging” were searched and sorted the journals based on their 5-year impact factor and considered the top seven journals (starting from highest 5-year impact factor: Human Brain Mapping, Neuro Image, Circulation Cardiovascular Imaging, Radiotherapy and Oncology, Radiology, JACC Cardiovascular Imaging, Journal of Nuclear Medicine, Investigative Radiology, Medical Image Analysis, and European Journal of Nuclear Medicine and Molecular Imaging) in our search for articles focusing on meta-analysis. Fig. 16.1 presents the number of articles published per year until December 31, 2016, in 10 high-impact journals indexed in Ovid Medline in the field of imaging and radiology (search conducted in May 2017). The figure clearly shows the increasing trend of meta-analysis publications in radiology over time, consistent with what is observed in other medical disciplines. Effect measures represent parameters of interest and vary depending on the type of study as well as the nature of the outcome variable. Here some of the commonly used effect measures in meta-analysis of medical studies are discussed. a. Binary outcome variables: effect measures commonly used include risk difference (RD), risk ratio, also known as relative risk (RR), and odds ratio (OR) b. Continuous outcome variables: effect measures include mean difference (MD), standardized mean difference (SMD), and ratio-of-means (RoM) c. Count outcome: effect measure commonly used is rate ratio (RR) d. Time-to-event outcome: a common effect measure is hazard ratio (HR) RD, RR, or OR can be used as effect measures when the interest is in evaluating the effect of performing (vs. not performing) a diagnostic test on a binary clinical endpoint. Example 1 illustrates a meta-analysis assessing whether mammogram screening for breast cancer (screening group) compared to no screening (control group) is more effective in preventing breast cancer mortality. Here, the data from the first study in that hypothetical example of meta-analysis are presented in Table 16.1 to illustrate how the estimates of the effect measures can be obtained. Here, n1 = a + b and n2 = c + d represent the number of subjects randomized to screening and control groups, respectively, in the study. If pe and pc are the risks of breast cancer mortality in screening and control groups, respectively, then their estimates are obtained as: The risk difference of the screening group and control group is estimated as The relative risk in the screening group compared to the control group is The odds ratio, which is the ratio of the odds of dying in the screening group to the odds in the control group, is The estimate of RD of −0.381 is interpreted to mean that the breast cancer mortality rate dropped by 38.1% when women were screened for breast cancer. The estimate of RR of 0.527 indicates that the risk of mortality in the screening group is only 52.7% of that of the group of those not screened for breast cancer, a relative risk reduction of 47.3%. The OR is difficult to interpret as it cannot be directly expressed in terms of risk. Here, the odds of mortality are 0.178 in the screened women compared to those who were not screened. However, for a rare outcome, OR approximates RR and may be interpreted in terms of risk. The estimates of RD, RR, and OR are random quantities and therefore have associated variances, or standard errors (SEs). The point estimates along with the corresponding variances allow proper statistical inference to be made (e.g., 95% confidence intervals for the underlying parameter, p value for hypothesis tests, etc.). Mathematical details of variances are not provided here. a. Sensitivity (true positive rate) and specificity (false positive rate) b. Likelihood ratios for: positive test result (LR+) and negative test result (LR−) c. Diagnostic odds ratio (DOR) In meta-analysis of diagnostic test accuracy (DTA) studies, the most widely used effect measures are sensitivity and specificity of a test. Sensitivity, also called the true positive rate (TPR), is the proportion of the positive test results for a condition (e.g., disease) among all subjects with a condition (confirmed often by the existing gold standard or reference test), whereas specificity, also called the true-negative rate (TNR), is the proportion of negative test results for a condition among all subjects without the condition. Note that the false-negative rate (FNR) of a test is (1 − sensitivity), and the false-positive rate (FPR) is (1 − specificity). Very high sensitivity and specificity (i.e., close to 1) are indicators of an accurate test, whereas sensitivity of 0.50 or lower and specificity of 0.50 or lower indicate that the test is no better than tossing a coin to diagnose a disease or a health condition. Positive likelihood ratio or likelihood ratio for a positive test result (LR+) is the ratio of the proportions with positive test results among those with a condition versus those without the condition. Whereas negative likelihood ratio or likelihood ratio for a negative test result (LR−) is the ratio of the proportions with negative test results among those with a condition versus those without the condition. Likelihood ratios have a nice property that allows them to be defined even when a test categorizes a patient’s condition into three or more categories (e.g., no/probable/definite diagnosis for a health condition), whereas sensitivity and specificity can be defined only for binary categories. Diagnostic odds ratio (DOR) is a single measure of overall accuracy of a test. It is the ratio of the odds of positive to negative tests in diseased subjects to the odds of positive to negative tests in nondiseased subjects.1 Thus, DOR is the ratio of LR+ to LR− when the test result has a binary category. A test with DOR < 1 is worse than randomly calling a case as diseased or nondiseased. In diagnostic accuracy studies, the higher the DOR, the better the test performance is.1 Example 2 provides a meta-analysis evaluating the diagnostic performance of ultrasonography (US) and computed tomography (CT) for diagnosing appendicitis in children, partially following the layout of Doria et al.’s meta-analysis.2 Here, we illustrate how the above test performance measures are calculated using the data from Ang et al.3 The data is shown as a 2 × 2 contingency table (Table 16.2). TP, FN, FP, and TN stand for number of true-positive, false-negative, false-positive, and true-negative, respectively. The estimates of effect measures of interest in the above example of the diagnostic test accuracy study can be calculated as: Here, a sensitivity of 0.912 means that the ultrasonography was able to diagnose accurately only 91.2% of patients with appendicitis, while the test failed to identify 8.8% (false-negative rate) of the appendicitis cases. Similarly, a specificity of 0.887 indicates that 88.7% of non-appendicitis cases were accurately identified as not having appendicitis by ultrasonography, while it wrongly diagnosed 11.3% (false-positive rate) of non-appendicitis cases as having appendicitis. The LR+ of 8.07 means that ultrasonography is 8.07 times more likely to identify appendicitis cases among unhealthy subjects than among the healthy ones. Similarly, the LR- of 0.10 indicates that ultrasonography is 0.10 times more likely to identify non-appendicitis cases among diseased subjects than among healthy subjects. The above DOR tells us that the odds of accurate diagnoses (reporting appendicitis among those with appendicitis and failing to report appendicitis among those without appendicitis) is 81.26 compared to a misdiagnosis. Note that the above calculated sensitivity and specificity (proportions) and LR+, LR−, and DOR (ratios) are estimates and therefore they are inherently variable. The interested reader can refer to Chapter 3 for additional details on how to calculate variances of these estimates and confidence intervals of those effect measures. Suppose k studies are included in a meta-analysis. Each study provides a set of aggregate data Equivalently, the distribution of the estimates Yi is where the inverse variance weight for ith study is: However, we do not know the exact The null hypothesis H0: μ = 0 can be assessed through a Z-test as A value of Z ≤ −1.96 or Z ≥ 1.96 indicates statistical significance (i.e., rejects the null hypothesis H0:μ = 0 in favor of the alternative hypothesis H1:μ ≠ 0) at the level of significance α = 0.05 for a two-tailed test. In diagnostic test accuracy studies with effect measures such as sensitivity, specificity, or DOR, some transformation of these quantities is required to make their distribution approximately normal, an important assumption made in a meta-analysis as described above, before meta-analyzing them. Suppose that DOR is the effect measure of interest; then log transformed values of the DORs and variances of the log-DOR’s estimates from individual studies are used (logit transformations are often applied if the effect measures are the proportions, e.g., sensitivity and specificity). Let Note that when there is no heterogeneity (i.e., when τ2 = 0), the random effects model reduces to a fixed effects model. Also note that the random effect model assigns less weight to larger studies and greater weights to smaller studies than does the fixed effects model; so the combined estimate of effect size from the two models could differ in practice. The choice of fixed or random effects model depends on the presence of different sources of heterogeneity (i.e., clinical and methodological differences across studies) as well as on the extent or degree of heterogeneity estimated or quantified through the data. In the next section, these issues are discussed in more detail. Combining estimates from a meta-analysis is convincing when the results of the studies are similar in direction and magnitude. Heterogeneity refers to inconsistencies in these results beyond chance due to some genuine reasons and therefore the results are less clear when heterogeneity is present. Clinical and methodological differences across studies are the primary reasons for heterogeneous results. In meta-analysis of intervention studies, factors such as older or sicker patients in some studies and younger or healthier patients in other studies can be a clinical source of heterogeneity. In reviews of diagnostic test accuracy studies with effect measures such as sensitivity and specificity (in univariate or bivariate meta-analysis), a common source of heterogeneity is the use of different thresholds, also referred to as “positivity criteria,” across different studies to define a positive or negative test.4 However, this is not a problem when DOR is used as the effect measure because as true-positive rate increases, false-positive rates also increase and hence effects of differing thresholds cancel out while calculating DORs in individual studies.1 Another source of heterogeneity may include not blinding assessors/radiologists about the patient’s history in some studies and blinding them in other studies while reading radiographic tests or images. Heterogeneity is an important issue that must be considered carefully in meta-analysis for a clear interpretation of findings. Generalizing a finding to a case in clinical or diagnostic practice would be easier if the results are homogeneous across studies. The best approach to understanding heterogeneity is by assessing the comparability of studies for important clinical and methodological factors including patient characteristics, types of interventions and comparators, the way outcome variables (endpoints) are defined, time frame, study design, and analysis. Detecting heterogeneity can also be facilitated using graphical/visual approaches as well as formal statistical tests. For example, visual inspection of the forest plot in Fig. 16.2 might indicate that there is some evidence of heterogeneity as the confidence intervals of the estimates of effects in individual studies are in general not tightly overlapped. Heterogeneity can be formally assessed statistically by testing for it, estimating it, and quantifying it. The most widely used statistical test is the Cochran chi-square test,5 often known as the Q test in the meta-analysis literature. The Q statistic (“total variance” of the estimates of effects in individual studies) is calculated as
Meta-analysis
 Learning Objectives
 Introduction
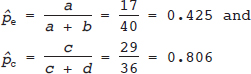
 Effect Measures
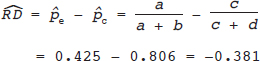
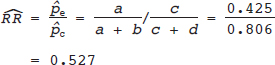
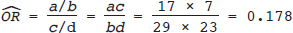
Meta-analysis Evaluating the Effect of a Diagnostic Test on a Clinical Outcome (such as in Intervention Studies)
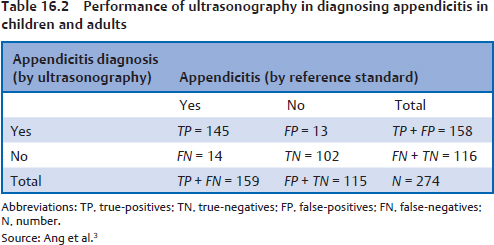
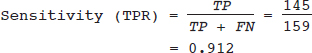
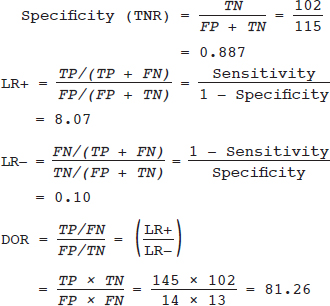
Meta-analysis Assessing the Accuracy of a Diagnostic Test
 Fixed and Random Effects Models for Univariate Meta-analysis
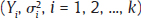 , where Yi is the estimate of the effect measure (e.g., diagnostic log-odds ratio for a diagnostic test) of interest and
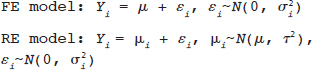
  is the variance of Yi. Broadly speaking, there are two models, namely fixed effects (FE) and random effects (RE) models, to represent the extents of variability in these estimates. FE model assumes that all the studies are performed in an identical population and hence are measuring the same “true effect,” μ, so that any variation in the estimates is only sampling variability (within-study variance). In contrast, the RE model assumes that each study represents a unique population. Therefore, different studies representing different populations have different “true effects,” μi, that are genuinely different beyond sampling variability and are assumed to be distributed around an “average effect,” μ, with a variance, τ2, called “between-study variance.” Mathematically,
 under the FE model, and Yi˜N
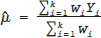
  under the RE model, which dictate the nature of inference about the quantity of interests μ and/or τ2. τ2 depends on the types of effect measures used as well as outcome types. Under the inverse variance weighted estimation, the pooled estimate of μ, interpreted as the “true effect” under the FE model and “average effect” under the RE model, is calculated as
 for the FE model and
 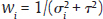 for the RE model. The standard error (SE) of
  , which is the square root of its variance, is obtained as
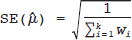
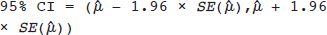
 and τ2 in practice. Therefore, the respective parameters in the weights wi are substituted by the corresponding estimates
  . The 95% confidence interval (CI) for μ is constructed as
 and
and  = variance of
  in study i. Once the weighted mean
  of Yi is obtained using FE or RE model, the pooled estimate of DOR is obtained by back transformation as,
  , and 95% CI of DOR as
  . DOR has an advantage over using sensitivity and specificity as an effect measure in a meta-analysis in the sense that DOR does not depend on the threshold (as the threshold effect cancels out in each study), whereas sensitivity and specificity do.1 However, DOR also loses the information on the individual sensitivity or specificity, which may sometimes be a more useful measure of test performance.
 Heterogeneity: What Causes It? How Can It Be Detected and How Can We Deal with It?
Heterogeneity and Its Causes
Detecting Heterogeneity
Testing for Heterogeneity
Radiology Key
Fastest Radiology Insight Engine