Fig. 1.
Human atrial anatomy, fibres and anatomical effect on scroll. A: Epicardial view of the right atrial surface showing pectinate muscles (PM), cristae terminalis (CT), right atrium (RA) and left atrium (LA). B: Endocardial view of the atria showing anatomical heterogeneity of PM and CT that form “bridges” and “ridges” in the tissue. C: Fibre orientation in the human atrial model where the fibres are colour coded by their horizontal axis component. D: Drift of a scroll wave due to anatomical heterogeneity. The scroll wave initiation location is shown by the red dot, trajectory by the green line, and pinning location by the black square after 40 s (Colour figure online).

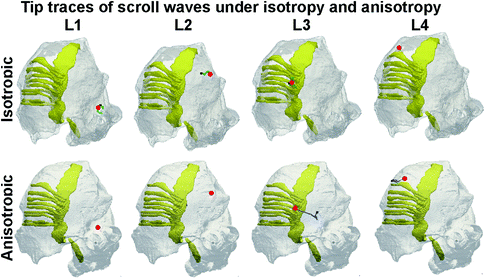
Fig. 2.
Evolution of scroll waves when initiated at sites L1 to L4. In all panels, translucent grey shows atrial wall and solid yellow shows conduction pathways. Start of filaments is shown by a red dot (time t = 0), while end is shown by a black square (time t = 40 s). Isotropic filament tip traces (top panels) are shown in green, while anisotropic filament tip traces are shown in blue (bottom panels). In several instances, the drift of the scroll wave was minimal. Therefore, the start and end points, as well as the tip trajectories are virtually indistinguishable (Colour figure online).
Single Shock Scroll Wave Termination Threshold: Multiple single shock amplitudes and timings were experimented with in the 2D isotropic model. Small stimulation amplitudes (between 0.1 and 1 pA/pF) caused the spirals to displace without termination. Stronger stimuli (1 to 4 pA/pF) eliminated original spiral waves but boundary effects gave rise to secondary wavelets that left the re-entry persistent. A shock of 5 pA/pF was found to terminate the spiral wave activity in the 2D isotropic sheet. In the 3D isotropic anatomy case, the single shock threshold was found to be between 5 and 5.2 pA/pF, while in the anisotropic case it was found to be between 5.2 and 5.6 pA/pF.
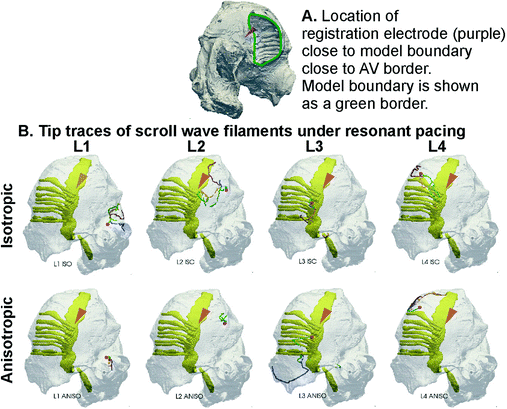
Resonant Drift Pacing in 3D Isotropic and Anisotropic Cases: After quantifying the scroll wave behaviour in 2D, resonant drift pacing was applied to scroll waves in the 3D model as illustrated in Fig. 3. A registration electrode at the right AV border (Fig. 3A), registered a signal, after which a global stimulus was applied. In all simulations, isotropic and anisotropic, it should be noted that the small amplitude of the global periodic simulation of 0.5 pA/pF did not give rise to secondary wavelets and stimulus induced AF, but simply caused the scroll wave to incrementally change its location. Four representative delays of 0 ms, 20 ms, 40 ms, and 60 ms were chosen at each of the four locations to span the scrolls unperturbed period of 80 ms. In the isotropic case with initiation at L1 or L2, a correlation between the stimulation delay and the resonant feedback drift of the scroll wave can be seen from Fig. 3 (top panels). At delay 0, the filament of the scroll wave drifts approximately orthogonally to the line joining the initiation site and the registration electrode (Fig. 3A for electrode location, Fig. 3B, for the isotropic case). Therefore, in case of L1 and L2, an appropriate choice of delay may be chosen to cause the scroll waves to drift towards a model boundary, a large blood vessel opening. The resonant drift trajectory changes as the delay was increased. When the scroll waves are initiated at L3, the anatomical features (locally altering thickness or ridge structures) inhibit a strong correlation between the feedback parameters and the drift trajectory. The drift trajectories show that the resonant drift pacing may not move the scroll waves in a desired direction. In case of L4, the scroll waves drifted along the pectinate muscle ridge. In this case, the resonant drift stimulation combined with the anatomical perturbation due to the ridge formed by the PM-atrial wall and caused the scroll to drift along the PM ridge.


Fig. 3.
3D resonant drift stimulation. A: Location of registration electrode (purple cone) on the model’s back opening of the AV border. B: Registration electrode position is designated by the same purple cone, but now it is on the other side and we see its projection through two atrial walls. In each of the panels, the location of the registration electrode was the same. The stimulation amplitude was taken to be 0.5 pA/pF in all simulations. Shown are the drift trajectories for delay values of 0 ms (blue), 20 ms (brown), 40 ms (beige) and 60 ms (green) in the isotropic case (top panels) and anisotropic case (bottom panels). In case of L2 anisotropic case, the tip trajectories are coincidental at the 4 delay values. In case of L3 anisotropic case, there was a large resonant drift at delay 0 (blue) and 60 ms (green). At the delay 60 ms (green trajectory) the drift was markedly in the same direction which then became coincidental with the delay 0 case. In the L3 anisotropic case, the tip traces for delay 20 ms and 40 ms were highly fragmented and whenever a filament tip was detected there, it was almost coincidental with the delay 0 ms or delay 60 ms cases (Colour figure online).
With anisotropy “on” and scroll wave being initiated at L1, there was only marginal drift due to the feedback stimulation, see L1 bottom row in Fig. 3. In the L2 case (Fig. 3, bottom row), the combination of anatomy and fibre orientation results in all 4 delay cases giving almost identical tip trajectories. In cases of L3 and L4, the scroll wave drift due to the fibre orientation anisotropy was substantially larger. This caused a large scroll wave drift (Fig. 3, L3 and L4 bottom panels). Due to the combined high degree of anatomical and fibre orientation heterogeneity, the scroll wave drifted, led to spiral wave break up, and formation of secondary scroll waves.
Stay updated, free articles. Join our Telegram channel

Full access? Get Clinical Tree


