Fig. 16.1
Incorrect quantification of the 18F-FDG activity in the brain due to the head motion causing misregistration between the CT and PET on the left. Software registration of the CT to the PET data improves the quantification (Reproduced from the Pan and Zaidi [61]; with permission)

Fig. 16.2
Top panel shows the coronal and axial view of a patient study whose CT and PET data were not registered in the heart and the liver due to patient motion. Bottom panel shows the results of a two-stage registration: one for the heart and one for the liver. There were discontinuities marked by the arrows on the rib cage to indicate the improved registration for the heart and the liver at the expense of rib cage registration
16.1.1 Causes of Artifacts from Respiratory Motion
CT is mostly a 2D whereas PET is a 3D imaging device. A CT scanner is composed of an X-ray source and a bank of detector modules arranged in fan beam, which needs to rotate at least 180° plus 60° fan angle to produce a tomographic image. The detector coverage along the craniocaudal or table direction at the imaging center or isocenter is 2 cm for a 16-slice or 4 cm for a 64-slice GE CT scanner.1 A helical CT scan of 100 cm from the orbit to the mid-thigh in a typical PET/CT scan can be performed in less than 20 s on a 16-slice or less than 10 s on a 64-slice PET/CT. The speed of helical CT is determined by the following three components: gantry rotation cycle time, width of X-ray collimation, and pitch factor defined as the ratio of table translation distance per rotation to the width of X-ray collimation. A faster CT scan can be accomplished with a fast gantry rotation cycle time of 0.5 s, the X-ray collimation of 2 cm for a 16-slice or 4 cm for a 64-slice CT, and a pitch factor of 1.375 for the scan speed of 5.5 and 11 cm/s for a 16-slice and 64-slice CT, respectively. On the other hand, combination of a slow gantry rotation cycle time of 1 s, a smaller X-ray collimation of 1 cm for a 16-slice or 2 cm for a 64-slice CT, and a pitch factor of 1 would make the scan speeds of 1 and 2 cm/s for a 16-slice and 64-slice CT, respectively. Note that the pitch factor closest to 1 on the GE CT scanner is 0.9375 ( 15/16 on a 16 slice), 0.96875 ( 31/32 on a 64 slice), or 0.984 ( 63/64 on a 64 slice).
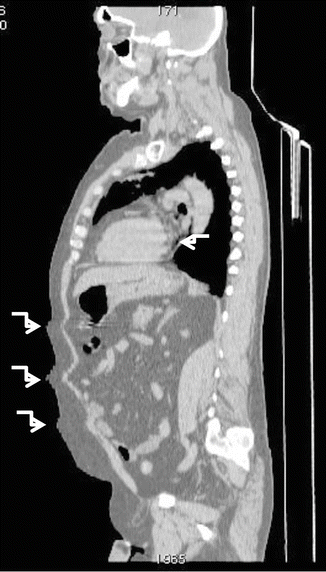
The 3D volume of a CT scan is composed of a stack of 2D CT images acquired in the craniocaudal direction. Fast CT gantry rotation time of sub-second improves the temporal resolution of the CT image to sub-second, making the CT image almost free of respiratory motion artifacts. However, these 2D CT images, almost free of respiratory motion artifacts, cannot guarantee consistency of the 3D CT anatomy in the craniocaudal direction because each CT image is a snapshot of the anatomy at a particular phase of a respiratory cycle when the patient free-breathes during the CT data acquisition of a PET/CT scan. A phase is determined as a percentage in a breath cycle between two consecutive end-inspiration phases, which typically correspond to a local maximum in amplitude. On the other hand, end-expiration phases correspond to a local minimum in amplitude. End-inspiration phase is 0 % and end-expiration phase is around 40–60 %. The maximum and minimum amplitudes are by convention assigned to end-inspiration and end-expiration phases, respectively. An example of the inconsistence is illustrated in the sagittal view CT image of a patient in Fig. 16.3, where the respiratory and cardiac motion artifacts are highlighted.


Fig. 16.3
A sagittal view of a CT scan in PET/CT with the helical CT protocol of 16 × 0.625 mm, 0.8 s gantry rotation, and pitch 1.375:1. There were three skinfold artifacts on the abdomen and some pulsating artifacts on the heart. The speed of CT scan in the table direction is 17.2 mm/s (Reproduced from Zaid and Pan [62]; with permission)
Most of the PET acquisitions today are in the 3D acquisition mode without the septa to improve the sensitivity of detecting annihilation photons of 511 keV. The scan coverage of a GE PET detector module in the craniocaudal direction is 15.4 cm, much larger than the CT detector module of 2 cm for the 16 slice or 4 cm for the 64 slice. The PET detectors are arranged in a ring geometry without space or gap to improve also the sensitivity. The duration of a PET scan at each bed position is typically 2–3 min, and it can be shortened by utilizing a larger axial field of view such as the 21.6 cm detector on the Siemens mCT scanner to further improve the sensitivity of PET imaging. There is no guarantee that the CT images from a fast scan CT at the temporal resolution of sub-second would match temporally with the PET images of a slow PET scan. It is this mismatch in temporal resolution between the CT and PET data acquisitions that causes misregistration between the CT and PET images in PET/CT imaging of a patient at free breathing.
The current design of PET/CT only matches the spatial resolution of the CT and PET data by blurring the CT images so that the spatial resolution of the CT images matches with the spatial resolution of the PET images. There has been no attempt from manufacturers to match the temporal resolutions of CT and PET for a routine whole-body PET/CT scan. For any measure to match the temporal resolution of the PET and CT data, additional acquisition time cannot be too long and post-processing cannot be too cumbersome. It is because the patient normally is asked to position his/her arms over the head during data acquisition of the CT and PET data in order to improve the image quality of the thorax and abdomen. In this position, an average person can maintain stationary for about 15–20 min and not more than 30 min at maximum. Any scan over 30 min is susceptible to patient motion due to discomfort at a still location for a prolonged period of time.
16.1.2 Misregistration of Fast Helical CT and PET
Misregistration between the CT and the PET data is typically identified by a curvilinear white band or photopenic region near the diaphragm in the PET images (Fig. 16.4). Existence of a white band suggests a misregistration near the diaphragm. It is possible to have a combination of good or misregistration at the tumor location and good or misregistration at the diaphragm position. The combination depends on the tumor location, the CT scan speed (cm/s), and the time at which the tumor (at one phase of a breath cycle) was scanned by CT. A tumor may become smaller (or larger) than it really was if the CT scan is in the same (or opposite to the) direction of the tumor motion when the CT scans the tumor. In cardiac imaging, the heart is always nearby the diaphragm. The problem of misregistration can be more of an issue in cardiac PET than in oncological PET.


Fig. 16.4
(Left panel) A patient breath-held at mid-expiration when the CT data had a lower (inferior) diaphragm position than the PET average data of free breathing, resulting in a photopenic region with an underestimation of 18F-FDG uptake. (Right panel) After correction with the average CT data, the photopenic region disappeared, and the SUVmax of the tumor (above the diaphragm) increased by 57 % from 2.3 to 3.6 (Reproduced from Zaidi and Pan [62]; with permission)
Since we tend to spend more time in expiration than in inspiration, the PET data averaged over several minutes is closer to end expiration than end inspiration. If the CT data is acquired near the end expiration, then the CT and PET data will have a better chance of registration with each other. On the other hand, if the CT data is acquired in or near end inspiration, the inflated lungs from inspiration of more air will be larger than the deflated lungs at expiration. The larger area of the inflated lungs in CT renders less attenuation correction in the reconstruction of the PET data near the diaphragm where the inflated lungs push the diaphragm lower toward the feet in CT than the average diaphragm position in PET. The result is a white band region identified as a misregistered region or a photopenic region.
It was reported that respiration-induced artifacts can be reduced in both magnitude and prominence for a free-breathing PET/CT scan by employing CT components of six or more detector rows [21]. The number of skinfolds shown in Fig. 16.3 can be reduced with a fast CT scan by spreading the skinfolds further apart with more CT detector rows. However, a fast helical CT scan of six or more detector rows cannot eliminate misregistration between the CT and the PET data.
Coaching the patient to hold breath at mid-expiration during the CT acquisition was suggested as an alternative to improve the registration between the CT and PET data [22]. However, the outcomes were mixed because coaching the patient to hold breath at a certain state during CT data acquisition is not very reliable from both the perspectives of the patient and the technologist operating the PET/CT scanner. In our study of 100 patients coached to hold breath at mid-expiration, 50 patient data sets exhibited a misregistration of more than 1 cm between the CT and PET data [23]. It was because interpretation of a mid-expiration position can vary from patient to patient. It may not be easy to train a patient or technologist that the breath-hold CT to best match with PET should be taken at the mid-expiration in light breathing not in deep breath in and deep breath out as shown in Fig. 16.5. Adding to the difficulty is that the technologist does not have any measure to ensure the patient follows his/her instructions. However, in a cardiac PET imaging session of only one bed position, it is possible to observe the patient’s breathing pattern in light breathing and to ask the patient to breath-hold at mid- or near end expiration because the CT scan can be completed in 3 to 4 s to scan the single bed position of about 15.4 cm on the GE PET/CT scanner.


Fig. 16.5
A breathing trace of a patient exercising mid-expiration breath-hold during the helical CT scan. The duration of X-ray for both the scout and helical CT is shown at the top. The patient was free-breathing during the scout scan and remained so until a breathing instruction of “breath in, breath out, and hold your breath at mid-expiration” was given to the patient. Although the patient was holding at the mid-expiration in deep breath in and breath out, the mid-expiration state during the helical CT was at a very different breathing state from the average breathing state in free breathing where the patient’s PET data was taken (Reproduced from Pan et al. [23]; with permission)
As long as the CT scan is conducted when the patient is free breathing, there is always a possibility that the CT and the PET data may be misaligned due to the fact that some CT slices are taken at inspiration and some at expiration, whereas the PET data is averaged over several minutes. The distance between two consecutive end-expiration phases can become longer (or shorter) with a faster (or slower) speed helical CT scan typically realized by more CT detector rows. Let us go back to the example in Fig. 16.3, which shows the CT images taken when the patient was free breathing during a CT scan at the speed of 1.72 cm/s. There were skinfold artifacts on the abdomen and cardiac pulsation artifacts on the heart. These artifacts may not be obvious in the review of each individual CT slice. By measuring the distance between the adjacent peaks of the respiratory (cardiac pulsation) artifacts and dividing the distance by the table translation speed of the CT scan, one can estimate the breathing cycle and the heart rate of the patient to be about 4.7 s and 50 beats per minute, respectively. These artifacts were due to the respiration and the heart beatings of the patient.
Three more clinical examples of misregistration in the lungs are shown in Figs. 16.6, 16.7, and 16.8. It was not always the case that the SUVmax will increase with correction of the misregistration artifact with average CT. The changes in SUVmax in Figs. 16.6 and 16.8 potentially indicated a partial response with the same PET data attenuation correction with the free-breathing helical CT and the free-breathing average CT. Figure 16.7 shows an improvement on localization of a lung tumor in both the average CT and the PET data.


Fig. 16.6
(Left panel) The PET/CT data of a patient free-breathed during the helical CT. The panel shows the CT, PET, PET MIP, and fused PET/CT in clockwise. After correction with the average CT, the SUVmax of the tumor increased by 27 % from 10.8 to 13.7 in addition to a consistent registration of the tumor shown in both the CT and the PET images

Fig. 16.7
(Left panel) The PET/CT data of a patient free-breathed during the helical CT. The panel shows the CT, PET, PET MIP, and fused PET/CT in clockwise. The CT shows the tumor in the lungs, whereas the PET shows the tumor in the chest walls. After correction with the average CT, the SUVmax of the tumor decreased by 5 % from 3.9 to 3.7. The CT and PET tumor locations were consistent in the lungs

Fig. 16.8
(Left panel) The PET/CT data of a patient free-breathed during the helical CT. The panel shows the CT, PET, PET MIP, and fused PET/CT in clockwise. The CT shows an 18F-FDG uptake in the low CT density region of the lung parenchyma and by the chest walls. After correction with average CT, the SUVmax of the tumor increased 62 % from 4.6 to 7.5. The uptake is now supported by the soft tissues not in the lung parenchyma, and the tumor against the chest walls was more elevated
16.1.2.1 Frequency of Misregistration and Its Impact
The rate of misregistration can be as high as 68 % [24] to 84 % [25] and may only impact 2 % of diagnosis in the whole-body 18F-FDG PET/CT imaging [26]. However, in the cardiac PET/CT studies, since the heart is adjacent and superior to the diaphragm, it has been shown to cause a false-positive rate of up to 40 % without software registration of the CT and PET data [27]. In a whole-body PET/CT, the tumor(s) of interest may not be close to the diaphragm where most misregistrations occur, and the task of diagnosis may not be compromised by misregistration between the CT and PET data. Since the heart is right above the diaphragm and the diagnostic quality of the cardiac PET imaging is dependent on accurate quantification of the PET data, a more stringent requirement in registration is needed for the cardiac PET/CT than for the whole-body PET/CT.
Most of the modern PET/CT scanners provide a rigid-body registration software utility to help mitigate the problem of misregistration between the CT and PET data. An automatic registration tool has become commercially available to tackle the misregistration issue for the cardiac PET/CT studies [28]. It was found that automatic registration can perform just as well as manual registration and can save time for the technologist to register the CT and PET data. However, it was also noted that automatic registration should be performed only with supervision and when there was misregistration between the CT and PET data to avoid false-negative cases [28].
For radiation therapy, we have reported a study of 216 patients in quantification with SUV and gross target volume (GTV) delineation [24]. There were 68 % of the patients with at least one respiratory artifact, and 10 % of the misregistrations in PET/CT studies could cause an SUV change of over 25 %, which can be a threshold indicating a partial response to therapy [29]. The small tumors of <50 cm3 in size near the diaphragm could have a shift of the centroid tumor location of 2.4 mm and a GTV change of over 154 % and an SUV change of 21 %. It is clear that many whole-body PET/CT exams are with misregistration between the CT and PET data, but only a small portion of the scans with small tumors near the diaphragm could be impacted by misregistration.
16.1.3 Average CT (ACT) of Less Than 1 mSv to Reduce Misregistration
One approach to improve registration between the CT and PET data is to bring the temporal resolution of the CT images to that of the PET data [23]. Recognizing that a PET image is averaged over many breath cycles, a CT image averaged over one breath cycle could approach the temporal resolution of the PET image and register better with the PET image. Figure 16.4 shows an example of misregistration between the CT and PET data and correction of the misregistration by the use of average CT. This concept of average CT is very similar to the one on a stand-alone PET scanner whereby two to three rotating transmission rod sources of 68Ge were used to obtain the transmission map for attenuation correction of the PET data. The transmission map has been shown to register well with the emission PET data [30]. Since most PET/CT scanners are not equipped with transmission rod sources, average CT can serve as an alternative for the transmission rod sources. The advantages of average CT over transmission rod sources are (1) short acquisition time, 1 min for average CT and 10 min per bed position for transmission imaging, and (2) high photon flux and less noisy attenuation maps. The disadvantages are (1) radiation dose of <1 mSv from average CT than about 0.13 mSv from the transmission rod sources [30]. Average CT has been shown to be effective in attenuation correction of the PET data not only in oncological imaging with 18F-FDG but also in cardiac imaging as we demonstrated in reference [31] and confirmed by others [32, 33].
Acquiring cine CT images for average CT can be accomplished by scanning at the same location with a fast gantry rotation of sub-second over a breath cycle of 3–5 s. It does not need to record the respiratory signal while acquiring this type of data on the GE scanner, but GE needs the user to purchase their 4D-CT in order to derive average CT. Other vendors do not even allow data acquisition of a low-pitch helical CT to mimic the cine CT scan mode on the GE CT scanner without 4D-CT. There are two key components in the implementation of the average CT: one is to scan at a fast gantry rotation to achieve high temporal resolution and to minimize motion artifacts in each CT image; the other one is to scan over one breath cycle of 3–5 s to produce sufficient samples of the CT images across the multiple phases of a respiratory cycle to achieve the averaging effect like PET (Fig. 16.9). There is no need to have a respiratory monitoring device in acquiring the cine CT data for average CT as we have demonstrated with an in-house software on the GE CT or PET/CT scanners [31]. Unfortunately, all manufacturers require the purchase of 4D-CT to enable average CT. The conventional approach of using a slow-scan CT of several seconds per gantry rotation to generate slow CT to mimic average CT is not effective and should be discouraged [31, 34]. The slow-scan CT acquires data over one CT gantry rotation of several seconds, typically 2 or 4 s on the GE CT scanner. This scan technique could cause severe reconstruction artifacts. Figure 16.10 shows a clinical example of a patient scanned with the slow-scan CT of 4 s per gantry rotation and the average CT by the cine CT of fast gantry rotation of 0.5 s for 4 s. There were severe reconstruction artifacts caused by the respiratory motion in the images of the slow 4-s gantry rotation because the projection data of the slow 4-s CT were not consistent over one revolution of the CT scan due to the breathing motion, in violation of the basic tomographic image reconstruction principle which requires the imaged object to be stationary during data acquisition. Except some blurring at the boundary of the liver, there were no artifacts in the average CT over a breath cycle of the CT images of high temporal resolution. The average CT and PET data are similar in temporal resolution and the average CT is without the artifacts in the slow CT.


