Movement Disorders, Stroke, and Epilepsy
Nicolaas I. Bohnen
Anatomic imaging, such as computed tomography (CT) and magnetic resonance imaging (MRI), has revolutionized the diagnosis and management of the neurological patient. However, a brain lesion may be present functionally rather than associated with a macroscopic structural abnormality detectable by noninvasive anatomical imaging. For example, anatomical imaging in early idiopathic Parkinson disease may not reveal disease-specific changes, while positron emission tomography (PET) has clearly demonstrated the dopaminergic system abnormalities in this disorder.
PET is a molecular imaging technique that uses radiolabeled molecules to image molecular interactions of biological processes in vivo. Low doses of positron emitting radiotracers are being used for the radiolabeling of molecules or drugs that have binding sites in the brain, such as receptors, follow regional cerebral blood flow, or are metabolized by cerebral enzymes. PET can be used to perform neurochemical and functional brain imaging studies of cerebral blood flow or glucose metabolism.
Neurochemical imaging studies allow assessment of the regional distribution and quantitative measurement of neurotransmitters, enzymes, or receptors in the living brain. Neurochemical imaging studies are mainly performed for research purposes.
Functional brain imaging studies can measure regional cerebral blood flow or glucose metabolism. These studies may be performed in the resting state or following a specific intervention (e.g., a mental task, sensory stimulus or motor task) to “activate” specific regions in the brain.
Imaging of resting glucose metabolism and/or blood flow in the brain represent the major clinical applications of PET in neurology and will be mainly discussed in this chapter. The recent introduction of PET/CT into clinical practice may have limited utility when evaluating small lesions that are better visualized on MRI but offers the advantage of increased spatial accuracy when evaluating normal metabolic variants or artifacts due to partial volume effects. In addition, the intrinsically registered nature of the CT images from PET/CT can be helpful in both lesion localization as well as attenuation correction specific for the patient. PET studies of specific neurochemical markers, in particular dopamine, will also be discussed when clinically useful or promising. The precise correlation of anatomic findings with PET through image fusion is often useful and is facilitated through PET/CT fusion imaging as well as software fusion of PET with MRI images.
General Principles of Cerebral Blood Flow and Metabolic Imaging: Functional Coupling and Physiological Correlates
The energy metabolism of the adult human brain depends almost completely on the oxidation of glucose (1). Because the brain is unable to store either oxygen or glucose, it is thought that regional cerebral blood flow (rCBF) is continuously regulated to supply these substrates locally. The functional coupling of rCBF and local cerebral glucose metabolism has been established in a wide range of experiments using autoradiographic techniques in animals as well as double-tracer techniques in humans. Increased function of the central neurons results in increased neuronal metabolism and, as a consequence, increased concentration of metabolic end products (H+, K+, adenosine) results in increased rCBF (2).
A model has been proposed where neurogenic stimuli via perivascular nerve endings may act as rapid initiators responsible for moment-to-moment dynamic adjustment of rCBF to the metabolic demands (2). Functional activation of the brain (e.g., motor or visual activity) is accompanied by increases in rCBF and glucose consumption but only minimal increases in oxygen consumption (3,4). Therefore, large changes in blood flow are required to support small changes in the oxygen metabolic rate during neuronal stimulation (5). Increased oxygen consumption may result from a combined effect of increased blood flow and increased oxygen diffusion capacity in the region of brain activation (6). Factors other than local requirements in oxygen also underlie the increase in rCBF associated with physiological activation (7).
Oxygen-15 radiolabeled water (H2[15O]) is the most commonly used PET tracer for the measurement of rCBF. CBF can also be assessed by the inhalation of Oxygen-15 labeled carbon dioxide (C[15O2]). The very short half-life of oxygen-15 [15O] (123 seconds) allows repeated and rapid rCBF assessments in the same individual. Fluorine-18 [18F]-fluorodeoxyglucose (FDG) is a PET tracer used for the study of regional cerebral glucose metabolism. The majority of glucose in the brain is needed for maintenance of membrane potentials and restoration of ion gradients. The linking between synaptic activity and glucose utilization is a central physiological principle of brain function that has provided the basis for FDG brain PET imaging (8). Although the FDG PET signal represents neuronal and more specifically synaptic activity (9), glutamate-mediated uptake of the radioligand into astrocytes also appears to be a major mechanism (10). The basic mechanism involves glutamate-stimulated aerobic glycolysis: the sodium-coupled reuptake of glutamate by astrocytes and the ensuing activation of the sodium-potassium-adenosine triphosphatase (Na-K-ATPase) triggers glucose uptake and processing via glycolysis, resulting in the release of lactate from astrocytes. Lactate can then contribute to the activity-dependent fueling of the neuronal energy demands associated with synaptic transmission.
An operational model, the astrocyte-neuron lactate shuttle, is supported experimentally by a large body of evidence, which provides a molecular and cellular basis for interpreting data obtained from functional brain imaging studies (8). In addition, this neuron-glia metabolic coupling undergoes plastic adaptations in parallel with adaptive mechanisms that characterize synaptic plasticity (8).
Reading Brain Pet Images: Normal Variants, Aging, and Other Factors that May Affect Blood Flow or Glucose Metabolism
The spatial resolution of the PET camera determines the extent of the partial volume effect that causes the edges of small brain structures to blur one another due to averaging of radioactivity. Therefore, the size of the imaged structure determines the recovery of counts by the camera from that structure (11). A structure must have dimensions greater than twice the resolution of the PET camera at full width half maximum in order to recover 100% of true tissue activity from that structure.
Partial volume effects may give a blurred or smoothed scan appearance of small brain structures, atrophied gyri, and smaller brain volumes, such as the inferior orbitofrontal and inferior temporal regions. Conversely, a cerebral sulcus, where two gray matter gyri face each other closely, may show relatively higher activity when a scanner does not have sufficient spatial resolution to resolve the two gyri (12). For instance, the pre- and postcentral gyri opposed at the central sulcus may form a single focus of relatively high activity (12). Similarly, the adjacent areas of the insular cortex and the superior temporal gyral cortex generate sufficiently similar FDG activity so that they may appear as one lateral mass at certain levels of scanning (13). Higher resolution PET cameras can help in this regard and are available in some centers.
It should be noted that a normal individual’s brain is not completely symmetric. For example, the sylvian fissure in right-handed individuals is longer and more horizontal in the left hemisphere. Normal irregularity of gyral convolutions may give a heterogeneous scan appearance. Therefore, a commonly observed rule of visual PET analysis is the requirement that an area of apparent functional alteration of a brain structure should be seen on at least several adjacent slices in order to be deemed significant (13). Further, direct correlation with an anatomic imaging study is often required to recognize normal structural variability.
Studies of left-to-right hemispheric asymmetries in normal subjects are limited and have not been conclusive. An rCBF PET study reported slightly higher mean right hemispheric flow compared to left-sided values (14). An rCBF single-photon computed emission tomography (SPECT) study demonstrated consistent hemispheric asymmetry (right side greater than left side) in the cuneus, occipital cortex, occipital pole, middle temporal gyrus, and posterior middle frontal gyrus in 83% to 100% of individuals (15).
FDG PET studies have indicated that hemispheric asymmetries may depend on whether subjects are studied with open versus closed eyes or ears that are covered (16). For example, studies performed on subjects with eyes closed and ears covered demonstrated greater left than right hemispheric glucose metabolism. Subjects studied with closed eyes and ears also had a progressive overall decrease in glucose metabolism, reflecting general sensory deprivation (16). Decreased tracer uptake in the visual cortex is typical as well in patients whose eyes are covered.
Normal Variants
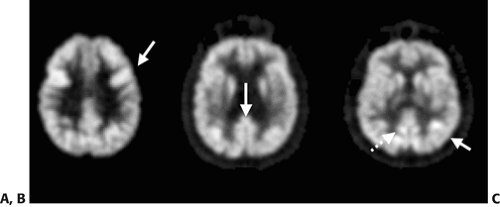
There are several normal variants that should be recognized when interpreting cerebral metabolic or blood flow PET scans. Some normal brain regions have focally more prominent metabolic or flow activity. These include the frontal eye fields (which can be asymmetric), posterior cingulate cortex and adjacent angular gyrus, Wernicke’s region, the visual cortex (when subjects are injected with the eyes open), and an area of more intense uptake in the posterior parietal lobe (Fig. 9.1.1) (17,18).
The frontal eye fields have an approximate dimension of about 1 cm and are located a few centimeters anterior to the primary motor cortex (17). Wernicke’s region is defined as an area of moderately intense activity measuring a few centimeters in size and is located in the posterior-superior temporal lobe. The posterior cingulate cortex is situated superior and anterior to the occipital cortex. An area of focally intense activity in the posterior parietal region is seen in about 50% of the normal population and appears mostly symmetric (Table 9.1.1) (17,18). Basal ganglia to cortex ratios are greater than unity, indicating relatively higher activity in the basal ganglia compared to the average cortex (17). Some brain regions, like the very anterior aspect of the frontal poles, may have less prominent or decreased tracer uptake (17).
Table 9.1.1 Frequency of Prominent Normal Fluorodeoxyglucose Brain PET Variants in the General Population | |||||||||||||||
|---|---|---|---|---|---|---|---|---|---|---|---|---|---|---|---|
| |||||||||||||||
Normal Aging: From Infancy to Adulthood
CBF PET studies in children have shown lower flow values in neonates compared to older children (19). The rCBF will reach adult values during adolescence (19). No major difference in rCBF has been observed between the basal ganglia and cortical gray matter in children with the exception of more prominent occipital flow.
FDG metabolic studies in infants and children have shown that infants less than 5 weeks old have highest metabolic activity in the sensorimotor cortex, thalamus, brainstem, and cerebellar vermis. By 3 months, metabolic activity increases in parietal, temporal, and occipital cortices, basal ganglia, and cerebellar cortex (20). Frontal and dorsolateral occipital cortical regions display a maturational rise in glucose metabolic activity by approximately 6 to 8 months.
Absolute values of glucose metabolic rate for various gray matter regions are low at birth (13 to 25 μmol/min/100 g), and rapidly rise to reach adult values (19 to 33 μmol/min/100 g) by 2 years. Glucose metabolic rate continues to rise until, by 3 to 4 years, reaching values of 49 to 65 μmol/min/100 g in most regions (20). These high rates are maintained until approximately 9 years, when they begin to decline, and reach adult rates again by the latter part of the second decade. The highest increases over adult values have been noted in cerebral cortical structures. Lesser increases have been found to be present in the basal ganglia and cerebellum. This time course of metabolic change matches the process describing initial overproduction and subsequent elimination of excessive neurons, synapses, and dendritic spines known to occur in the developing brain.
An FDG PET study of infants during the first 6 months of life reported glucose metabolic rates for various cortical brain regions and the basal ganglia to be low at birth (from 4 to 16 μmol/min/100 g) (21). In infants 2 months of age and younger rates were highest in the sensorimotor cortex, thalamus, and brainstem. By 5 months, rates had increased in the frontal, parietal, temporal, occipital, and cerebellar cortical regions. In general, the whole brain glucose metabolic activity correlated with postconceptional age, reflecting the functional maturation of these brain regions (21).
A statistical brain mapping study of metabolic aging from 6 to 38 years found greatest age-associated changes in the thalamus and anterior cingulate cortex (22). These findings were explained by relative
increase of synaptic activities in the thalamus, possibly as a consequence of improved corticothalamic connections. Knowledge of the changing metabolic patterns during normal brain development is a necessary prelude to the study of abnormal brain development.
increase of synaptic activities in the thalamus, possibly as a consequence of improved corticothalamic connections. Knowledge of the changing metabolic patterns during normal brain development is a necessary prelude to the study of abnormal brain development.
Normal Aging: From Adulthood to the Elderly
Postmortem studies have shown relatively stable neuronal numbers but loss in cell size and a decreased number of glial cells with advancing age (23). However, it remains a matter of controversy as to whether cerebral perfusion declines with healthy aging. H2[15O] rCBF PET studies have shown a negative correlation between age and rCBF in the mesial frontal cortex, involving the anterior cingulate region (24). Age-related flow decreases have also been reported for the cingulate, parahippocampal, superior temporal, medial frontal, and posterior parietal cortices bilaterally, and in the left insular and left posterior prefrontal cortices (25). It should be realized that the affected areas represent limbic or neocortical association areas and, therefore, bias from possible preclinical dementia cannot be excluded.
It has been suggested that lack of partial volume correction for the dilution effect of age-related cerebral volume loss on PET measurements may be another reason for the observed age-related decline. For example, one study found a significant difference in mean cortical CBF between young/midlife (age range, 19 to 46 years; mean ± standard deviation [SD], 56 ± 10 mL/100 mL/min) and elderly (age range, 60 to 76 years; mean ± SD, 49 ± 2.6 mL/100 mL/min) subgroups before correcting for partial-volume effects (26). However, this group difference resolved after partial-volume correction (young/midlife: mean ± SD, 62± 10 mL/100 mL/min; elderly: mean ± SD, 61 ± 4.8 mL/100 mL/min).
FDG PET imaging studies have shown decreased cortical metabolism with normal aging, particularly in the frontal lobes (17). Temporal, parietal, and occipital lobe metabolism varied considerably among subjects within the same age group as well as over decades (17). Basal ganglia, hippocampal area, thalami, cerebellum, posterior cingulate gyrus, and visual cortex remained metabolically unchanged with advancing age (17). An FDG PET study found bilateral medial prefrontal, including anterior cingulate cortices, and dorsolateral prefrontal reductions with normal aging (27). Brain scans of the aging and atrophied brain will demonstrate widened cerebral sulci, increased separation of the caudate nuclei and thalami, as well as widening of the anterior fissure. However, a Japanese study found that age-associated metabolic reductions that were present in bilateral perisylvian and medial frontal regions largely resolved after correction for partial volume effects (28).
Factors that May Affect Resting Cerebral Blood Flow or Glucose Metabolic Studies
A number of other factors need to be considered when interpreting brain PET images. Metabolism or blood flow activity will be most prominent in gray matter when compared to white matter (about four times higher). It should be emphasized that brain glucose metabolic or blood flow PET images are functional in nature. For example, if a patient is moving or talking around the time of injection, increased activity in specific brain regions like the basal ganglia, motor cortex, or language centers may be present. Subjects studied with eyes open will have increased metabolic activity in the visual cortex when compared to a baseline with the eyes closed (16). An FDG PET study found that passive audiovisual stimulation (watching a movie) led to significant glucose metabolic increases in visual and auditory cortical areas but significant decreases in frontal areas in normal volunteers (29).
Metabolic factors, such as hyperglycemia, may impair cortical FDG uptake (30). Therefore, knowledge of the clinical or behavioral state of the patient at the time of the injection and study is critical for proper image interpretation. As with any nuclear medicine study, better image quality will depend on improved count statistics. Since PET images are an average of radioactivity over a certain period of time, FDG acquisitions taken over 10 to 30 minutes will lead to better image quality compared to short-lasting (1 to 2 minutes) H2[15O] CBF studies.
Drugs are also known to induce cerebral blood flow or glucose metabolic changes. For example, diazepam sedation has been found to reduce cerebral glucose metabolism globally by about 20% (31). A study by Wang et al. (32) found that lorazepam significantly decreased whole-brain metabolism over 10%. However, regional effects of lorazepam were largest in the thalamus and occipital cortex (about 20% reduction). An FDG PET study of propofol sedation in children found significant hypometabolism in the medial parieto-occipital cortex bilaterally, including the lingual gyrus, cuneus, and middle occipital gyrus (33). The bilateral parieto-occipital hypometabolism is likely to be a sedation-specific effect and should be taken into account when evaluating cerebral FDG PET scans in sedated patients.
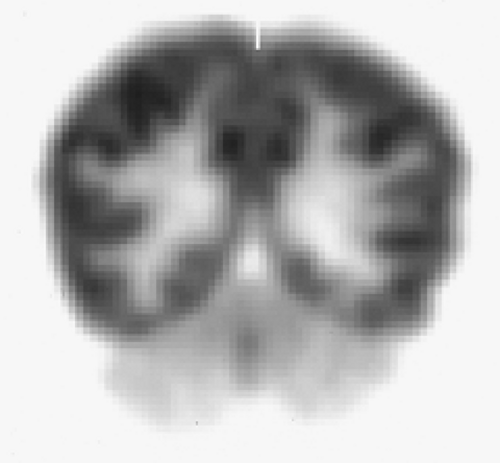
Antiepileptic drugs have also been found to reduce glucose metabolism and rCBF. Studies of valproate have shown global FDG (9% to 10%) and global CBF (about 15%) reductions with greatest regional reductions in the thalamus (34). Phenytoin has been found to cause an average reduction of cerebral glucose metabolism by 13% (35). Cerebellar metabolism may also be reduced by phenytoin, although the effect of the drug is probably less than that due to early onset of uncontrolled epilepsy (Fig. 9.1.2) (36,37).
Lamotrigine may cause regional cerebral hypometabolism in the bilateral thalami, basal ganglia, and multiple regions of the cerebral cortex (38). Studies of the barbiturate phenobarbital and cerebral glucose metabolism have shown very prominent global reductions of about 37% (39). Neuroleptic drugs can cause differential regional metabolic effects. For example, haloperidol caused cerebellar and putaminal glucose metabolic increases, while significant reductions were evident in the frontal, occipital, and anterior cingulate cortex in normal volunteers (40).
Diaschisis: Remote Functional Effects of Focal Brain Lesions
The functional nature of PET images may reveal metabolic or blood flow changes as a result of focal disturbance in another remote but functionally connected brain region. This phenomenon of remote effect is called diaschisis and was originally recognized by Von Monakow (41) in 1914 (42). Diaschisis in the cerebellum was first described by Baron and Marchal (43) in a patient whose PET study showed cerebellar hypoperfusion contralateral to a supratentorial stroke. Remote metabolic depression is characterized by coupled reductions in perfusion and metabolism in brain structures remote from, but connected with, the area damaged by a structural lesion. This effect has been explained as depressed synaptic activity as a result of disconnection (either direct or transneural) (44). Thus, remote effects allow mapping of the disruption in distributed networks as a result of a focal brain lesion.
Diaschisis may also occur as subcorticocortical effects. Subcorticocortical effects may lead to clinical symptoms, like subcortical aphasia due to thalamic or thalamocapsular stroke. Right-sided subcortical lesions may present with left hemineglect (subcortical neglect) (43). Small thalamic infarcts may induce metabolic depression of the ipsilateral cortical mantle (thalamocortical diaschisis) (45). Striatal and thalamic hypometabolism ipsilateral to cortico-subcortical stroke is a frequent finding.
Thalamic hypometabolism may develop a few days after a stroke and presumably represents retrograde degeneration of damaged thalamocortical neurons, whereas striatal hypometabolism probably reflects loss of glutamatergic input from the cortex (43). Crossed cerebrocerebellar diaschisis may occur as early as 3 hours after stroke, is closely related to the volume of supratentorial hypoperfusion, and might be reversible (46). Persistence of diaschisis after stroke is strongly associated with outcome (46).
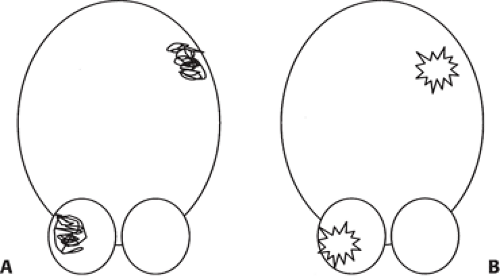
SPECT studies performed as ictal studies during seizure activity have demonstrated a pattern called reverse crossed cerebrocerebellar diaschisis where a supratentorial ictal seizure focus of hyperperfusion is associated with contralateral cerebellar hyperperfusion (Fig. 9.1.3) (47). This phenomenon also can be detected with PET.
Movement Disorders
PET imaging of cerebral blood flow, metabolic pathways, or neurotransmission systems has contributed to researchers’ understanding of the pathophysiology of movement disorders. PET measurements of dopaminergic pathways in the brain have confirmed the importance of dopamine and the basal ganglia in the pathophysiology of movement disorders, such as Parkinson disease. Brain activation studies can be performed using CBF or FDG PET. These studies compare regional brain activity during specific motor or mental tasks compared to control conditions. Activation studies have shown that the basal ganglia are activated whenever movements are performed, planned, or imagined (48). These studies support the existence of functionally independent distributed basal ganglia frontal loops. The caudate–prefrontal loop appears to mediate novel sequence learning, problem solving, and movement selection, while the putamen–premotor loop may facilitate automatic sequential patterns of limb movement and implicit acquisition of motor skills (48). Patients with movement disorders may have abnormal blood flow or metabolism in the basal ganglia (Table 9.1.2).
Cortical changes may represent primary cortical abnormalities or deafferentation effects because of subcortical abnormalities. Patients with movement disorders who also develop dementia typically will show more widespread cortical metabolic or blood flow changes. Table 9.1.3 provides a summary of the major subcortical and cortical glucose metabolic changes in neurodegenerative movement disorders.
Parkinson Disease
Parkinson disease is a clinical syndrome consisting of a variable combination of symptoms of tremor, rigidity, postural imbalance, and bradykinesia (49,50). Although Parkinson disease accounts for most patients who have parkinsonian symptoms, parkinsonism can be seen with neurodegenerative disorders other than Parkinson disease, such as progressive supranuclear palsy (PSP) or multiple system atrophy (MSA) (49). Idiopathic Parkinson disease distinguishes itself from other parkinsonian syndromes by marked left–right asymmetry in symptom severity and good symptomatic response to levodopa therapy (49,50). The additional presence of certain clinical findings may raise the clinical suspicion for an atypical parkinsonian syndrome, such as prominent autonomic dysfunction, cerebellar symptoms, or abnormal eye movements (49).
Table 9.1.2 Examples of Disorders or Conditions with Altered Glucose Metabolism of the Basal Ganglia | ||||
|---|---|---|---|---|
|
Table 9.1.3 Main Regional Subcortical and Cortical Glucose Metabolic Changes in Neurodegenerative Movement Disorders | |||||||||||||||||||||||||||||||||||||||||||||||||||||||||||||||
|---|---|---|---|---|---|---|---|---|---|---|---|---|---|---|---|---|---|---|---|---|---|---|---|---|---|---|---|---|---|---|---|---|---|---|---|---|---|---|---|---|---|---|---|---|---|---|---|---|---|---|---|---|---|---|---|---|---|---|---|---|---|---|---|
| |||||||||||||||||||||||||||||||||||||||||||||||||||||||||||||||
The clinical features of Parkinson disease to a large degree result from loss of nigrostriatal nerve terminals in the striatum secondary to the degeneration of dopamine-producing pigmented neurons in the substantia nigra in the brainstem (51,52). The greater the neuronal loss in the substantia nigra, the lower the concentration of dopamine in the striatum, and the more severe the parkinsonian symptoms. It should be noted that the cellular component of nigrostriatal nerve terminals within the striatum is far less than the number of intrinsic striatal interneurons and projection neurons. Therefore, resting glucose metabolic studies primarily reflect the synaptic activity of interneurons and only to a lesser extent afferent projection neurons.
Resting glucose metabolic and cerebral blood flow studies of patients with early Parkinson disease have shown increased striatal activity contralateral to the clinically most affected body side, which may represent a compensatory mechanism of intrinsic striatal cells (53,54). However, striatal glucose metabolism may decrease with advancing disease (55,56). FDG PET studies have also been used to predict levodopa response in parkinsonian patients. A study found that relatively increased FDG activity in the striatum contralateral to the clinically most affected body side was associated with a good levodopa response. In contrast, relatively decreased striatal FDG uptake was associated with poor levodopa responsiveness (57).
Parkinsonian or Lewy Body Dementia
Alzheimer disease is the most common type of dementia. The second most common form of degenerative dementia in most clinical series is parkinsonian or Lewy body dementia (58). An arbitrary but generally accepted distinction has been made in current international consensus diagnostic criteria between patients presenting with parkinsonism prior to the onset of dementia (Parkinson disease dementia) and developing parkinsonism and dementia concurrently (dementia with Lewy bodies) (59,60,61). These duration-based criteria would diagnose patients with Parkinson disease who subsequently develop dementia more than 1 year after their initial Parkinson disease motor symptoms as Parkinson disease dementia. Patients meeting the 1-year rule between the onset of dementia and parkinsonism would be diagnosed as dementia with Lewy bodies (60).
Although there are relative differences in temporal manifestation and relative severity of clinical symptoms between these clinically defined subgroups of parkinsonian dementia, the underlying neuropathological findings are more similar than dissimilar and suggest these subgroups should be grouped together (62). Parkinsonian dementia is characterized neuropathologically by neuronal losses and Lewy body inclusions in midbrain dopaminergic nuclei (as in Parkinson disease), but involving limbic and neocortical regions as well (58,60).
Cortical neuropathologic changes in Alzheimer disease are heterogeneous topographically but are not randomly distributed. It has been demonstrated that primary somatosensory and motor cortical regions are relatively spared, while association cortices are more severely involved (63). In the Alzheimer brain, FDG PET imaging reveals characteristic hypometabolism in neocortical structures, especially in posterior cingulate/precuneus, parietal, temporal, and to a lesser and more variable degree in frontal association cortices, the same locations where coexisting cortical neuronal degeneration is also found in postmortem studies (64,65). Parietotemporal hypometabolism can also be seen with parkinsonian or Lewy body dementias.
Vander Borght et al. (56) compared metabolic differences between Alzheimer disease and parkinsonian dementia matched for severity of dementia and found similar glucose metabolic reductions globally and regionally, involving the lateral parietal, lateral temporal, lateral frontal association cortices, and posterior cingulate gyrus when compared to controls. However, patients with parkinsonian dementia had greater metabolic reductions in the primary visual cortex and relatively preserved metabolism in the medial temporal lobe.
Decreased occipital metabolism has also been observed in nondemented patients with Parkinson disease (66). Patients with Alzheimer disease showed only mild reductions in the visual cortex but relatively more pronounced reduction in the medial temporal lobe. Metabolic reduction in the posterior cingulate cortex and precuneus demonstrated in Alzheimer disease has also been found in parkinsonian dementia (56) (Table 9.1.4).
Table 9.1.4 Metabolic Differences Between Alzheimer Disease and Parkinsonian Dementia | ||||||||||||||||||||||||
|---|---|---|---|---|---|---|---|---|---|---|---|---|---|---|---|---|---|---|---|---|---|---|---|---|
| ||||||||||||||||||||||||
Progressive Supranuclear Palsy
PSP or Steele-Richardson-Olszewski syndrome is an atypical parkinsonian syndrome characterized by severe gait and balance disturbances, abnormal eye movements (especially vertical supranuclear gaze palsy), and pseudobulbar palsy. More advanced disease is often associated with a frontal lobe type of dementia. Pathological changes consist of neurofibrillary tangle formation and neuronal loss in the superior colliculi, brainstem nuclei, periaqueductal gray matter, and basal ganglia (67).
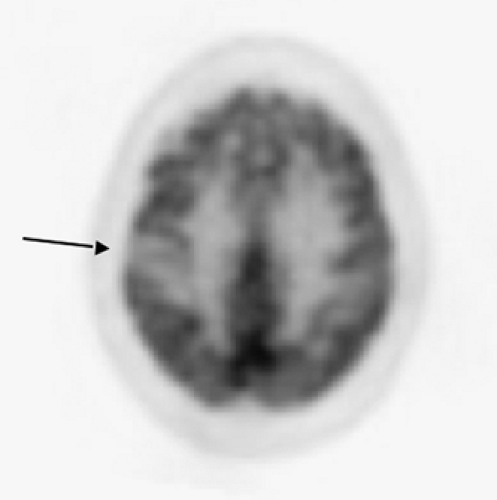
PET studies of patients with progressive supranuclear palsy have shown reduced glucose metabolism in the caudate nucleus, putamen, thalamus, pons, and cerebral cortex, but not in the cerebellum (68). There are significant metabolic reductions in most regions throughout the cerebral cortex but are more prominent in the frontal lobe (Fig. 9.1.4) (69). Although frontal metabolism decreases with increasing disease duration, relative frontal hypometabolism has been found to already be present in the early stages of the disease (70).
Statistical brain mapping studies have demonstrated decreased glucose metabolism in the anterior cingulate, adjacent supplementary motor area, precentral cortex, middle prefrontal cortex, midbrain tegmentum, globus pallidus, and ventrolateral and dorsomedial nuclei of the thalamus (71,72). Clinical parkinsonian motor scores have been reported to correlate with caudate and thalamic glucose metabolic values (70). These data highlight predominant metabolic impairment in subcorticocortical connections in PSP.
Corticobasal Degeneration
Corticobasal degeneration is an atypical parkinsonian syndrome characterized clinically by marked asymmetric limb rigidity with apraxia. Patients may also exhibit alien limb phenomenon, cortical sensory loss, and myoclonus. Cognitive functions are relatively well preserved in most patients. Neuropathological findings consist of swollen, achromatic, tau-staining Pick bodies that may be present in the inferior parietal, posterior frontal, and superior temporal lobes, dentate nucleus, and substantia nigra (73). FDG PET studies have shown significantly reduced cerebral glucose metabolism in the hemisphere contralateral to the clinically most affected side. This reduction can occur in the dorsolateral frontal, medial frontal, inferior parietal, sensorimotor, and lateral temporal cortex as well as in the corpus striatum and the thalamus in patients with corticobasal degeneration (74,75,76).
Statistical brain mapping analysis of patients with corticobasal degeneration have confirmed the asymmetric glucose metabolic impairment in the putamen, thalamus, precentral, lateral premotor and supplementary motor areas, dorsolateral prefrontal cortex, and parietal cortex (77). A Japanese study found the most prominent loss in the parietal lobe in patients with corticobasal degeneration
(78). These results confirm the marked asymmetric cerebral involvement, particularly in the parietal cortex and thalamus, in patients with corticobasal degeneration (Fig. 9.1.5) (72,78,79,80).
(78). These results confirm the marked asymmetric cerebral involvement, particularly in the parietal cortex and thalamus, in patients with corticobasal degeneration (Fig. 9.1.5) (72,78,79,80).
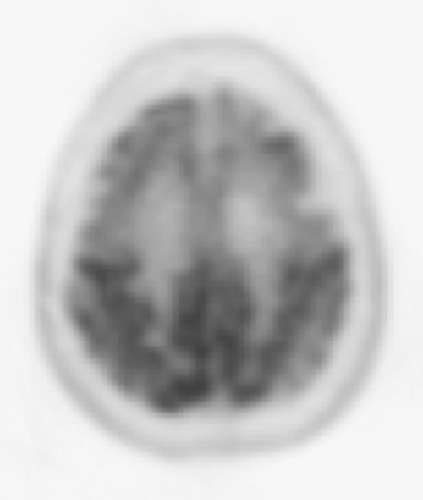 Figure 9.1.4. A fluorodeoxyglucose PET image of patient with progressive supranuclear palsy showing prominent frontal hypometabolism. |
Multiple System Atrophy
MSA is an atypical parkinsonian syndrome covering a clinical spectrum of parkinsonism in variable combination with symptoms of cerebellar ataxia or dysautonomia. This group of disorders includes Shy-Drager syndrome (MSA of the dysautonomia type), olivopontocerebellar atrophy (MSA of the cerebellar type), and striatonigral degeneration, which resembles Parkinson disease but does not respond to dopaminergic drugs. The pathology of MSA is distinct from Parkinson disease and consists of neuronal loss in the substantia nigra, striatum, cerebellum, brainstem, and spinal cord with argyrophilic and glial inclusions (81).
An FDG PET study found reduced caudate, putaminal, cerebellar, brainstem, and frontal and temporal cortical glucose metabolism in patients with MSA compared to normal controls (82). A voxel-based analysis of glucose metabolism found significant hypometabolism in the putamen, pons, and cerebellum in patients with MSA (83).
Reductions of cerebellar and brainstem glucose metabolism have been reported to be most prominent in patients with olivopontocerebellar atrophy (84). Although cerebellar and brainstem glucose metabolism correlated with the severity of MRI-measured atrophy, some patients who had no MR evidence of tissue atrophy still showed decreased glucose metabolism in these regions (85). Patients with the striatonigral degeneration subtype had relatively preserved brainstem and cerebellar glucose metabolic rates (85).
Essential Tremor
Essential tremor represents a variable combination of postural and kinetic tremor. It most commonly affects the hands, but also occurs in the head, voice, face, trunk, and lower extremities (86). Postmortem studies have found evidence of cerebellar degeneration; Lewy body deposition in the brainstem including the locus ceruleus has been found in a subset of subjects (87,88). A PET study found significant glucose hypermetabolism of the medulla and thalami, but not of the cerebellar cortex in patients with essential tremor during resting conditions (89). CBF PET studies using [15O]-water in patients with essential tremor demonstrated abnormally increased bilateral cerebellar, red nuclear, and thalamic blood flow during tremor (90,91,92,93). Therefore, the cerebellum and thalamus appear to play important roles as part of a cerebral circuitry that is abnormally activated during tremor.
Huntington Disease and Choreiform Movement Disorders
Huntington disease is an autosomal dominant neurodegenerative disorder with complete penetrance (94). The gene for Huntington disease, containing an amplified number of cytosine-adenine-guanine (CAG) trinucleotide repeats, is located on the short arm of chromosome 4 (95). Chorea is the most commonly recognized involuntary movement abnormality in adult patients with Huntington disease, but the presence of psychiatric symptoms and dementia may vary (96). Pathologically, Huntington disease is characterized by marked neuronal loss and atrophy in the caudate nucleus and putamen (97,98). Glucose metabolic PET studies in Huntington disease have demonstrated decreased glucose utilization in the caudate nucleus and putamen even before striatal atrophy is apparent on brain CT or MRI scans (99,100,101). Metabolic covariance analysis of FDG PET data of patients with Huntington disease not only demonstrated caudate and putaminal hypometabolism, but there were reductions in mediotemporal metabolism as well as relative metabolic increases in the occipital cortex (102).
Stay updated, free articles. Join our Telegram channel

Full access? Get Clinical Tree


