Diffusion-weighted MRI provides image contrast that is dependent on the molecular motion of water. Diffusion-weighted imaging is the most reliable method for early detection of cerebral ischemia, for the definition of infarct core, and for the differentiation of acute ischemia from other disease processes that mimic stroke. Diffusion tensor imaging and diffusion kurtosis imaging may offer additional diagnostic information on the microstructural status of tissue. This review discusses the development and applications of diffusion-weighted imaging, diffusion tensor imaging, and diffusion kurtosis imaging in acute and chronic ischemia.
Diffusion-weighted imaging (DWI) provides image contrast that is dependent on the molecular motion of water. The method was introduced into clinical practice in the mid-1990s. Because ultrafast MRI sequences such as echo planar imaging (EPI) can be used, DWI is fairly resistant to patient motion, with imaging times ranging from a few seconds to 2 minutes. DWI is the most reliable method for the early detection of cerebral ischemia, for the definition of infarct core, and for the differentiation of acute ischemia from other disease processes that mimic stroke.
Although DWI has been useful in research and clinical management of stroke, diffusion tensor imaging (DTI) and diffusion kurtosis imaging (DKI) may offer additional diagnostic information on the microstructural status of tissue. This is because diffusion in tissue is affected by the presence of semipermeable membranes and oriented microstructures in the intracellular, extracellular, and vascular compartments that result in preferential movement of water parallel to these obstacles. This directional dependence of diffusion is known as anisotropy. In the brain, white matter has relatively high anisotropy because diffusion is much greater parallel than perpendicular to major white matter tracts. Gray matter, alternatively, has relatively low anisotropy. Heterogeneity of the diffusion environment from compartmentalization also results in non-Gaussian probability distribution of water diffusion, which can be quantified by kurtosis. The purpose of this review is to discuss the development and applications of DWI, DTI, and DKI in acute and chronic ischemia.
Basic concepts of diffusion MR imaging
The term, diffusion , refers to the general transport of matter whereby molecules or ions mix through normal agitation in a random way. When describing the mixing of different liquids or gases, diffusion is described in terms of a concentration gradient of the diffusing substance. In biologic tissues, the driving force is the motion of water within water, driven by thermal agitation and commonly referred to as Brownian motion. For example, the path of a pollen grain suspended in water provides good visualization of this Brownian motion. After each displacement, there is a collision and then a new random orientation for the next displacement, with a succession of n random displacements. In the case of unrestricted diffusion, the particle wanders freely in all directions throughout the medium ( Fig. 1 A). The root-mean-square distance L traversed by the particle in time t is proportional to the square root of the diffusion coefficient D . Because there is no directional variation in the free D , the diffusion is isotropic. For water at 37°C, D is approximately 3.2 × 10 −3 mm 2 /s.
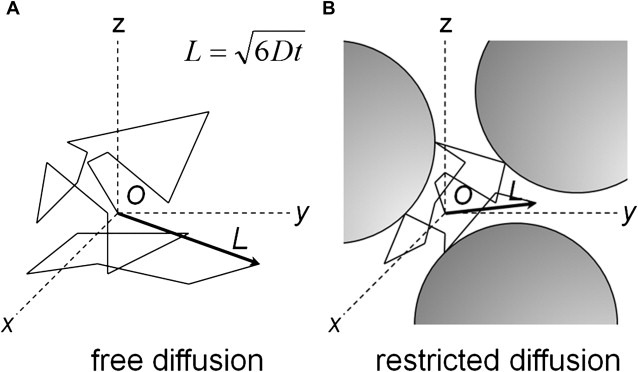
In biologic tissues, water molecules encounter several complex semipermeable structures (see Fig. 1 B), for example myelin and axonal membranes along white matter tracts, and diffusion through them exhibits directionality, or anisotropy, in the orientation of preferred motion. The measured diffusion is greater parallel to the barriers than perpendicular to them.
In vivo measurement of water diffusion with MR imaging exploits the fact that spins moving through a magnetic field gradient acquire phase at a rate depending on the gradient strength and the velocity of the spins. A basic sequence for measuring diffusion is the Stejskal-Tanner pulse sequence ( Fig. 2 ). The method uses a pair of equal but opposite strong gradient pulses placed symmetrically around the 180° refocusing pulse. The effect of the spin echo is to reverse this dephasing (loss of signal due to a fanning out of the spin vectors that do not add coherently) in the interval TE/2 so that an echo, a sum of all spin vectors, is formed at a time TE/2 after the application of the 180° pulse. The effect on the spin system of the first gradient lobe before the 180° pulse is to increase the rate at which the various spin vectors fan out, resulting in a faster signal decay. The gradient lobe after the 180° pulse is polarity reversed relative to the first lobe so that the total gradient dephasing is zero in static tissues.
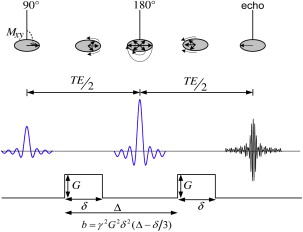
If the spins are moving, however, during the second gradient pulse, they undergo a different overall phase change because they are in a different magnetic field from where they were during the first pulse. The result is a weaker echo compared with stationary tissue because of the incomplete rephasing of the MR imaging signal. Because spins undergoing diffusion exhibit random motion, each spin within a voxel ends up with a different amount of phase at the end of the second gradient lobe. Because the magnetization vectors of all spins in the voxel are added to form the acquired echo, the spread in spin vectors due to the random motion results in an overall reduction of the echo signal. The measured MR imaging signal loss due to diffusion is given by
where S is the DWI signal intensity, S 0 is the T2-weighted signal with no diffusion gradients applied, b characterizes the diffusion-sensitizing gradient pulses (related to timing, amplitude, shape, and spacing [see Fig. 2 ]), and D is the diffusion coefficient. The DWI signal has a T2-weighted component dependent on the echo time and T2 relaxation time of tissue. The apparent diffusion coefficient (ADC) for a given direction is calculated on a pixel-by-pixel basis by fitting signal intensities to Equation 1 so that
where ln is the natural logarithm function. The actual diffusion coefficient (immeasurable) is complicated by other factors, such as variations in anisotropy, choice of parameters in the b -value, inherent perfusion, and inherent motion. The use of single-shot EPI acquisition decreases imaging time and lessens the effects of motion.
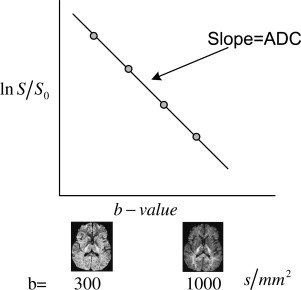
Acquiring multiple DWIs for a series of b -value allows the determination of the ADC ( D ≈ ADC) by pixel-by-pixel least squares fit of Equation 2 ( Fig. 3 ) for a specific gradient direction. In the simplest case, 2 images are obtained—one averaged DWI for a specific b -value (for example, diffusion gradients applied along the x-axis) followed by a reference T2-weighted image ( b = 0) so that ADC xx is obtained from the fit (see Fig. 3 ). The process is repeated to obtain ADC yy and ADC zz .
The DWI, also known as the isotropic image, is calculated as the geometric mean of the 3 DWIs derived from the 3 orthogonal gradient directions ( x , y , and z ), and is given by
The resulting DWI has diffusion and T2 contrast. To remove the T2 weighting, the DWI S is divided by the T2-weighted image S 0 ( b = 0). The exponential image is easily derived from S = S 0 e − bD as
Basic mechanisms underlying restricted diffusion associated with acute stroke
Much of the understanding of the mechanisms underlying DWI changes in acute ischemic stroke is based on experimental animal models of cerebral ischemia. Cerebral ischemia results in decreased diffusion of water molecules within the infarct territory with a rapid decline in ADC values that can be attributed to a combination of complex biophysical factors resulting from disruption of normal cellular metabolism with depletion of ATP ( Box 1 ). These processes result in failure of Na + /K + ATPase and other ionic pumps with loss of ionic gradients across cellular membranes. This results in a net shift of water from the extracellular to the intracellular space with a change in the relative volume of these compartments as well as alterations in their microenvironments. Although the physiologic basis for the restricted diffusion associated with acute stroke is still under investigation, 3 major mechanisms have been described: (1) changes in relative volumes of the intracellular and extracellular spaces, (2) increased extracellular space tortuosity, and (3) diminished cytoplasmic circulation/microstreaming in the intracellular compartment. Some of the key investigations and controversies pertaining to mechanisms of DWI changes are discussed (see Box 1 ).
- 1.
Failure of Na + /K + ATPase and other ionic pumps with loss of ionic gradients across membranes, net shift of water from the extracellular to the intracellular space, and changes in the intracellular and extracellular space relative volumes
- 2.
Decrease in the size of the extracellular space due to cell swelling with a resultant increase in extracellular space tortuosity
- 3.
Diminished energy-dependent intracellular cytoplasmic circulation/microstreaming
- 4.
Increased intracellular viscosity and intracellular space tortuosity secondary to breakdown of the cytoskeleton and organelles
- 5.
Increased cell membrane permeability
- 6.
Temperature decrease
One widely accepted mechanism for the diffusion changes during cerebral ischemia is that disruption of energy metabolism results in failure of the Na + /K + ATPase pump. This leads to a net shift of water from the extracellular compartment, where the diffusion of water is relatively unrestricted, to the intracellular compartment, where the diffusion of water is relatively restricted. This model is supported by animal studies demonstrating that ischemic infarction is associated with a reduction of Na + /K + ATPase pump activity, that pharmacologic inhibition of the Na + /K + ATPase pump with ouabain results in decreased ADC values, and that nonischemic cytotoxic edema secondary to acute hyponatremia is associated with decreased ADC values. Although many experiments support this theory, others dispute it.
Several reports have demonstrated that alterations in the extracellular compartment result in changes on diffusion MR imaging. Early DWI changes after transient ischemia correlate with shrinkage and re-expansion of the extracellular space. In addition, based on osmotically driven changes in compartment volume in ex vivo rat optic nerve preparations, and assuming that intracellular water and extracellular water constitute approximately 80% and 20% of total water in the brain, respectively, it has been argued that moderate fractional changes in cell volume can result in large changes in the contribution of the extracellular compartment to the ADC. Cellular swelling with associated change in relative compartment volume may result in the decreased ADC seen on MR imaging by increasing the tortuosity of the extracellular space and increasing impedance to diffusion of water molecules.
Additional investigations suggest that changes in the intracellular environment contribute to the decreased ADC associated with acute ischemia. In experiments in which 2-[ 19 F]luoro-2-deoxyglucose-6-phosphate (2FDG-6P) was used as a compartment-specific marker for the intracellular and extracellular compartments, the ADC in both compartments was similarly reduced after cerebral ischemia. Furthermore, experiments using diffusion-weighted MR spectroscopy evaluating intracellular metabolites, such as N- acetyl-aspartate and phosphocreatine or the potassium analog cesium, have demonstrated a decrease in the ADC of the intracellular compartment after ischemia. These changes in intracellular ADC may be secondary to disruption of the cytoplasmic motion of molecules or microstreaming. Changes in tissue temperature and membrane permeability may also play a minor role in the diffusion changes observed with acute stroke.
Diffusion-weighted imaging map interpretation
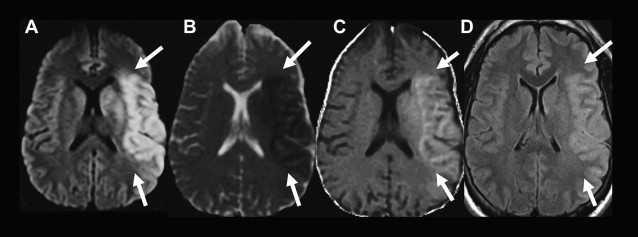
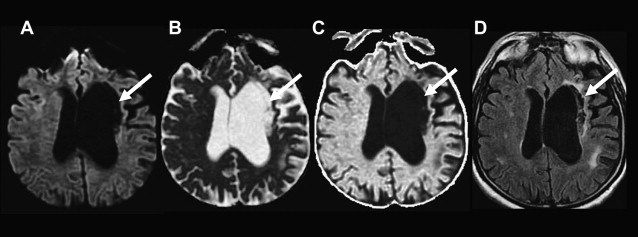
All DWIs (linearly T2-weighted and exponentially diffusion-weighted) should be reviewed with ADC maps (linearly diffusion-weighted, without a T2 component) and/or exponential images (exponentially diffusion-weighted, without a T2 component) ( Fig. 4 ). The use of the ADC map and/or exponential image is essential for proper interpretation of DWIs because both areas of diminished and increased diffusion can appear bright on DWIs. In acute ischemic lesions with restricted diffusion, the T2 and diffusion effects both cause increased signal on DWI, and the DWI has the highest contrast-to-noise ratio. Lesions with restricted diffusion also appear hyperintense on exponential images, but they appear less hyperintense compared with the DWI because there is no T2 effect. Lesions with restricted diffusion appear dark on the ADC map. Conversely, areas of increased diffusion may appear hyperintense, isointense, or hypointense to normal brain parenchyma on DWI, depending on the strength of the T2 and diffusion components, but are hyperintense on the ADC map and hypointense on the exponential image ( Fig. 5 ). When a lesion is hyperintense on both the DWI and the ADC map and hypointense on the exponential image, the phenomenon is referred to as T2 shine-through and may be seen with late subacute infarcts or chronic ischemic lesions ( Fig. 6 ).
Time course of DWI changes associated with acute ischemia
After the onset of acute ischemia, there is a rapid decrease in water diffusion that is markedly hyperintense on DWI and hypointense on the ADC map ( Fig. 7 , 6 and 9 hours; Table 1 ). After the initial ADC decrease, there is a gradual increase in the ADC values secondary to cell lysis and increasing vasogenic edema, with a return to baseline known as pseudonormalization, when the ADC of the nonviable ischemic tissue is similar to normal brain ADC (see Fig. 7 , 5 days). In stroke animal models, ADC values are reduced for a short time period and return to baseline at approximately 24 to 48 hours. In humans, the ADC nadir occurs between 1 and 4 days with a return to baseline at approximately 1 to 2 weeks from symptom onset. The DWI at this stage is typically still hyperintense secondary to T2 effects, whereas on ADC and exponential images the infarct is isointense to normal brain parenchyma. Subsequently, there is a progressive increase in the ADC of an ischemic lesion. This is secondary to gliosis and cavitation that result from breakdown of the normal tissue structure and increase diffusion of water molecules. During the chronic stage, an infarct can be mildly hyperintense, isointense, or hypointense to normal brain parenchyma on DWI depending on the strength of the T2 effects and diffusion components but should be hyperintense on ADC and hypointense on exponential images (see Fig. 7 , 3 months).
| Pulse Sequence | Hyperacute (0–6 hours) | Acute (6–24 hours) | Early Subacute (1–7 days) | Late Subacute | Chronic |
|---|---|---|---|---|---|
| Pathophysiology | Cytotoxic edema | Cytotoxic edema | Cytotoxic edema with small amount of vasogenic edema | Cytotoxic edema and vasogenic edema | Vasogenic edema, then gliosis and neuronal loss |
| DWI | Hyperintense | Hyperintense | Hyperintense, gyral hypointensity from petechial hemorrhage | Hyperintense (due to T2 component) | Isointense to hypointense |
| ADC, MD a | Hypointense | Hypointense | Hypointense | Isointense | Hyperintense |
| Low- b T2 | Isointense | Hyperintense | Hyperintense, gyral hypointensity from petechial hemorrhage | Hyperintense | Hyperintense |
| λ ‖ | Mildly hypointense | Hypointense | Hypointense | Isointense | Hyperintense |
| λ ⊥ | Hypointense | Hypointense | Hypointense | Isointense | Hyperintense |
| FA b | Mildly hyperintense | Mildly hyperintense to hypointense | Hypointense | Hypointense | Hypointense |
| MK | Hyperintense | Hyperintense | Hyperinense to hypointense | Hypointense | Hypointense |
| K ‖ | Hyperintense | Hyperinense to hypointense | Hypointense | Hypointense | |
| K ⊥ | Mildly hyperintense | Hyperinense to hypointense | Hypointense | Hypointense |
a Early reperfusion accelerates time course of MD with earlier pseudonormalization. Lacunar infarctions have slower time course with longer time to nadir and subsequent pseudonormalization. Younger patients with nonlacunar stroke tend to have earlier pseudonormalization.
b Reperfusion results in rapid decrease in FA, reaching a minimum before slowly returning toward baseline.
There is variability in the time course of the DWI and ADC signal changes of evolving infarcts. Several factors, including infarct type, patient age, and reperfusion status, affect the evolution of signal changes on DWI. In one study, the transition from decreasing to increasing ADC values occurred earlier in non-lacunar infarcts than lacunar infarcts. The same study also found a trend toward earlier transition to increasing ADCs of non-lacunar infarcts in patients older than a median age of 66. In another study, there was slightly faster recovery (increase) in ADC values of infarcted gray matter compared with white matter. Early reperfusion after thrombolytic therapy also changes the evolution of diffusion abnormalities (discussed later).
Reliability and pitfalls of DWI in identification of acute ischemic lesions
DWI is highly sensitive (81–100%) and specific (86–100%) for detection of acute ischemia within the first 12 hours after stroke symptom onset, with sensitivities and specificities in the 90–100% range at specialized stroke centers ( Box 2 ). DWI can demonstrate acute ischemic lesions as early as 11 minutes after symptom onset. DWI is superior to conventional MR imaging and CT in the first 6 hours because there is usually insufficient increase in tissue water for reliable detection of hypoattenuation on CT and hyperintensity on T2 and fluid-attenuated inversion recovery (FLAIR) MR images ( Fig. 8 ). In one study, DWI had a sensitivity of 73% and specificity of 92% for identification of ischemic lesions within 3 hours of symptom onset compared with a sensitivity of 12% and specificity of 100% for CT. In another study, DWI had a sensitivity of 97% and specificity of 100% for identification of acute ischemic lesions within 6 hours of symptom onset compared with 58% and 100%, respectively, for conventional MR imaging sequences and 40% and 92%, respectively, for CT. Although infarcts are usually identifiable on CT, T2, and FLAIR images after 6 hours, DWI can also be valuable at later time points because of its higher contrast-to-noise ratio compared with those sequences. DWI has superior sensitivity for identification of small infarcts that may be overlooked on FLAIR or T2 images. It also enables distinction of small recent white matter infarcts from nonspecific T2 hyperintense white matter lesions, which typically have elevated diffusion and are not hyperintense on DWI ( Fig. 9 ).


