Electrode manufacturer
Type of RF electrodes
Alloy
X m (cm3/mol)
Diameter (mm)
Shaft length (mm)
Active tip length (mm)
RF system
Power regulation
Cool-Tip MR
Single/cluster
Titanium
151 · 10−6
1.7
150
Monopolar
Impedance
Internally cooled
20/30
StarBust MRI Semi-Flex [34] (RITA, Mountain View, CA)
Single
Nitinol
245 × 10−6
2.1
120
Monopolar
Temperature
Multitined expandable
20–50
LeVeen MR [11] (RadioTherapeutics, Sunnyvale, CA)
Single
Inconel
182 × 10−6
2.4
150
Monopolar
Impedance
Multitined expandable
35
Elektrotom 106 HiTT [10] (Berchtold, Tuttlingen, Germany)
Single
Titanium
151 × 10−6
1.8
200
Monopolar
Impedance
Saline perfused
15
Single
Nitinol
245 × 10−6
1.8
100/150/200
Multipolar
Tissue resistance
Internally cooled
20/30/40
MR-Adapted RF Generators
When RF ablation and MR imaging are performed simultaneously, the MR images show strong RF interference due to the harmonics of the RF generator (nominal frequency, 500 kHz) that fall within the reception window of the MR receive chain (8.5 MHz at 0.2 T; 63.5 MHz at 1.5 T) and deteriorate the image quality to a great extent. The sources of interferences from the RF generator are (1) noise from the power line, (2) white noise from electronic devices in the generator and (3) additional RF noise when the generator delivers RF energy. No commercial RF generators are currently available for MR-guided RF ablation. Therefore, the generator should be placed outside the Faraday cage and connected to the applicators by using MR-compatible extension cables.
In the past, intermittent switching between power application and MR imaging was proposed, but this interfered with energy deposition, lengthened the procedure and rendered ablation therapy less efficient [23]. Different strategies have been suggested to overcome these hardware incompatibilities. External hardware filtering is the most effective technique to suppress the generator noise, compared to software-controlled filtration or keyholing [24]. Stop-band RLC filters, tuned to Larmor frequency and associated with ferrite cores, are implemented in the transmission line from the RF generator to the electrodes (Fig. 61.1). Real-time MR imaging during RF ablation was demonstrated in animal studies, at low and high field strength with a power output up to 200 W [25–27]. In two clinical studies, such filtering provided a mean attenuation of −95 ± 5 dB at 63.5 MHz and was able to restore acceptable SNR of the MR images, regardless of the actual power level and duration for a specific procedure [14, 15].
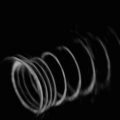
Fig. 61.1
Schematic representation of MR-compatible RF ablation set-up. A commercial RF generator is placed outside the Faraday cage (FC). Coaxial cables connect the RF generator inside the FC Bayonet Neill-Concelman (BNC) connectors placed on a dedicated panel outside the FC. Inside the FC, the AC signal is filtered using, for each of the two lines, six stop-band passive parallel filter cells composed of resistors (R), inductances (L) and variable capacitors (C). The shield of the coaxial cables and the filter is connected to the same potential as the FC. The cable between the filter box and the RF electrode is further filtered using three ferrite cores. The plastic tubes of the water circuit for internal cooling of the electrode go in and out through two waveguides of the FC. The connection of the generator to the RF electrode is performed after the final control of the RF electrode position. RF power is then applied simultaneously with the MR thermometry imaging
Finally, it is noteworthy that the magnetic field does not impair the effectiveness of applied RF energy. No significant difference in coagulation volume and shape was reported between RF ablations performed outside and those performed inside the MR scanner in the range of 0.2–3.0 T [28].
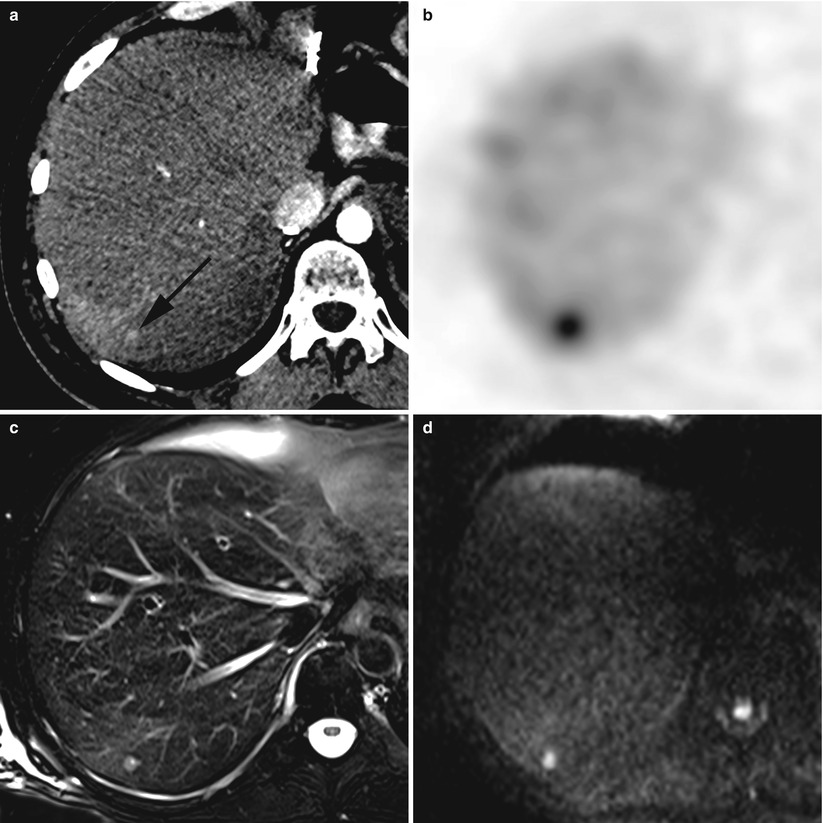
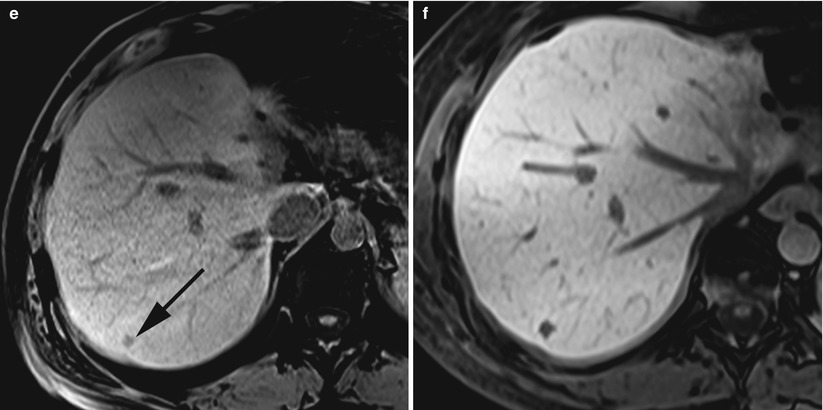
Fig. 61.2
Recurrent hepatic metastasis in a 57-year-old man after caudal pancreatectomy, splenectomy and left hepatectomy for a well-differentiated pancreatic neuro-endocrine tumour. A tiny hypervascular nodule in segment 7 (black arrow) is only visible during the arterial phase of the contrast-enhanced CT (a). Single-photon emission CT image shows an increased 111In-octreotide uptake of this metastatic nodule (b). The nodule exhibits a hyperintense signal on turbo spin echo T2-weighted fat saturated image (c). Diffusion-weighted imaging with high b factor (800 s/mm2) shows a strong hyperintensity of the lesion, corresponding to diffusion restriction of the water molecules within the tumour tissue (d). On T1-weighted fat saturated image, the tumour exhibits a hypointense signal (black arrow) (e). After intravenous injection of Gd-EOB-DTPA, the liver-tumour contrast-to-noise ratio is significantly enhanced on the same T1-weighted acquisition (f)
Steps of MR-Guided RF Ablation
Planning the RF Procedure with MR Imaging
The selection of patients as suitable candidates for RF ablation is based on the staging of the hepatic malignancy, as well as the evaluation of technical feasibility. We believe that MR guidance should be reserved for tumours that are difficult to ablate under US or CT guidance.
The indication for such procedures is generally discussed during multidisciplinary meetings with surgeons, hepatologists, oncologists and interventional radiologists. The main indications are early-stage HCC or unresectable colorectal liver metastases with limited disease (number of nodules ≤ 3; longest diameter ≤ 3 cm) [1, 3]. In addition to state-of-the-art MRI of the liver, imaging work-up includes contrast-enhanced multidetector computed tomography (MDCT) of the thorax and the abdomen combined with or without 18 F-fluorodeoxyglucose positron emission tomography (PET), in order to exclude extrahepatic disease.
RF ablation is technically feasible when a complete coverage of the index tumour by the ablation zone with a 1-cm ablative margin seems possible and safe. Imaging aspects that are particularly important include tumour size and shape, number and location within the organ relative to blood vessels and bile ducts, as well as critical structures that might be at risk for injury, such as the bowel, the gallbladder or the pleura [16].
For planning the ablation procedure, MR imaging is performed at the beginning of the intervention. The RF electrode trajectory is evaluated from the entry point to the target tumour, avoiding critical structures. MR imaging often enables a delineation of the target nodule with regard to surrounding liver parenchyma and structures. Due to its high intrinsic soft-tissue contrast, but also due to the use of contrast agents (Fig. 61.2). Malignant hepatic lesions typically show a hypointense signal on T1-weigthed images and an ill-defined and mild hyperintense signal on T2-weigthed images. The conspicuity of the lesions not sufficiently visible on the unenhanced T1-weigthed images may be improved over a prolonged period after infusion of a contrast media taken up to hepatocytes, such as gadolinium ethoxybenzyl diethylenetriamine pentaacetic acid (Gd-EOB-DTPA, Primovist; Bayer Schering, Berlin, Germany), or taken up to the reticuloendothelial system, such as the superparamagnetic iron oxide-based agent (ferucarbotran, Resovist; Bayer Schering, Berlin, Germany) [29, 30]. Diffusion-weighted imaging with a low b-value (b = 50) may help to detect small hepatic nodules. Moreover, DWI and T2-weighted sequences may be useful to distinguish local tumour progression from a previous RF ablation zone or changes at the site of previous surgical resection.
After acquisition of a high-resolution isotropic GRE T1-weighted with fat saturation, it is possible to determine the trajectory of the RF applicator, by using multiplanar reconstructions (MPR) of the 3D dataset. Localisation of the cutaneous entry point may be performed by using a grid or a marker, or by creating an artefact on the skin, that is visible on the MR images. Two orthogonal and oblique planes including the trajectory line are selected and transferred to a graphical slice-positioning software of an in-room user interface (Interactive Frontend; Siemens, Erlangen, Germany) (Fig. 61.3).
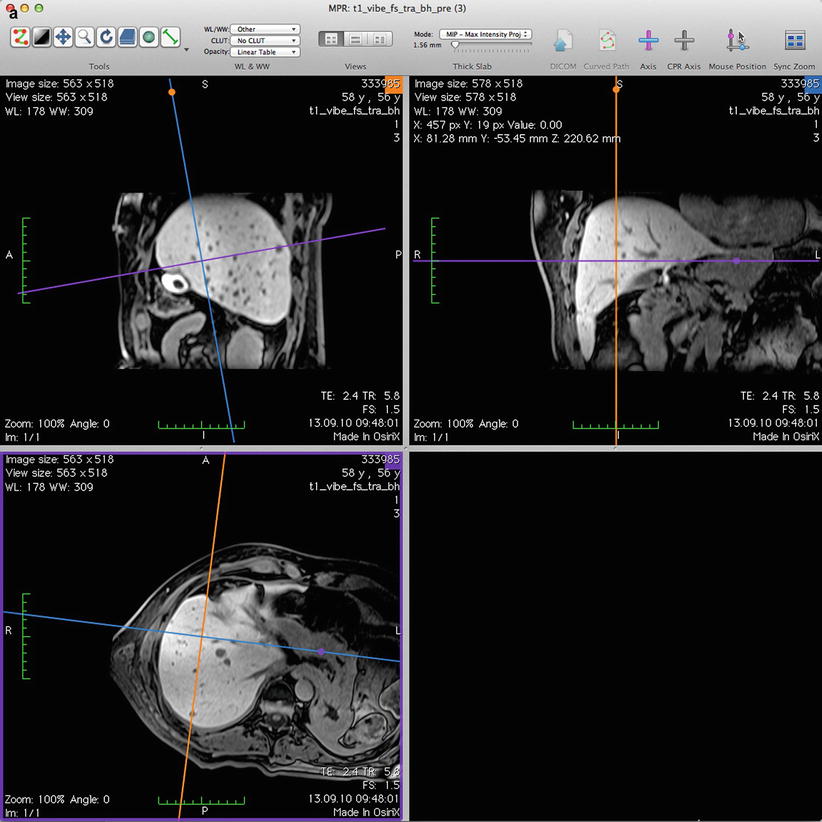
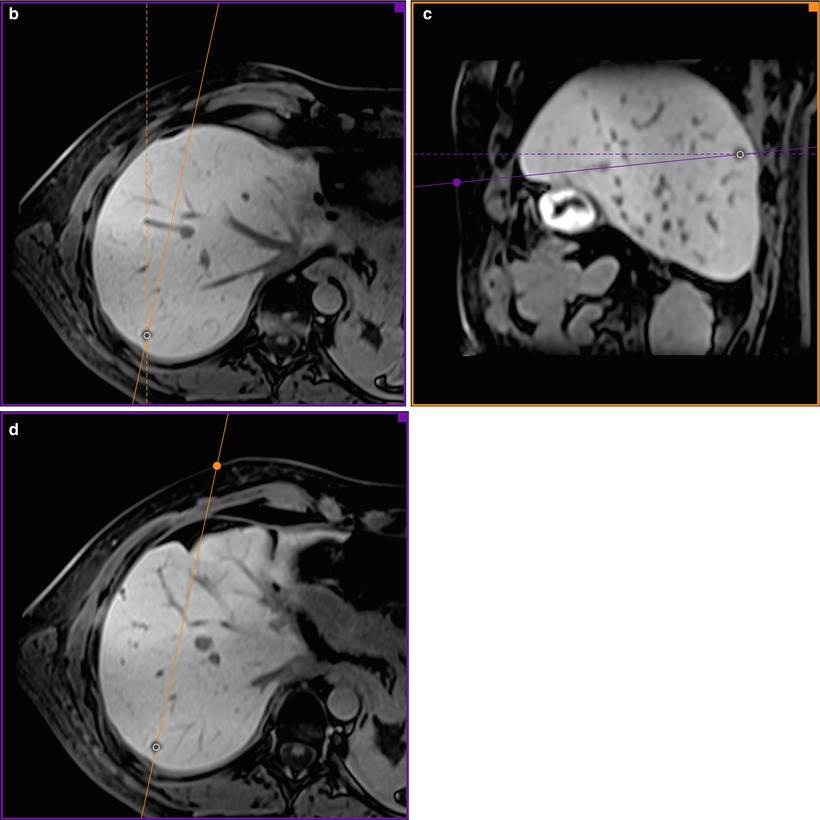
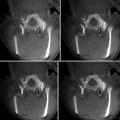
Fig. 61.3
Planning the electrode trajectory before RF ablation of the same nodule shown in Fig. 61.2. The display of the workstation shows 3D multiplanar reconstructions, based on a high-resolution isotropic gradient echo T1-weighted acquisition (a). On the axial plane (b), the sagittal plane is turned around the target tumour from its orthogonal position (dashed line) to the desired oblique position (continuous line). On the oblique sagittal plane (c), the axial plane is turned from its orthogonal position (dashed line) to the oblique position (continuous line). Thus, the oblique axial plane is crossing the cutaneous surface at the entry point (violet point). Now, on the oblique axial plane (d), the oblique sagittal plane (continuous line) also crosses the entry point (orange point). The RF electrode trajectory from the entry point to the target tumour is included on both oblique planes (c and d)
The tumour size and its localisation within the liver determine the length of the active electrode and the number of RF applicators. The length of the shaft needs to be adjusted to the length of the trajectory and the gap between the patient and the MR scanner. Consequently, preprocedural MR imaging for planning the ablation procedure can have an important impact on the accuracy and safety of the treatment.
Targeting with MR Imaging
Targeting describes the step during an ablation procedure that involves placement of the RF electrode into the target tumour [16]. When targeting with MR imaging, a clear delineation of the tumour, the RF electrode and the surrounding anatomy may be obtained in a real-time and multiplanar fashion. Critical structures should not be traversed during the progression of the RF electrode, and a deviation from the supposed trajectory should be minimised.
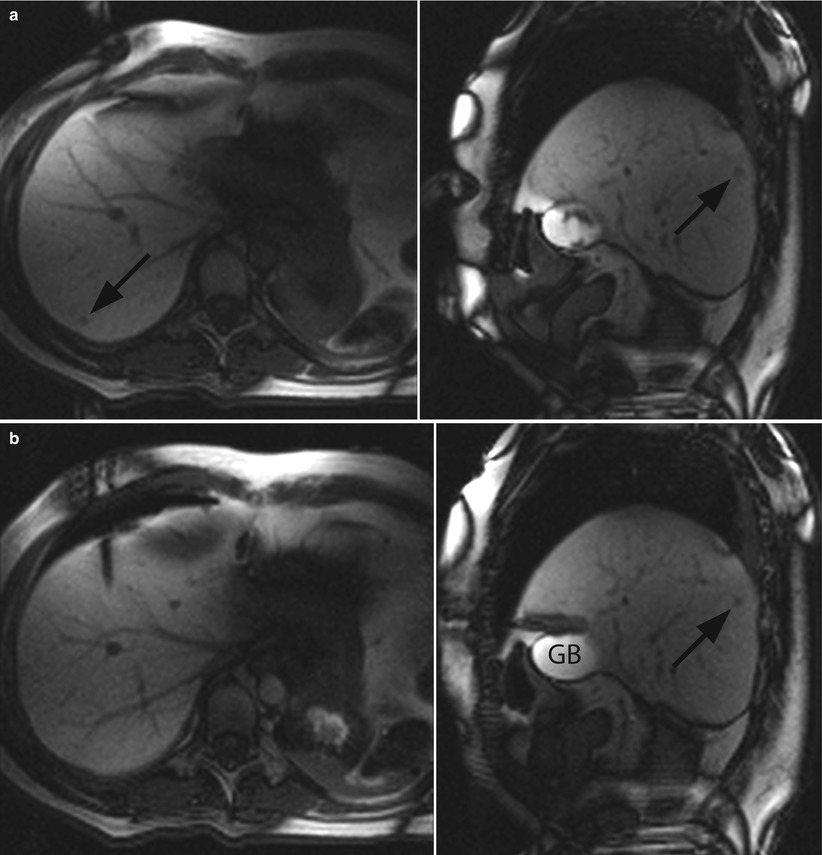
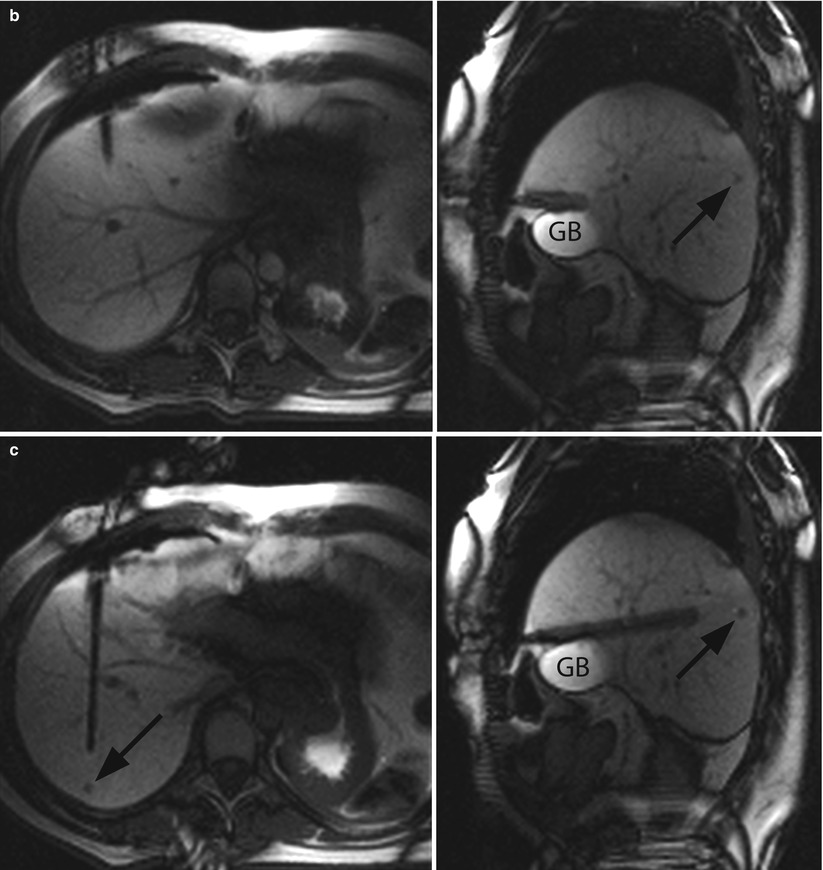
Fig. 61.4
MR-guided targeting of the same nodule shown in Fig. 61.2. The 3D T1-weighted images, reconstructed in both orthogonal oblique planes from Fig. 61.3, have been transferred to the graphical slice-positioning software of the in-room user interface. During targeting procedure, the “fluoroscopic” sequence produces predominantly T1-weighting images in axial (left) and sagittal oblique plane (right). The localisation of the cutaneous entry point is performed by moving the small finger at the skin surface, which is visible on both oblique planes (a). The small metastasis (black arrow) is clearly visualised in segment 7. After initial insertion through the anterior abdominal wall, the RF electrode is moved forward (b). Axial oblique image shows the position of the electrode tip with regard to gallbladder (GB). The “fluoroscopic” images show the progression of the electrode through the liver 5 minutes and 22 seconds after its initial insertion (c). The operator has interactively readjusted its trajectory with the assistance of the in-room user interface and monitor. At the end of the targeting procedure, the final position of the electrode’s active tip within the centre of the tumour is confirmed in both oblique planes (d)
Positioning of the patient depends on the design of the MR system and the situation of the tumour within the liver. In MR scanners with open architecture, tumours located in both lobes are easily accessed with a lateral or a ventral approach when the patient is placed in supine or right lateral decubitus position, respectively. In closed-bore MR scanners, the access in supine position is more limited, and it might be necessary to elevate left flank, in order to facilitate placement of the RF electrode. The MR signal may be received either by a loop surface coil combined with the body coil or by a larger circular-shaped surface coil placed over the area of interest [31]. After placement of a breathing sensor around the chest wall and sticking the grounding pads on the thighs for monopolar RF systems, the patient is draped in a sterile fashion, and a skin incision is made at the entry point.
Initial insertion of the RF electrode is readily feasible within open-bore MR scanners and also in closed-bore scanners when using flexible RF electrodes. MR-compatible ultrasound systems may have a complementary role for the initial insertion of the electrode outside of the magnet when the space inside the closed bore is limited. However, such devices are currently not widely available [32]. Then, the interventional radiologist is moving the RF electrode forward to the tumour target and is following its progression on a magnetically shielded monitor placed next to the magnet bore. Deviations of the RF electrode in the axial and craniocaudal orientations are frequently observed, due to the movement or the deformation of the liver during breathing and must be evaluated and readjusted to the planned trajectory. Integration of robotic assistance into interventional MR systems in the future may be able to reduce such deviations. It may also help the operator who is in difficult position with regard to the magnet bore [33].
A single RF electrode is usually positioned in the centre of a small tumour. In large tumours, it may be preferable to place multiple electrodes at the periphery, in order to obtain an adequate ablation zone. The final position of the RF electrode(s) with regard to the index tumour, including deployment of the probes in case of an expandable electrode, is usually verified on a 3D T1-weighted sequence.
The feasibility of electrode placement with sequential acquisition of GRE T1 or fast imaging with steady-state precession (FISP) images has been demonstrated for both open-bore and closed-bore MR systems [9, 11, 14, 34]. The major drawback of this approach was the step-by-step advancement of RF electrode with intermittent imaging, thus increasing duration of the procedure. Some groups used optical tracking systems within the MR suite. These systems supported the manual targeting during MR-guided liver interventions by a virtual overlay of the electrode track and anatomic images [19]. Since this method had been based on fixed datasets acquired before positioning of the electrode, the main disadvantage of this technique, was a deviation from the planned trajectory due to movement of the target tumour.
Recently, new rapid sequences dedicated to interventional procedures have been specially designed for the interactive placement of the RF electrode into the target tumour. MR fluoroscopy using a balanced steady-state free precession (bSSFP) interleaved radial sequence (IRTTT; Siemens, Erlangen, Germany) offers a real-time feedback of the electrode progression, while the free choice of gradient fields enables multiplanar imaging (Fig. 61.4) [12, 13, 15]. The imaging protocol consists of the following parameters: radial views, 64; sliding window width, 5; repetition time (TR), 4.3 ms; echo time (TE), 2.2 ms; flip angle (FA), 70°; bandwidth (BW) 558 Hz/pixel; matrix, 128 × 128; voxel size, 3 × 3 × 5 mm3 and update rate, 275 ms (approximately 4 frames per second). The bSSFP contrast produces predominantly T2-weighted images, but when necessary, a 90° saturation RF pulse is applied to obtain a predominant T1 weighting, which decreases the update rate to 475 ms (approximately 2 frames per second).
Fluoroscopic MR images are obtained simultaneously on both orthogonal oblique planes, which may be interactively repositioned with an MR-compatible mouse to the actual location of the RF electrode by the operator or a technologist inside the MR suite. Both variants of the bSSFP sequence are useful in the targeting procedure. T1-weighted images show the tumour with a better conspicuity, and the vascular structures are better visualised on the T2-weighted images, whereas width of the susceptibility artefact of the RF electrode is between 6 and 8 mm on both sequence images. With increasing practical experience and after accomplishment of a learning process, it is possible to reduce the targeting time to less than 10 min for one RF electrode placement [15].
Monitoring During RF Ablation
Monitoring describes the sequential or continuous observation of thermal effects occurring in the ablation zone during the ablation procedure [16]. The main goal of monitoring is the determination of the optimal endpoint for the energy application, in order to obtain a complete coverage of the tumour by the ablation zone without affecting any adjacent normal structures at the same time. Conventional techniques used to monitor ablation procedure with commercially available RF systems are based on electrical and temperature parameters. The impedance and tissue resistance provide an integrated information of electrical conductivity, whereas temperature measurement is only possible at the electrode tip, but both methods are not able to provide a localisation of thermal tissue changes. The three-dimensional assessment of the extent and shape of coagulation is only possible with imaging, even though not all image-guided techniques provide the same degree and types of monitoring. US guidance is restricted by hyperechogenic cavitation artefacts, which are observed within the tissue and produced by air bubbles during RF ablation and may remain for hours. When using contrast-enhanced CT guidance, the delineation of tumour tissue and ablation zone is often limited to a short time window after injection of contrast media, and hypovascular nodules often cannot be distinguished from the hypodense coagulation zone. MR imaging currently offers the best conditions for real-time monitoring of changes corresponding to irreversible tissue damage and to perform direct temperature mapping during heat application.
T1- and T2-weighted sequences are feasible in a real-time fashion, but the temporal resolution of long TR T2-weighted sequences does not provide useful information. Furthermore, there is an underestimation of the tissue coagulation zone with T1-weighted images and a slight overestimation of T2-weighted images. The immediate assessment of induced coagulation during the RF ablation by using gadolinium-enhanced T1-weighted imaging, because repetitive monitoring is restricted by the clearance of the gadolinium chelate from circulation.
MR imaging is sensitive to temperature changes, and mapping of temperature has been proven to be feasible, using various MR sequences based on the relaxation time T1, the diffusion coefficient, the equilibrium magnetisation M 0 or the proton resonance frequency (PRF) shift of tissue water. The use of temperature-sensitive contrast agents and proton spectroscopy may provide absolute temperature measurements. The different methods of temperature mapping imply specific advantages and limitations [7]. The excellent linearity and near independence with respect to tissue type, together with good temperature sensitivity, make PRF-based temperature MR imaging the preferred choice for many applications at mid to high field strength (>1 T). A standard deviation of less than 1 °C, for a temporal resolution below 1 s and a spatial resolution of about 2 mm, is feasible for a single slice for immobile tissues. The PRF method usually employs rapid RF-spoiled gradient-echo imaging, but multi-acquisition and multi-echo bSSFP sequences could also be used with a potential for increased temperature sensitivity [35]. Temperature variation ΔT is calculated from phase changes ΔΦ for each voxel obtained at different times, according to the following equation:
 where α is the temperature-dependent water chemical shift (0.01 ppm/°C), γ is the gyromagnetic ratio (268 MHz/T) and B 0 is the field strength. The dynamic series of phase images acquired during heating are used to calculate the increments in temperature by subtracting the phase of the reference phase image from each phase image in the dynamic series. Lipid signal suppression is usually achieved by water-selective slice excitation with binomial pulses, and phase unwrapping is necessary to ensure the continuity of the resulting temperature values.
Segmented gradient-echo echo planar imaging (GRE-EPI) sequence is applied during expirium phase by means of pressure-sensor triggering, with the following parameters: echo train length (ETL), 13; TR, 50 ms; TE, 20 ms; FA, 25°; BW, 1,000 Hz/pixel; matrix, 128 × 128; voxel size, 2.3 × 2.3 × 6.0 mm3 and slice gap, 1.2 mm. Three parallel slices could be acquired in a single plane, with the central slice positioned along the RF electrode. Recent development has allowed the acquisition of three orthogonal slices, a first step toward 3D thermometry. Therefore, acquisition time is 0.6 s per slice and the sampling rate equal to the respiratory frequency. The magnitude and phase images are transferred online to an external PC and are continuously processed with a dedicated software. The baseline temperature value is estimated from the body temperature, which is monitored by a nasopharyngeal transducer. Temperature changes are commonly visualised as a colour-coded temperature map superimposed on a grey-scale anatomical image (Fig. 61.5).
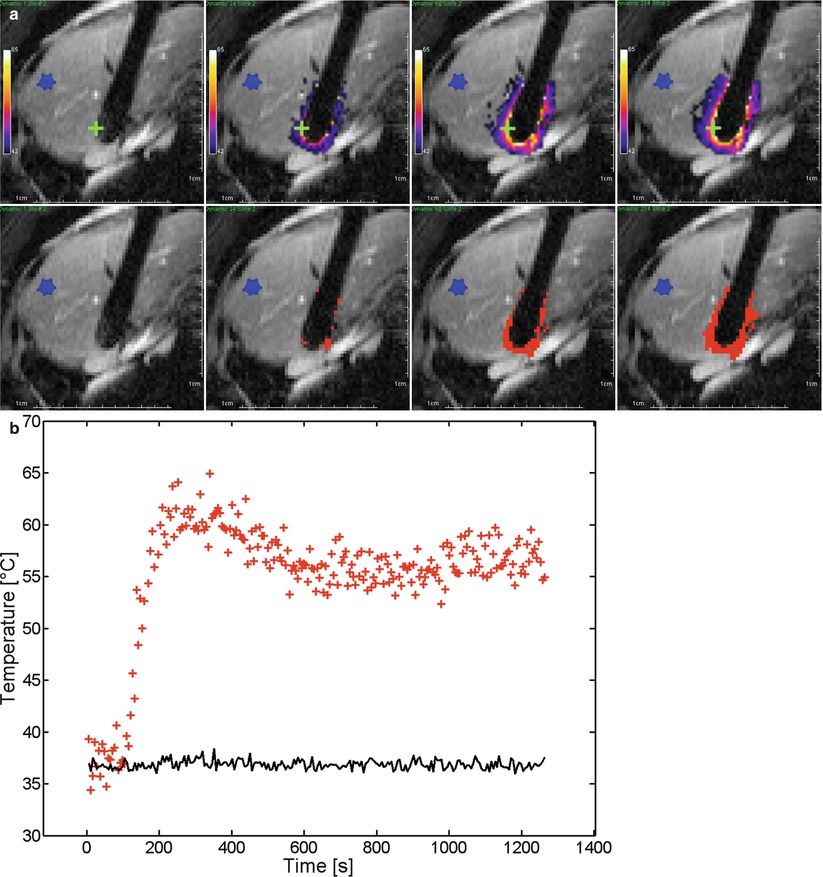
Fig. 61.5
 Visualization and Display for Image-Guided Therapy
 Multimodality Navigation in Neurosurgery
 Image-Guided Robotics in Minimally Invasive Therapies
 Innovations in Ultrasound Instrumentation for Image Guidance
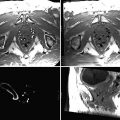 Image-Guided Prostate Brachytherapy
 CT-Guided Interventions: Current Practice and Future Directions


RF ablation with real-time monitoring of the same nodule shown in Fig. 61.2. (a) The successive isotherms (top) and thermal dose (bottom) images on the central slice of GRE-EPI sequence (ETL, 13; TR, 50 ms; TE, 20 ms; FA, 25°; matrix, 128 × 128; section thickness 6 mm; plane, axial) show the time evolution (t = 5.5 s; t = 132 s; t = 330 s; t = 1,175 s) of isotherms and thermal dose maps, respectively. Colour range is set from 42 to 65 °C (top), and regions above one lethal threshold of cumulative thermal dose (bottom), corresponding to 240 equivalent minutes at 43 °C, are shown in red. The width of susceptibility artefact of the RF electrode is 1.8 cm. (b) Graph shows the temperature evolution during the RF ablation on the same time scale. A non-heated ROI was selected (blue ROI in a) to monitor the standard deviation of temperature (SD = 1.0 °C) (continuous black line). One pixel was selected on the thermal maps (green cross in a) to illustrate the temperature time evolution (red crosses). Three phases are observed: the baseline, the rapid increase and the stabilisation of temperature. The uncertainty of temperature in the heated region is higher than in the non-heated region
Related posts:
Visualization and Display for Image-Guided Therapy
Multimodality Navigation in Neurosurgery
Image-Guided Robotics in Minimally Invasive Therapies
Innovations in Ultrasound Instrumentation for Image Guidance
Image-Guided Prostate Brachytherapy
CT-Guided Interventions: Current Practice and Future Directions
Stay updated, free articles. Join our Telegram channel
Full access? Get Clinical Tree
