Fig. 7.1
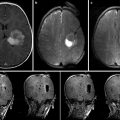
An example neurosurgery planning visualization generated using the 3D Slicer software. Axially acquired structural MRI scan (upper left) with label map volume overlay indicating brain tumor extent and margin. A contrast-enhanced MRI acquisition (lower left) shown in a sagittal MPR of a volume originally acquired in the axial plane. A coronal MPR of diffusion MRI data (lower right) is shown using a color-by-orientation filter. The 3D view (upper right) shows the relative planar positions and orientations of the axial and coronal slices in context with the tumor zone (red) and ventricles (blue). Lines in the 3D view indicate the result of peri-tumoral tractography, performed as part of the planning process to evaluate the tumor’s displacement versus infiltration of the patient’s white matter (Data and image analysis courtesy of Dr. Alexandra Golby and Dr. Ron Kikinis, Brigham and Women’s Hospital)
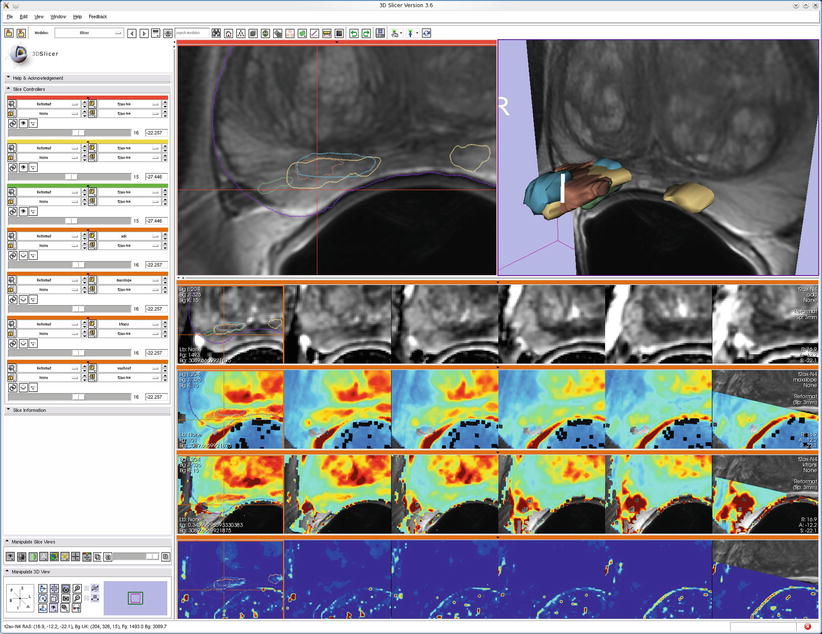
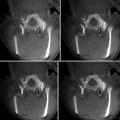
Fig. 7.2
An example of multimodal prostate visualization for therapy planning MRI-guided prostate biopsy in 3D Slicer. The T2 structural MR scans (top two images and first row of image matrix) provide anatomical detail and context for interpretation of various pharmacokinetic maps computed from dynamic contrast-enhanced (DCE) MRI (lower three rows of image matrix) and the apparent diffusion coefficient (ADC) map (first row of the image matrix) calculated from the diffusion-weighted MRI (DWI). Columns of matrix show slice planes of anatomy at 3 mm spacing aligned with T2 acquisition coordinates. Note that structural, DWI, and DCE volumes were obtained at different oblique acquisitions, resulting in partial overlap in right column as slice location cuts through boundary of DCE acquisition volume. A linked cursor allows exploration of corresponding data from all images (visible in upper left and left column of image matrix). Intersections of 3D surface reconstructions of suspected cancer extents based on different MRI estimation approaches (upper right) with slice planes are shown as outlines in the upper left and first column of image matrix to provide anatomical context for interpretation of statistical maps (Data and image analysis courtesy of Dr. Clare Tempany, Dr. Fiona Fennessy, and Dr. Andrey Fedorov, Brigham and Women’s Hospital. Pharmacokinetic maps generated with the Cinetool software (Dr. Sandeep Gupta, GE Global Research))
Images
Of course, the fundamental data type for IGT is image data. Image data is at the core a regularly arrayed numerical collection, typically of physical measurements acquired either before or during therapy. The scope of IGT, however, incorporates a wide range of image types that carry both direct physical measurements and derived datasets, sometimes incorporating manual intervention by clinical staff or the results of automated processing that enhances or augments the data.
With the exception of live video, which directly emulates the human visual system, most image data represents nonvisual physical sensor measurements that are passed through a mapping function for display. The ubiquitous window/level transformation, for example, can map Hounsfield units of a CT image dataset to a continuous tone grayscale display range. Window and level user interface controls can be adjusted to accentuate different anatomy or pathology as required and is often required because the tonal range of the image acquisition exceeds the number of gray levels range visible to the human eye or displayable on a particular device. For example, CT images are traditionally acquired at 12-bit resolution, giving 4,096 distinct density levels, while many display devices are limited to 8-bit (256 level) grayscale display. Window/level adjustment is still the most widely used visualization technique in clinical practice and allows rapid interactive visual assessment of physical measurements beyond what would be possible with a single static image.
Beyond direct mapping to grayscale, various color lookup tables can be applied to provide “false color” to images such as PET scans, where an intense warm color indicates possible tumor activity, or statistical maps, where a red/blue map might indicate the strength of positive and negative correlations with black (or transparent) indicating regions where no statistically significant correlation exists. These mappings are typically embedded in “lookup tables,” which map each value in an image dataset to a color and opacity value for display.
“Label maps” are a special form of image data where the numerical value at each location within the image indicates the content of the corresponding anatomical coordinate. Often label maps are created by segmentation algorithms or through manual identification of structure outlines using a label map editor. Lookup tables used for label maps typically include a text string for each numerical value indicating the name of the corresponding structure. These label map volumes are typically displayed as an overlay layer blended with an underlying grayscale image or in the form of an outline showing the boundaries between labeled regions.
Time-series image data may depict changes to the acquisition parameters (such as sensor motion) or changes in the observed physical situation such as uptake of a contrast agent (as in perfusion or dynamic contrast enhancement (DCE) imaging) or physiological response (as in temperature monitoring in focused ultrasound treatment). Visualization of time-series image data is correspondingly varied, with techniques including displaying the sequence in either fast or slow motion, or collapsing the time series to a single statistical image (as in functional imaging, where the per-pixel strength of correlation to an external stimulus may be displayed as a colored overlay on structural image data).
Image data may also include multiple physical measurements at each sample location. A common example is color imaging, where three components independently store the observed light in the red, green, and blue portions of the visible light spectrum. Clinical systems often find value in measuring the non-visible portions of the electromagnetic spectrum, in which case the visualization system must support mapping operations, not unlike the window/level controls or look up tables, to allow clinicians to view and interpret the extra data. Even more exotic multicomponent image data can be meaningfully acquired, either pre- or intra-procedurally. For example, diffusion MRI scans are sensitive to the per-pixel ability of water to migrate along specified directions and can result in image volumes with dozens or even hundreds of samples per pixel. Direct viewing each of the components has little value, but transformations of this data can provide insight into local tissue structure. For example, the color-by-orientation mode for viewing diffusion tensor MRI data maps diffusivity measures in patient left/right, anterior/posterior, and inferior/superior directions into saturations of red, green, and blue respectively; this mapping allows even a single 2D image slice to convey detailed 3D structural information. Other domain-specific mapping techniques, such as overlay of waveforms in MR spectroscopy, may be required in order to turn a large multicomponent image dataset into a meaningful visualization.
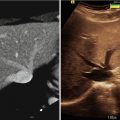
Image acquisition can be broadly divided into two major categories: volumetric and projective. Volumetric studies, including MRI, CT, and Ultrasound, acquire data at specific coordinates in the body with respect to the imaging device. In projective images, such as endoscopic or X-ray images, it is not straightforward to identify the specific anatomical coordinates that have contributed to the formation of a particular image. Because of this distinction, volumetric and projective image data are difficult to integrate into a unified display system. Instead, the projective image data is typically displayed in independent display windows that can be mentally merged by the therapist, while volumetric data can be presented in a unified display with interactive options for comparing the multiple datasets. Alternatively, volumetric data may be transformed into the projection space and overlayed on the projection data.
Post-processed Image Data
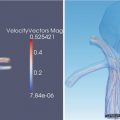
Specially designed acquisition sequences or imaging devices may be used to quantify anatomical structures or physiological functions not directly observable without subsequent processing. Diffusion MRI, for example, can be used as the basis for estimating white matter structures through the application of tractography algorithms. Similarly, custom pulse sequences can be used to detect heart motion, and Doppler ultrasound can be used to measure blood velocity. For visualization, these post-processed results can be mapped to structures such as lines or arrows and, where appropriate, can be animated to enhance clarity.
Transformations
To be usefully applied to IGT, it must be possible for the therapist to correlate acquired and computed data geometrically with respect to actual patient anatomy during treatment. In the most direct case, anatomy and interventional devices are jointly visualized for local supervision; this is traditionally the case, for example, in endoscopic procedures where the endoscopist can see the anatomy, pathology, and instrument in the same video view to guide procedures such as excision or biopsy. Other domains, such as neurosurgical navigation, increasingly rely on co-registration of multiple datasets into a common coordinate system for direct comparison and subsequent registration of the image datasets with the patient anatomy during treatment. Performing these transformations automatically in an IGT system requires the specialized techniques described in Chap. 19. Visual confirmation of these calculations may be based on anatomical landmarks and by estimating patient motion or the results of intervention. Out of necessity, clinicians become skilled at mentally transforming images to account for uncertainty in the calculation of these registrations.
With transformations between, for example, pre- and intra-procedural volumetric data, it is important for the visualization system to be able to allow direct comparison between the images by aligning them to the same coordinate system. It is often helpful to display the images side-by-side, with a linked cursor that allows identification of corresponding points in multiple image sets. It can also be useful to support overlay or subtraction modes to highlight the image differences within a single view. Display of the parameters of the transformation itself, either in numerical or graphical form, is rarely required clinically, but can be a benefit during case planning or when verifying the technical correctness of the registration routine. Because pre- to intra-procedural nonlinear registration has the potential to confound patient motion with pathological or anatomical changes in response to therapy, visual inspection is typically indicated. When required, transformations can be displayed using techniques such as overlaid arrow glyphs indicating local transformation direction or through color mapping to indicate areas of large or small deformation.
Plans
Detailed plans for therapeutic interventions are often created in the 3D context of the pre-procedural image data. These plans may be in the form of therapy targets, implant sites, incision surfaces, or even simulations of implantable materials and devices. Visualization of this data is often in the form of geometric models, rendered as overlay graphics on 2D image visualization or as surface models superimposed with the volumetric image data in an integrated 3D setting. In the context of image-guided therapy, this planning data must typically be transformed from pre-procedural patient coordinates to intra-procedural coordinates, making this transformation a critical element of the accuracy of the IGT procedure. Due to the inherent difficulty of automatically calculating the transformation for many scenarios, visualization plays a key role by providing visual confirmation of the correctness of the alignment between pre- and intra-procedural patient coordinates. Visualization systems may employ several methods for therapists to assess the alignment accuracy, including (1) display of the 3D anatomical scene from multiple viewpoints, (2) toggling between pre- and intra-procedural data displays, and (3) displaying warnings when constraints are violated (e.g., if a target location maps to a location outside of the estimated location of the target organ). Because the mapping from pre- to intra-procedural coordinates can often include inaccuracies, it is critical for the therapist to be able to build a mental model of the current state of patient anatomy when applying judgment as the basis for clinical decisions.
Related posts:
 A Rationale for the Use and Development of Methods for Image-Guided Brain Tumor Surgery
 Intraoperative MRI in Pediatric Neurosurgery
 Computational Support for Intraoperative Imaging and IGT
 Technology of Ultrasound-Guided Therapy
 Optical Navigation
 CT-Guided Interventions: Current Practice and Future Directions
Stay updated, free articles. Join our Telegram channel

Full access? Get Clinical Tree


