Fig. 44.1
(a) Schematic diagrams of the narrow-band imaging (NBI) system and conventional endoscope system. The sequential method is used to obtain colored endoscopic image with three color filters (the red, green, and blue (RGB) filter). (b) NBI changes the features of three filters. (b) NBI changed the spectral features of RGB optical filters placed in front of a xenon light source. Wavelengths in the new RGB filter were 500 nm (R), 445 nm (G), and 415 nm (B) [12]
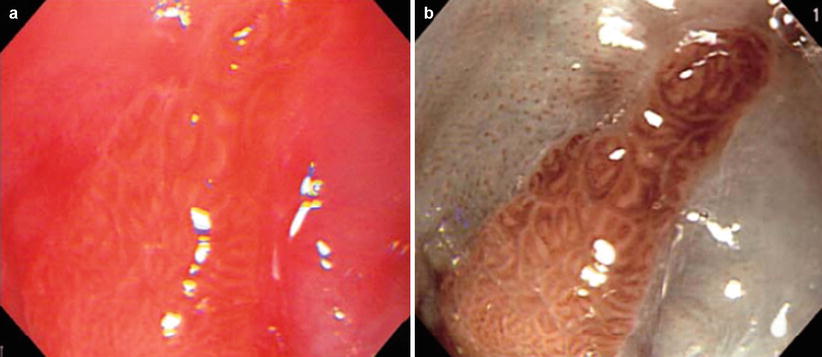
Fig. 44.2
Visualization of columnar-lined esophagus (CLE, pit pattern): (a) Conventional image. (b) Image obtained by NBI endoscopy. Mucosal crypt pattern (“pit pattern”) of the CLE could be observed without dye staining [12]
Diffuse reflectance spectroscopy has been investigated for intraoperative diagnosis of tumor margin in some diseases. Diffuse reflectance spectrum is a function of the optical absorption and scattering coefficient of the tissue. Srinivasan et al. measured near-infrared (between 660 and 850 nm) diffuse reflectance spectra of 24 mammographically normal breasts and showed that the absorption spectrum of breast tissue allows quantification of (1) total hemoglobin concentration, (2) hemoglobin oxygen saturation, and (3) water concentration, whereas the scattering spectrum provides information about the size and number density of cellular components and structural matrix elements [13]. Application of diffuse reflectance spectroscopy was studied as a tool for intraoperative margin assessment. Brown et al. reported application of reflectance spectra measurement (450–600 nm) for intraoperative assessment of tumor resection margins in the breast [14]. They calculated the wavelength-dependent absorption coefficient ( ) and the wavelength-dependent reduced scattering coefficient (
 ) using Monte Carlo simulation model. Absorption coefficient is used to calculate concentration of oxyhemoglobin and β-carotene, and the wavelength-averaged reduced scattering coefficient
  . They reported that clear sources of contrast between cancerous and cancer-free resection margins were identified with the device and resulted in an overall accuracy of 75 % in detecting positive margins for 48 patients.
) and the wavelength-dependent reduced scattering coefficient () using Monte Carlo simulation model. Absorption coefficient is used to calculate concentration of oxyhemoglobin and β-carotene, and the wavelength-averaged reduced scattering coefficient . They reported that clear sources of contrast between cancerous and cancer-free resection margins were identified with the device and resulted in an overall accuracy of 75 % in detecting positive margins for 48 patients.Raman spectroscopy is also used for optical assessment of tissue. Raman spectroscopy can provide various organic molecules similar to infrared spectroscopy [15].
Absorption spectroscopy utilizes light-absorbing chromophores found in tissue. Oxyhemoglobin is a typical example. They represent tissue oxygenation information. When absorption spectrum is used for intraoperative diagnosis, chromophores indicating physiological and pathological information of tissue should be identified. In the breast cancer study mentioned above, hemoglobin, oxyhemoglobin, and β-carotene are the molecules interested.
The limitation of the absorption spectra measurement is its instability due to measurement condition and limitation of measurement depth. This limitation concerning measurement depth is common to all the other modalities of optical measurement. Even when near-infrared light can penetrate relatively deep in the tissue, the measurement range is practically a few millimeters. Highly optical scattering properties of biological tissue deteriorate.
Thermal Imaging
To identify blood vessel and blood flow in exposed organs such as brain during open scull neurosurgery, sensitive infrared imaging can be used. Watson et al. used a sensitive (0.02 °C), high-resolution (up to 50 m/pixel) infrared camera with a rapid shutter speed (up to 2 ms/frame) for localizing cortical function intraoperatively in animal study using monkeys [16]. They concluded that use of high-resolution, digital infrared imaging provides the surgeon with a means to assess collateral flow during temporary vessel occlusion and to visualize directly the flow in parent arteries or persistent filling of an aneurysm after clipping.
In thermal mapping of human brain, local cerebral blood is used as natural endogenous thermal contrast reagent. Gorbach et al. reported that the distribution of evoked temperature change measured with a high-sensitivity infrared camera with temperature sensitivity of 0.02°C overleaps with functional region identified by standard evoked potential mapping technique [17].
Nakagawa et al. reported the use of an infrared imaging system to monitor infrared light emission (wavelength 7–14 μm) from the brain surface during direct bypass surgery on pediatric patients with moyamoya disease [18]. Superficial temporal artery (STA)–middle cerebral artery (MTA) anastomosis was conducted, and change in temperature during surgery was evaluated. They estimated the surface blood flow though monitoring of temperature in the range of 35 ± 10°C. The system could monitor the bypass patency even in small vessels in childhood moyamoya disease. Figure 44.3 shows changes of temperature (black, high; white, low) found in a clinical case after temporal occlusion at 0 s. Blood in the superficial temporal artery (STA) decreased due to blockage of warm blood supply during temporal blood flow occlusion. In the initial phase at 0.66 and 0.83 s, the cooled blood is distributed to the distal and proximal directions. The warm blood then enters the STA causing increase in temperature (at 3.00 s). The temperature of the entire exposed brain increased after removal of temporary clip. Bypass patency can be successfully visualized by the infrared imaging system with temperature resolution of 0.08°C. As shown in the thermal image at 80 s after removal of temporal clip, local hemodynamics can be also evaluated.
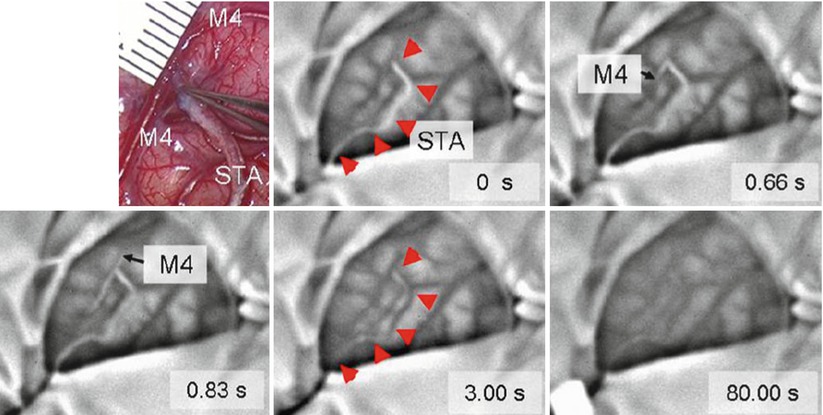
Fig. 44.3
Intraoperative infrared monitoring disclosed changes in color of bypass (arrowhead) to white after temporary occlusion (indicating decrease in temperature) at 0 s and then changed to black (indicating increase in temperature) after removal of clip, indicating presence of blood flow and patency of bypass. The images also disclosed that the white blood flow firstly distributed to distal direction of M4 at 0.66 s (forward flow) and then to proximal direction of M4 at 0.83 s (backward flow). The entire exposed brain slightly changed toward black till the end of monitoring at 80 s after removal of temporary clip. Upper left microscopic view of surgical field around anastomosis [18]
The same authors investigated clinical implication of intraoperative infrared brain surface monitoring during STA–MTA anastomosis in patients with moyamoya disease [19]. In one case, no significant increase in average temperature around anastomosis site was observed after release of the temporary clip. In this case, the patient did not experience neurological deterioration during the follow-up period. In another case, significant increase of average temperature in around anastomosis site was observed. The temperature difference between the two cases was estimated as large as 0.77 °C at 90 s after removal of temporary clip. In this case, the patient suffered from fluctuating dysarthria. Diagnosis of hyperperfusion was made based on neurological symptoms along with 123I-IMP SPECT and MR angiography findings. It is considered that not only ischemia but symptomatic cerebral hyperperfusion is potential complication of this procedure. The obtained results suggesting that temperature rise around an anastomosis site above a certain threshold during bypass surgery detected by infrared monitoring might indicate the subsequent occurrence of postoperative symptomatic hyperperfusion.
Fluorescence Imaging
Fluorescence is a luminescence that is found as an optical phenomenon, in which the molecular absorption of a photon triggers the emission of a photon with a longer wavelength. To obtain fluorescence signal from tissue, there need to be a fluorophore molecule in tissue. The physicochemical and biochemical properties of the fluorophore molecule provide information for intraoperative diagnosis. Origins of fluorophore used are two: one is endogenous molecule found naturally in living tissue. Representative examples are NADH. Fluorescence originated from endogenous molecules in living tissue is called as autofluorescence. The other source of fluorescence materials used in surgical navigation is exogenous fluorescence materials introduced to the living bodies, for example, by means of intravenous injection. Examples of exogenous fluorescence materials are indocyanine green and porphyrin derivatives.
Autofluorescence
The monitoring of NADH levels in the tissue provides information on the metabolic state of the mitochondria in terms of energy production and intracellular oxygen levels [20]. NADH absorbs ultraviolet (UV) light. NADH is excited by UV light with wavelength of 320–380 nm and emits fluorescence with wavelength of 420–480 nm. NADH is a substrate or a coenzyme for the enzymatic activity of dehydrogenases that form part of respiratory chain and reside in the inner membrane of the mitochondria. Increase in the fluorescence intensity indicates a more reduced state of the NADH. Raji et al. measured NADH fluorescence to monitor injury level of myocardial infarction [21].
Exogenous Fluorescence
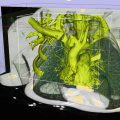
Another type of sources of fluorescent molecules used in surgical navigation is exogenous molecules introduced to the body, for example, by means of intravenous injection. Indocyanine green (ICG) is a near-infrared (NIR) fluorescent dye. ICG is FDA-approved, hydrophilic, anionic, tricarbocyanine near-infrared dye. It has the maximum absorption wavelength exists around 800 nm (765 nm [22], 800 nm[23]) and a molecular weight of 774.97 Da. Its safety is well validated in biomedical application so that it is easy to use in ICG for fluorescence surgical navigation [23, 24]. The fluorescence maximum of ICG is observed at 830 nm in blood [22]. Quantum yield of ICG in blood is higher than in H2O. ICG has been widely used to visualize vasculature structure to evaluate blood perfusion in tissue. ICG was used to produce angiogram of retina [23]. ICG was introduced intravenously. A fundus camera with optical separator was used to take images of fundus. Unno et al. used ICG (0.5 %, 1 ml) to visualize vasculature. ICG was introduced intravenously to the patients who underwent paramalleolar artery bypass using saphenous vein grafts. ICG angiography could be obtained using a near-infrared camera in real time. Graft failure identified due to thrombotic occlusion after revision surgery was detected as portion without fluorescence [25]. Figure 44.4 shows the coronary circulation network of a porcine heart visualized by intravenously injected ICG. The heart was illuminated by infrared light from a semiconductor laser diode with emission wavelength of 790 nm with maximum power of 3.5 W. An infrared camera (electron multiplying CCD camera, ADT-100, Flovel, Tokyo Japan) with band-pass filter (813–850 nm) was used to obtain the images. The image shown in Fig. 44.4a was taken when the fluorescence intensity at coronary artery reached approximately the maximum value. As time elapsed, ICG moved to periphery resulting in increase of fluorescence intensity in entire myocardium. Then ICG moved to coronary vein. Figure 44.4b shows ICG image after artificial coronary artery was artificially ligated to generate temporally coronary artery occlusion. Ischemic area of myocardium was clearly visualized in real time.
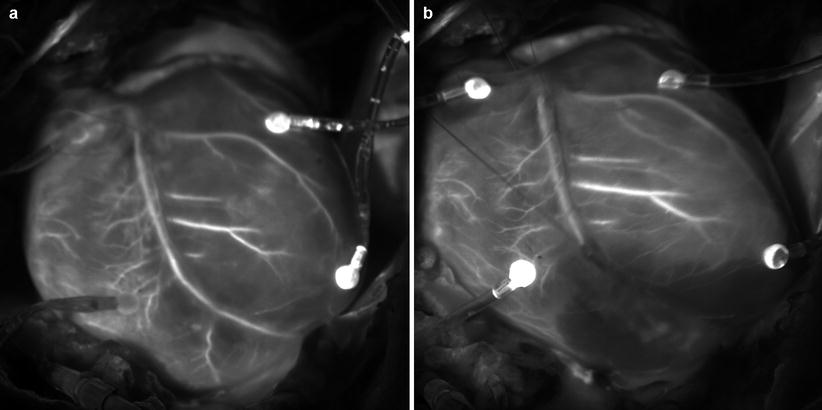
Fig. 44.4
Coronary artery network of a porcine heart was visualized by ICG fluorescence: (a) Visualization for intact heart. (b) Visualization for the same heart after temporary occlusion of coronary artery branch by ligation. The occlusion of the artery and ischemic area was clearly visualized
ICG is also used to visualize sentinel lymph node during tumor resection procedure. Kitai et al. used intraoperative ICG fluorescence imaging to assess lymph node status in breast cancer. Light-emitting diode (LED) array that emits 760 nm light was used as an excitation light source. A charge-coupled device (CDC) camera equipped with a long pass filter with cutoff wavelength of 820 nm was used. 25 mg/5 ml ICG was injected in the subareolar breast tissue. They observed subcutaneous lymphatic drainage before and after skin incision. Lymphatic node could be clearly identified as a spot with fluorescence. Using this fluorescence image guidance, they resected fluorescent spots. All fluorescent nodes were regarded as sentinel lymph nodes [26]. Gotoh et al. applied the technique to identify hepatocarcinoma (HCC) nodules that were not detected by use of any preoperative examinations including intraoperative ultrasound imaging [27].
ICG fluorescence imaging is based on physical flow of ICG in anatomical structure and its characteristics of transport, storage, and secretion from the body. This is not directly related to the metabolic properties of pathological tissues. Fluorescence signals do not always represent tissue malignancy. This is the limitation of ICG-based fluorescence image surgical navigation.
Protoporphyrin IX (PpIX) serves as a prosthetic group in hemoproteins such as hemoglobin, myoglobin, and redox cytochrome. PpIX plays an important role in the regulation of protein synthesis and cell differentiation [28]. PpIX is a fluorescent substance excited by blue light with wavelength around 405 nm and emits red fluorescence around 635 nm. Orally administered 5-aminolevulinic acid (5-ALA) accumulates in tumor cells and is converted to PpIX by heme biosynthesis.
Stummer et al. used a fluorescence microscope to examine PpIX fluorescence for intraoperative normal tumor detection [29]. They reported that some region of the normal brain and tumor have different fluorescent characteristics. They also conducted a randomized controlled multicenter phase III trial of fluorescence-guided surgery with 5-ALA for resecting malignant glioma [30]. 5-ALA fluorescence-guided resection resulted an increase in the number of patients without residual and contrast-enhancing tumor on early MRI inspection compared with conventional surgical procedures under white light observation. Progression-free survival after 6 months was twice for fluorescence-guided resection group in comparison with the control group. Accumulation of 5-ALA in a brain tumor cell may be caused by a damaged blood–brain barrier (BBB) or enzymatic defects in the biosynthesis process shown in Fig. 44.5. So far, complete understanding on how PpIX accumulates in tumor cell has not been obtained although considerable information on the mechanism has been collected. Morphological and environmental such as tissue pH, enzymatic, and cell-specific factors should be considered comprehensively [28].
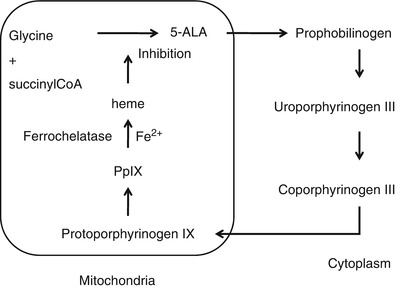
Fig. 44.5
 Visualization and Display for Image-Guided Therapy
 Multimodality Navigation in Neurosurgery
 Image-Guided Robotics in Minimally Invasive Therapies
 Innovations in Ultrasound Instrumentation for Image Guidance
 Image-Guided Prostate Brachytherapy
 CT-Guided Interventions: Current Practice and Future Directions


Heme synthesis pathway. 5-ALA is converted into PpIX through several enzymatic reaction
Related posts:
Visualization and Display for Image-Guided Therapy
Multimodality Navigation in Neurosurgery
Image-Guided Robotics in Minimally Invasive Therapies
Innovations in Ultrasound Instrumentation for Image Guidance
Image-Guided Prostate Brachytherapy
CT-Guided Interventions: Current Practice and Future Directions
Stay updated, free articles. Join our Telegram channel
Full access? Get Clinical Tree
