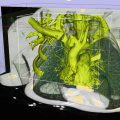
Fig. 10.1
An example of B-mode ultrasound image of the liver with an enhancing mass
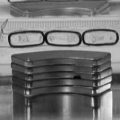
Ultrasound transducers are available in a wide variety of form factors and frequency ranges. Standard types include linear, curved linear, and vector, which produce 2-dimensional images and are primarily used on the surface of the body. Wobbler and matrix transducers produce 3-dimensional images. A “wobbler” is a transducer with an embedded motor, which moves an array through a prescribed arc. A matrix array can steer scan lines both laterally and in elevation to interrogate a volume of tissue. Example volume images are shown in Figs. 10.2. Many transducer variants also exist for use inside the body, including endocavitary, intraoperative, laparoscopic, endoscopic, transesophageal, intracardiac echo (ICE), and intravascular (IVUS).
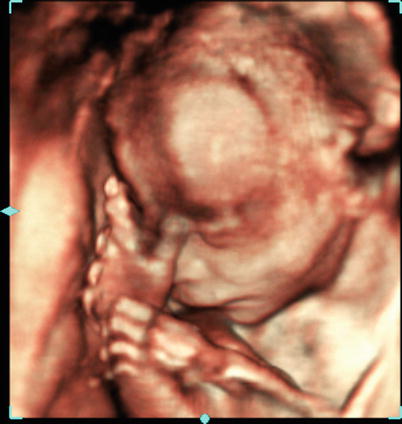
Fig. 10.2
An example of volume ultrasound of a fetus acquired with a wobbler transducer
B-Mode and Doppler
Most often associated with ultrasound, B-Mode imaging displays the intensity of sonic reflectors throughout the imaging region, which reveals the gross structure of tissue, as shown in Fig. 10.1. Specific B-mode features have been identified, which are characteristic of lesion type and malignancy [4]. Also commonly associated with ultrasound, Doppler imaging is a technique for displaying motion, in particular blood flow, using the phase shift between transmitted and received ultrasound pulses with color indicating direction, as shown in Fig. 10.3.
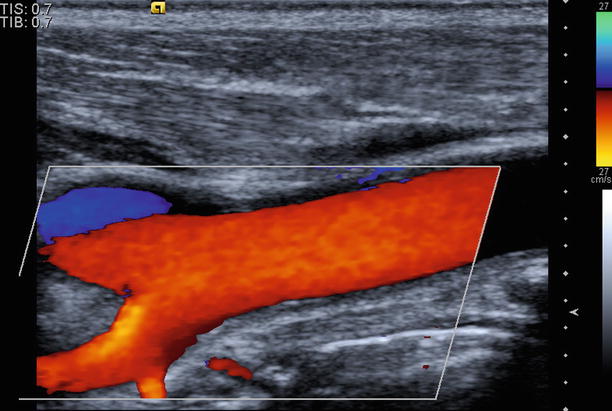
Fig. 10.3
An example of Doppler image of the carotid artery
B-mode imaging is used routinely for guidance of needles for biopsy or ablation [5, 6]. Metal needles are often visible due to the high impedance difference versus the surrounding tissue, as shown in Fig. 10.4. This large difference along with the linear needle geometry, however, can also lead to a variety of artifacts, which affect visualization [7]. Several methods have been explored to enhance the visibility of needles, including steering scan lines perpendicular to needles [8, 9], adding echogenic coatings to needles [10, 11], and post-processing images to enhance needle visualization [12–14]. Vibrating needles mechanically has also been investigated; the slight needle motion produces a signal under Doppler imaging [15].
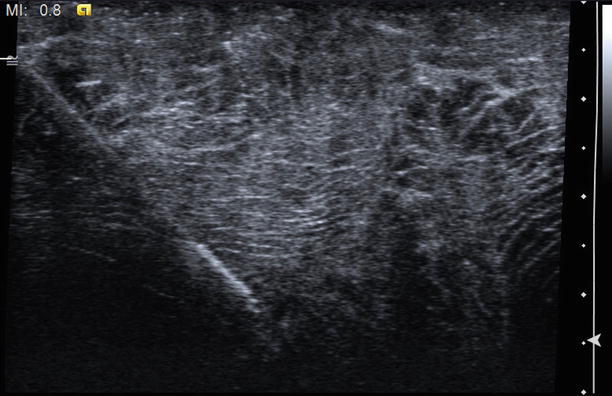
Fig. 10.4
An example image showing a needle with an echogenic coating applied near the tip
Contrast
Ultrasound contrast agents enhance visualization of tissue boundaries, Doppler blood flow, tissue perfusion, and vasculature, as shown in Fig. 10.5. Several agents are available; all are composed of different types of two components: a microbubble shell and a gas core. Microbubbles are bright reflectors of sound as compared to tissue and produce a characteristic nonlinear response to ultrasound frequencies. Thus, contrast-specific pulse sequences can be used to detect agents with high sensitivity and visualize contrast separate from tissue [16, 17]. Common uses include detection of micro-flow as with malignant lesions [18], lesion detection, and characterization through perfusion, as in Fig. 10.6, [19, 20] and percutaneous ablation therapy for both targeting and follow-up [21]. Contrast can be used immediately after ablation therapy to identify residual tumor.
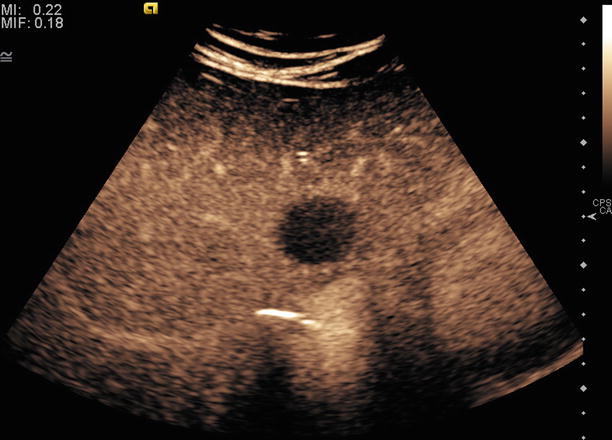
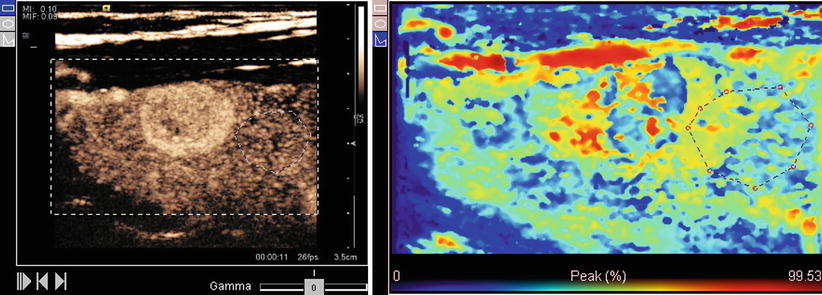
Fig. 10.5
An example of contrast ultrasound image showing a hypovascular liver lesion
Fig. 10.6
An example contrast perfusion image showing peak contrast intensity as a colorized map. Red indicates high intensity and blue indicates low intensity
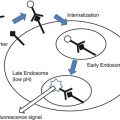
Recent investigations of 3-dimensional contrast quantification have shown that the reproducibility and quality of quantification is much greater than in two dimensions [22, 23]. Such techniques may enable more precise determination of a patient’s response to therapy to more rapidly optimize treatment. Another active research area is targeted contrast. In this case, contrast microbubbles are coated with ligands designed to preferentially bind to proteins expressed within the body by specific diseases or disease states [24]. For instance, a VEGF receptor may preferentially bind to angiogenic factors, highlighting areas of possible tumor growth [25]. Such techniques would enable both early and more precise therapy by detecting areas where therapy may be most effective.
Finally, while microbubble contrast agents remain intact under low sonic intensity, they collapse and break apart under only slightly higher intensity. This contrast destruction offers a potential vector for targeted drug delivery [26]. Microbubbles can be filled with drugs, which are nonreactive while contained, and then released preferentially in target tissues under ultrasound visualization and control. Examples of drugs being investigated include rapamycin, curcumin, doxorubicin, and paclitaxel [27, 28].
Elastography
Elastography is primarily used for detection, characterization, and targeting of lesions for biopsy or therapy. When tissue undergoes stress due to either pressure at the surface of the body, instrument manipulation, or acoustic force, the resulting displacement can be visualized in ultrasound via motion tracking. Stiff regions compress less than soft regions, so an elastography image represents a map of relative tissue stiffness, as shown in Fig. 10.7.
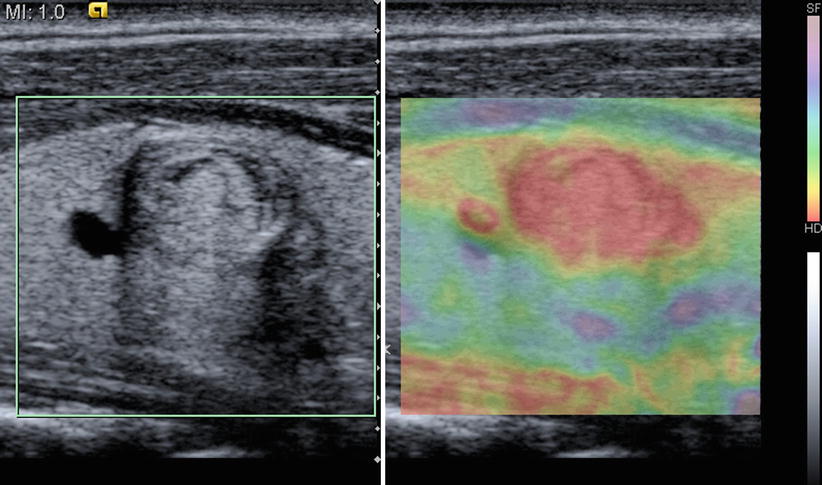
Fig. 10.7
An example of elastography image of a hard thyroid mass obtained via manual compression. Red indicates low compression and blue indicates high compression
Elastography based on manual compression has been investigated for identifying and characterizing suspicious lesions in many organs, including the breast, prostate, and thyroid [29]. Barr et al. report, for instance, that a ratio of the longest dimension of a lesion in elastography versus B-mode greater than one is characteristic of malignancy [30]. Other studies characterize lesions based on the ratio of stiffness inside and outside a lesion, known as the strain ratio [31]. Manual elastography has also been used to visualize lesions both before and after radiofrequency ablation [32, 33].
Acoustic Radiation Force Impulse (ARFI) is a novel method of achieving tissue compression at greater depths and with greater consistency than that achievable through surface compression. This technique uses the sonic pulse, known as a “push pulse” to compress tissue along a scan line. Like manual elastography, ARFI has been investigated for lesion characterization [34, 35] and evaluating lesions before and after radiofrequency ablation [36].
Beyond relative stiffness, quantitative measurement of tissue modulus holds promise for more precise localization and characterization of lesions. Compression elastography, however, cannot quantify modulus because physical boundary conditions cannot be controlled [37]. Recently a novel technique has been developed to achieve this quantification, which measures the speed of shear waves generated by an ARFI push pulse [38]. Shear waves travel perpendicular to the push pulse, and their velocity is proportional to tissue modulus and independent of push pulse intensity. A related technique called supersonic shear imaging uses multiple push pulses at progressively increasing depth to create shear waves, which constructively interfere to form plane shear waves [36]. Using imaging at up to 5,000 frames/s, the velocity of these plane shear waves are measured to produce a map of tissue elasticity.
Navigation
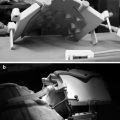
Ultrasound-based navigation involves both moving a transducer to image target anatomy and moving an instrument to a particular target location. Example procedures include biopsy, percutaneous ablation, stereotactic neurosurgery, and radiotherapy. In performing such tasks, spatial tracking systems, which report the position and orientation of devices with respect to a base coordinate system, can help maintain spatial awareness. A common application of this tracking data is to display graphical overlays on ultrasound images indicating a needle’s axis and tip location [39, 40], as shown in Fig. 10.8. These help ensure accurate placement if needles are not well visualized and add depth information to guide needles from out of the image plane. Tracked ultrasound is also useful for adjusting interventional plans based on tissue motion, such as brain shift experienced during neurosurgery [41]. More advanced targeted therapeutic devices, such as extracorporeal radiotherapy, have their own articulation, and tracked ultrasound can be used to spatially localize the therapeutic target to position the devices correctly [42, 43]. Robotic surgical systems employ similar techniques [44].
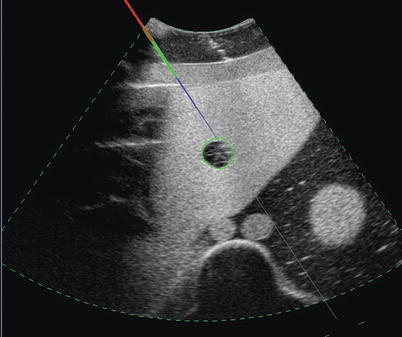
Fig. 10.8
An example of tracked needle display. The grey line indicates the needle axis. Colors along the line indicate the needle location and depth. Blue indicates portions in front of the image. Red indicates portions behind the image. Green indicates portions in the image plane
Tracking also enables fusion imaging, in which ultrasound is displayed simultaneously with another volume modality, such as CT or MRI, as shown in Fig. 10.9. During live scanning, tracking information is used to reconstruct slices from the volume data, which correspond to the ultrasound image. Thus, the same anatomy is observed from the same angle from two modalities. Seeing the same anatomy in two different modalities enables a physician to correlate structures or use one modality to fill in the information missing in the other. For instance, fusion has been shown to assist with the particularly difficult navigation of laparoscopic [45] and endoscopic transducers [46].
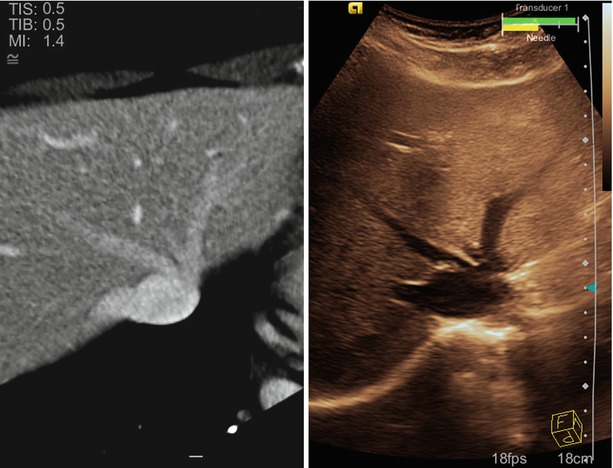
Fig. 10.9
An example fusion image showing the hepatic vasculature in the liver. The image on the left is CT. The image on the right is ultrasound. Both are obtained from the same oblique plane
Various tools have been investigated for aligning the volume data with the tracking system for fusion display [47–50]. Clinical implementation of fusion imaging has suffered, however, due to the time required to achieve adequate alignment using traditional methods. Recent advancements in automatic image analysis may potentially reduce this time greatly.
Related posts:
Stay updated, free articles. Join our Telegram channel

Full access? Get Clinical Tree


