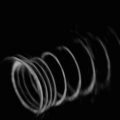
Fig. 56.1
TRUS. Transrectal ultrasound image of the prostate at the mid-gland level
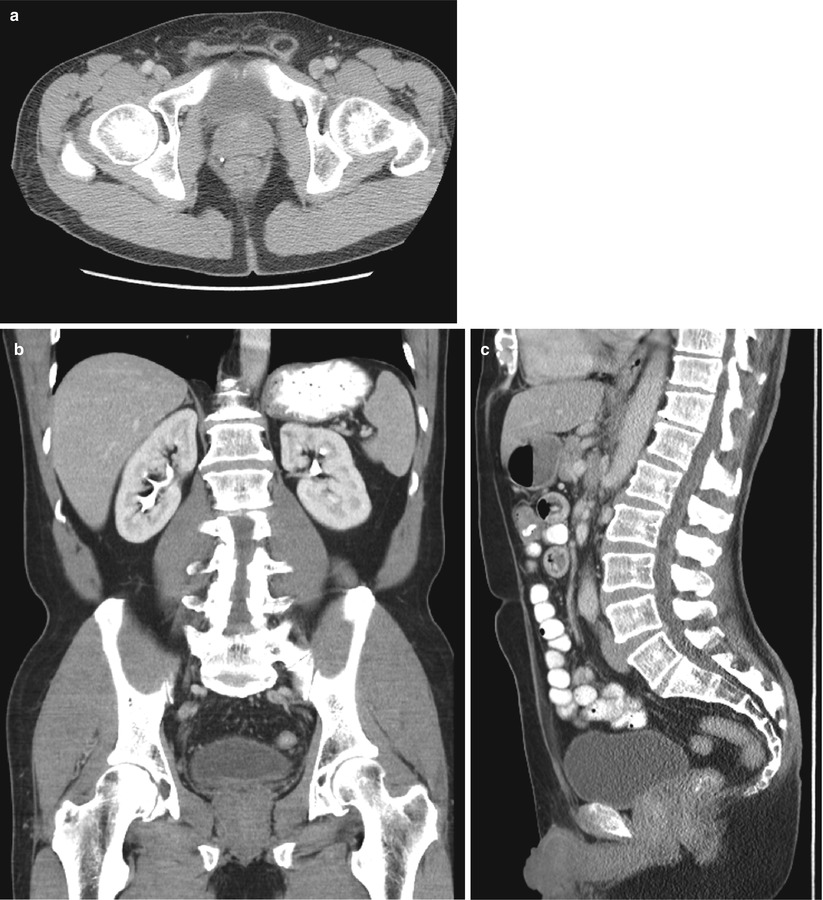
Fig. 56.2
CT. Multiplanar CT images of pelvis and through the prostate shows the gland boundary but no substructure detail
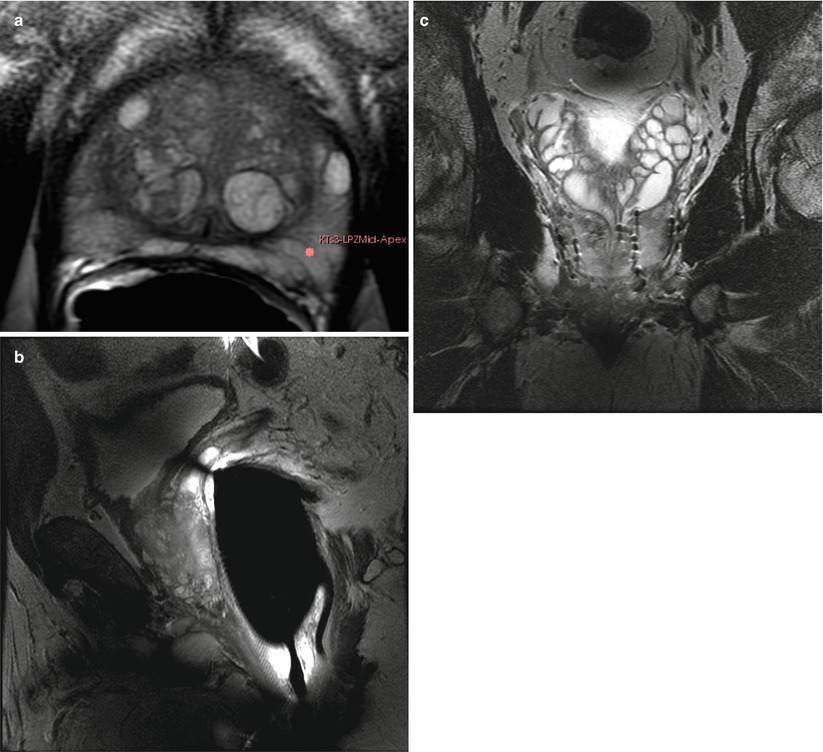
Fig. 56.3
MR. (a) Transverse T2W Fast spin echo (FSE) sequence, image of the prostate at mid-gland level shows the superior signal to noise provided by 3 T with endorectal coil technique. The images show the normal high-signal peripheral zone (PZ) and mixed signals of the focal areas of benign prostatic hyperplasia (BPH) in the center. (b) Sagittal T2W FSE shows the T2W contrast and the posterior gland surface abutting the anterior rectal wall with endorectal coil. (c) Coronal T2W FSE image of a man who has had prior brachytherapy shows the seeds, focal signal voids, and the normal appearance of the seminal vesicles superiorly
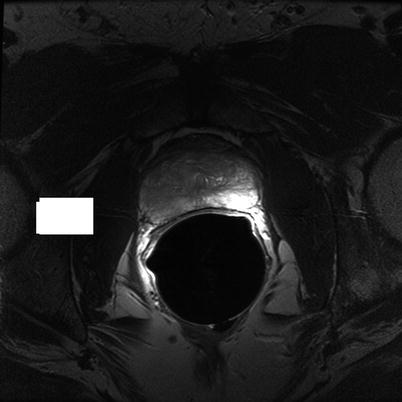
Fig. 56.4
Transverse T2W FSE image of the prostate at mid-gland level shows focal low-signal tumor on the right with normal high-signal PZ on the left
T1- and T2-Weighted MR Imaging
The techniques of T2-weighted (T2W) MRI is well established as an essential sequence, compared with other techniques, as it provides an excellent display of the prostate and its substructure anatomy. Focal tumors usually appear as an area of low signal surrounded by the high signal of the normal peripheral zone (PZ) (Fig. 56.5). It is sometimes challenging to detect the carcinoma in the PZ due to several factors that may mimic malignant foci such as post-biopsy hemorrhage, benign prostatic hyperplasia (BPH), scars, fibromuscular tissue, calcifications, prostatitis, and the effects of radiation treatment. Even more challenging may be the detection of neoplastic tissue in the central gland where nodules appear with mixed signal intensities. If there is a homogeneous lenticular shape with low signal on T2W, a central gland focal cancer should be suspected (Fig. 56.6).
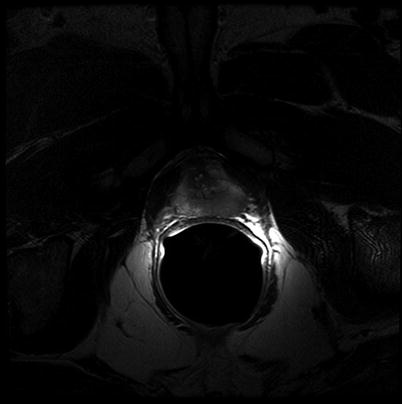
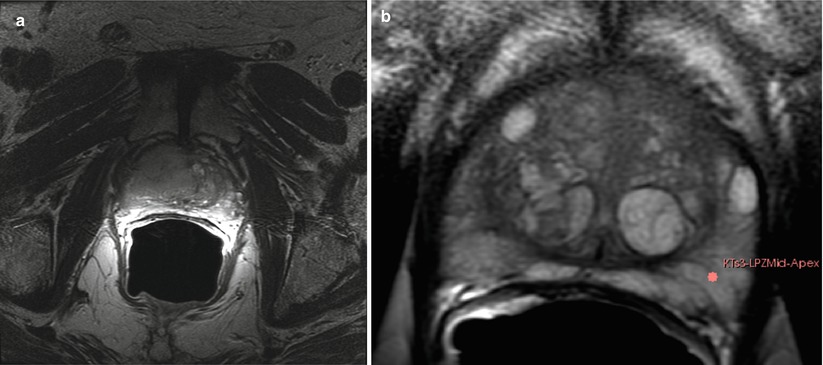
Fig. 56.5
Transverse T2W FSE image at the level of the prostate apex shows a large focal tumor on the left. Note the close proximity of the tumor to the left neurovascular bundle (NVB) on the left
Fig. 56.6
MR imaging of prostate cancer. (a) Transverse T2W image shows a larger area of abnormal signal in both the PZ and center gland on the right. The normal BPH pattern is obliterated by the mass and a rim of normal BPH remains on the left. (b) Pre-biopsy transverse T2W with a target on the left side. Note the excellent depiction of the PZ and BPH
Due to its limitations, T2W alone does not achieve adequate sensitivity and specificity for detecting prostate cancer. High-signal areas in T1-weighted (T1W imaging) overlapping with low-signal areas in T2W are often likely to be artifacts due to post-biopsy hemorrhage. To avoid this error and enable better diagnostic accuracy, mpMRI techniques are now widely used, including diffusion-weighted imaging (DWI), magnetic resonance spectroscopy imaging (MRSI), dynamic contrast enhancement (DCE), and its post-processed maps; all are now part of a state-of-the-art MR imaging protocol. They can increase the detection of significant prostate cancer, markedly enabling improved diagnostic capability. The post-processed values acquired with these new techniques can be validated in several ways. For example, quantitatively using color maps that are visually easy to understand and through objective metrics such as ADC maps and parameters from two compartment pharmacokinetic models such as ktrans (wash in), kep (wash out), maximum slope (for wash in) and wash out, and Ve (extravascular–extracellular volume fraction), with several groups studying both approaches. Such mpMRI combined with traditional T2W can be used not only to analyze the presence or absence of prostate carcinoma and for treatment planning, but also to characterize the histological features of tumors. A study has shown that mpMRI is correlated to tissue composition for tumors and benign tissue [29], and it can allow for the differentiation between BPH and prostate cancer in the central gland [30]. The technique of mpMRI can also be used after local salvage therapy with good accuracy for determining recurrence [31].
Diffusion-Weighted MR Imaging (DWI)
First described to assess stroke and ischemia in the brain, DWI measures the water diffusion within tissue. It is well known that neoplasia, due to its local neoangiogenesis, usually affects the diffusion capacity of water molecules; therefore, this technique was translated to prostate imaging for which it provides the advantages of short acquisition times and no need for IV contrast medium administration [32]. DWI sequences are acquired using a range of b values (500, 1,000, 1,400) to generate ADC maps. More recently, the higher b values, over 1,000, have shown great promise for the detection and characterization of focal tumors. Tumors show a lower ADC value than benign regions, both in PZ and the central gland, as Fig. 56.7 shows several studies have demonstrated the significant contribution of DWI [33–37].
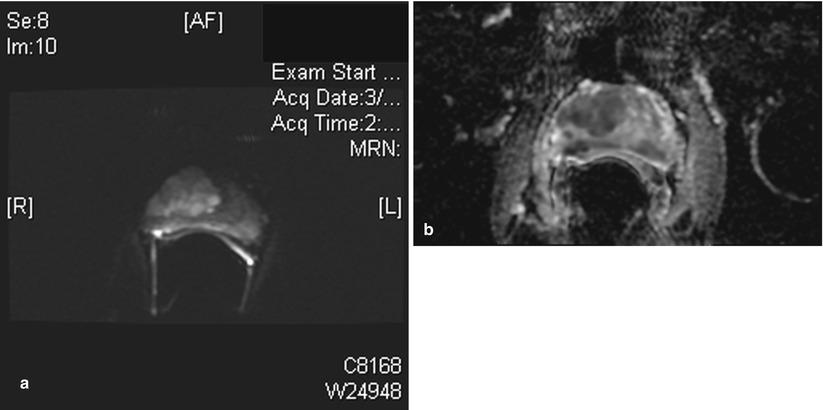
Fig. 56.7
Diffusion MR imaging of prostate cancer. (a) Transverse diffusion-weighted image (DWI) with b value of 1,400 shows a large focal area of high signal in the right gland. This was a Gleason 4 + 4 adenocarcinoma at pathology. (b) Same patient as (a) apparent diffusion coefficient (ADC) image shows the corresponding large area of restricted diffusion
It has been shown that the lower the ADC value, the higher the Gleason score and the more aggressive the tumor [38]. The addition of an ADC map to T2W images can improve the diagnostic performance of MR imaging in prostate cancer detection [39], helping the clinician to distinguish malignant from benign tissues. The combination of ADC and T2W can be used to differentiate cell density both in cancer and noncancerous tissue and therefore, play an important role in the estimation of the Gleason score at 3 T [36].
Dynamic Contrast-Enhanced MR Imaging
Dynamic Contrast-Enhanced MR Imaging (DCE) was introduced to effectively visualize the pharmacokinetics of gadolinium uptake in tissue as the angiogenesis of tumor differs from that of benign tissue. DCE acquires data on tissue perfusion characteristics and tumor wash-in and wash-out contrast, which are variables that rely on the pathophysiologic principle that tumors display increased angiogenesis and, thus, are expected to show early and increased enhancement.
DCE images of the prostate are evaluated by means of the direct raw interpretation of T1W images viewed in picture archiving and computer storage (PACS) systems in static and/or cine mode (Fig. 56.8) and after processing from color maps generated from analysis by a pharmacokinetic model. The following general kinetic models are usually selected for processing: ktrans, kep, maximum slope for wash in and wash out, and Ve (extravascular–extracellular volume fraction). The mean peak values of ktrans (forward value transfer constant), kep (reverse reflux rate constant between extracellular space and plasma), time to peak (TTP), and maximum slope (MaxS) are currently the parameters of most common interest. These processed data can be analyzed either visually (by generating color maps) or quantitatively through straight values. Quantitative measurements reflect some exciting results and can play an even greater role in the future of prostate care.
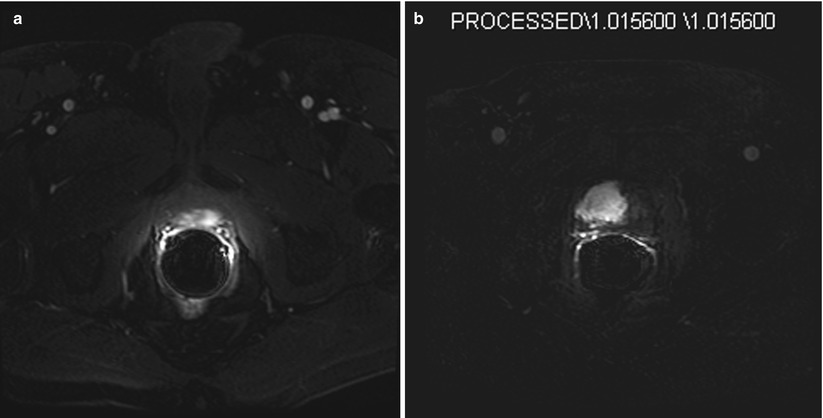
Fig. 56.8
Dynamic contrast enhancement (DCE) MR images. (a) Transverse T1W fat-suppressed image immediately after the injection of intravenous gadolinium. This image shows an arterial enhancing lesion in the left posterior gland. This lesion shows the typical appearance of cancer with early “wash in” of contrast. Note the similar enhancement of the two femoral arteries at the same time. (b) Subtraction image. Same patient as Figure 56.7. Note matching abnormalities. This image is an arterial phase image with the baseline pre-contrast image subtracted, leaving only the residual arterial contrast as the only signal in the image. Thus the large hyperintense mass on the right represents the arterially enhancing tumor
Prostate MRI methods may someday substitute for some of the in vivo assessments done today in histology. Certainly, by employing quantitative MRI, these images can be used for tumor monitoring and the assessment of treatment response. Though the difference in impact is only significant for evaluating the PZ, quantitative dynamic MRI is more accurate than T2W imaging for tumor localization of non-palpable cancer greater than 0.2 cc. Above this volume, correlation between tumor volume measured on dynamic MRI and that on the specimen is poor [29, 40]. Having said this, DCE is a proven method to help in localizing tumors within the prostate.
MR Spectroscopy Imaging
MR Spectroscopy Imaging (MRSI) is another technique that allows one to noninvasively assess metabolites present in biological tissue. Given that the use of an MRI body coil alone does not reach sufficient resolution, the endorectal coil, once introduced, changed clinical practice for the better as it made possible for 3D MRSI of the prostate with increased sensitivity. Currently, the resolution of MRSI with 1.5 T scanners is a voxel size of approximately 0.3 cm [3], while for 3 T, voxels smaller than 0.2 cm [3] are feasible. The levels of citrate, choline, and creatine have special interest for the evaluation of prostate cancer, as it is known that tumors have an elevated level of choline and a decreased level of citrate. Though it is important to point out that the graphical analysis of creatine and choline is usually not separable, the ratio (choline + creatine/citrate) can be used for the prediction of malignancy. Several studies have tried to suggest levels of these substances as predictors for prostate cancer. Kumar et al. showed a good prediction for tumor detection when a cutoff of 1.2 in (citrate/choline + creatine) ratio was used to assess the likelihood of malignancy in the PZ [41]. However, there is still no agreement among studies about metabolites concentrations as far as their abilities to suggest cancer. This lack of consensus is probably due to the differences in technique for data acquisition and interpretation; indeed, no standard has been reached. Studies have shown specificities of 49–88 % with accompanying sensitivities of 63–98 %, respectively, for MRSI. Unfortunately, most of these good results left out the analysis of the central gland. Due to signal overlapping from the PZ, MRSI still does not obtain good accuracy results in the inner regions of the gland. Moreover, a recent multi-institutional prospective study demonstrated that, compared to MRI alone, combining MRSI with MRI reaches the same levels of accuracy for detecting tumors in the PZ [42].
Currently Recommended MRI Protocol for Staging
The current state-of-the-art protocol for prostate MR is to use the highest field strength available (1.5 T or greater), T1W, T2W, DWI, and DCE sequences. The exact combination of sequences for specific clinical scenarios remains to be defined, but it will certainly rely on the combination with several different sequences to reach the greatest levels of accuracy in cancer detection and characterization [38]. More specifically, based on what has been evaluated to date in studies, current state-of-the-art MRI techniques for prostate care are ideally performed on 3 T magnets and are based on the following sequences: T2W fast spin echo in three orthogonal orientations, transverse unenhanced T1W, and dynamic transverse 3D fast spoiled gradient-echo T1W for 90 s after injection of contrast. This data is then processed by specialized software to yield color maps for the DCE series and ADC maps from generated raw DWI. This protocol has been satisfactorily used for the last 5 years for prostate cancer detection, staging, and assessment of radiation therapy at the Brigham and Women’s Hospital (BWH). Moreover, the protocol has been recommended as shown by the consensus reached by 16 European experts at a recent meeting [43]. The overall assessment of stage is based on the determination of whether the tumor is organ confined (T1W/T2W) or beyond the prostate (T3/T4). Seminal vesicle invasion (SVI) and extracapsular extension (ECE) are important factors for staging disease. For SVI, the accepted criteria are low-signal intensity in one or both seminal vesicles (usually high signal in T2W) or disruption or loss of the normal architecture in the ducts or the glands, whereas the criteria for ECE are tumor extension into the periprostatic fat tissue, focal capsular bulge, irregularity, retraction, and rectoprostatic angle obliteration [44]. ECE initially occurs most commonly at the 5 and 7 o’clock locations in the transverse plane.
Wang et al. showed that MRI has better accuracy for predicting SVI than clinical variables. Moreover, the endorectal MRI has shown the most promising results in detecting SVI with specificity up to 99 % and sensitivity up to 80 % [32]. For assessing ECE, MRI (T2W) has a reported accuracy of between 50 and 90 % [44].
Even though MRI techniques including DCE and MRSI cannot detect precancer lesions, such as prostatic intraepithelial neoplasia, they are good for detecting focal tumor. MRI is also useful for predicting a tumor’s grade. Treatment choice, including active surveillance, relies on MRI to assist in the prediction of a tumor’s behavior; one important aspect of this is the tumor size and prostate gland volume. MRI is known to be better than TRUS for assessing prostate gland volume that is very important for planning and delivering radiation therapy. For instance, patients must be defined as having a prostate smaller than 60 cc for them to be deemed suitable for EBRT or brachytherapy. The criteria for staging prostate carcinoma not only involves defining ECE and SVI but also should concomitantly evaluate pelvic lymph nodes and osseous structures to detect all sites of possible metastases in a single examination [28].
MRI-Guided Prostate Biopsy
Historically, prostate cancer biopsy and local therapies are guided with TRUS. Much of the collective experience with interventional MRI arises from the conventional TRUS techniques, we will review these next.
Conventional TRUS-Guided Prostate Biopsy
TRUS-guided prostate biopsy is by far the most common and frequently used intervention in relation to prostate cancer, given its advantages of relative ease of use, availability, and low cost. It is the initial diagnostic step in the vast majority of cases to obtain tissue samples for pathological evaluation in men suspected of having prostate cancer. TRUS imaging of the prostate has a long history using gray scale and Doppler techniques, even though newer inversion pulsed harmonics and, now in certain select sites, IV microbubble contrast, and ultrasound elastography are under investigation. The basic TRUS imaging used to guide transrectal needle sampling involves a simple visualization of the gland and subdivision of this gland volume into sextants for systematic biopsies. The division allows for 6–12 cores to be removed in an orderly fashion in an attempt to provide uniform gland sampling. Much debate surrounds the recommended approach that ranges from numbers of cores to locations. In general the standard approach is 12 cores with peripheral/lateral aspects of the gland sampled using an 18-gauge (G) side-cutting biopsy needle. The TRUS-guided biopsy procedure is typically performed in an outpatient setting. The patient usually takes prophylactic antibiotics for 1–2 days prior and after the biopsy. Local anesthesia can be used; it is injected into the periprostatic nerves. A technologist can perform TRUS imaging while the urologist acquires the biopsy samples, but more commonly, a single physician does both. Each biopsy sample is labeled, either right or left, and occasionally, more location-specific details are provided. This is, however, very variable and often leads to difficulty in correlating imaging and pathology findings. Each sample is examined separately, and a diagnosis is made between benign, premalignant, prostatic intraepithelia, neoplasia, and adenocarcinoma. In the case of adenocarcinoma, a Gleason score is assigned, depending upon cell types and degrees of differentiation. The percentage tumor volume in each sample is also recorded. The final report also includes the number of positive samples relative to the total samples harvested.
If one critically assesses TRUS image quality, its overall accuracy for detection, characterization, and locoregional staging of prostate cancer then MRI far surpasses TRUS.
Open MRI-Guided Prostate Biopsy
In 1997, the Brigham and Women’s Hospital established the first direct transperineal prostate biopsy program using 0.5 T open MRI scanner and validated this approach in over 50 men [45, 46]. To optimize the biopsy yield, the prostate gland is sampled transperineally, thereby maximizing contact with the PZ that is statistically the most likely location of potential cancer and allowing easy access to all parts of the gland, especially the anterior part. This work established a new approach to prostate biopsies, and many prominent research groups followed suit. The concept was derived from brachytherapy. The needles were introduced freehand using the reference frame of a needle-guidance template commonly used in brachytherapy with grid of holes spaced 5 mm apart. The template was registered to a 0.5 T open MRI scanner using an optical tracking system integrated to the MRI scanner. This registration achieved geometric correlation between the template and patient anatomy, enabling the selection of a hole that will guide a biopsy needle towards the target determined from the MRI scans. By using the template for needle guidance, the needle path was restricted due to the fixed direction of guide holes in the template. In all patients, both targeted and random sampling biopsies were obtained, to allow for the evaluation of the efficacy of targeted sampling and maximizing the diagnostic yield for each patient. To improve needle guidance, navigation software was created by adding specialized modules to 3D Slicer, the powerful open-source visualization and surgical guidance platform [21]. First, target definition and planning functions were added to 3D Slicer. These functions were performed by measuring the coordinates of the suspicious tumors foci and selecting a corresponding hole in the template grid to reach the targets. Target definition was carried out using T2-weighted images after the patient went under general anesthesia. A key feature of the system was volumetric data registration that allows for planning the targets on preoperative high-resolution T2-weighted images mapped onto intraoperative 0.5 T images. With the use of the same volumetric mapping method, patterns like statistical maps or spectroscopic MRI were superimposed on the intraoperative images. Finally, the reconstructed 3D anatomy was blended with all forms of information mentioned above. Due to significant prostate shape changes occurring between preoperative high-field endorectal coil imaging (legs down) and intraoperative 0.5 T imaging (legs up), a deformable registration method based on finite element modeling was developed [47, 48]. The targeting and planning system outlined above also established the tradition of using 3D Slicer as the visualization interface of choice in a long line of experimental image-guided intervention systems.
Efficient and accurate biopsy targeting in the real-time open-MRI environment demanded methods for needle tracking. Needles are visible in MRI due to their susceptibility artifact. Paramagnetic needles when imaged produce field distortions that appear as local regions of signal loss and, in some cases, signal enhancement [49]. The size and location of the artifact change with the material properties of the needle, imaging signal, image resolution, and the relative orientation of the needle, B0 field and the gradient field. In other words, the needle is usually not where it appears to be in the MR image. There is a compromise between imaging speed and quality that impacts needle localization, accuracy, and reliability [50]. The susceptibility artifacts produced by needles in magnets of various field strengths were characterized. Techniques have been proposed for optimizing the visualization of image artifacts and driving the scan plane [51]. Recent work reported on the feasibility of mapping the spatial displacement of the needle susceptibility artifact versus the true needle position [52, 53].
A detailed investigation of needle placement accuracy study concluded that precise and accurate placement of needle may be best achieved by robotic needle placement [54].
New 3 T magnet bore size at 70 cm diameter now allow us to perform transperineal 3T MR-guided prostate biopsy. We at Brigham and Women’s Hospital (BWH) now perform this regularly at 3 T, with the patient in prone position, under intravenous conscious sedation (IVCS) (Figs. 56.9 and 56.10). The perineal template is used and manual needle insertion is performed under MR guidance (Figs. 56.6 and 56.9). We obtain a full multiparametric MR exam several days to weeks prior to the biopsy procedure. These images are used to define targets for sampling. The images are imported into 3D Slicer (Fig. 56.11) and registered to the procedure images with Z-frame, using the method introduced by Fichtinger et al. [18]. This approach provides the unique opportunity to obtain site-specific pathological samples from image abnormalities.
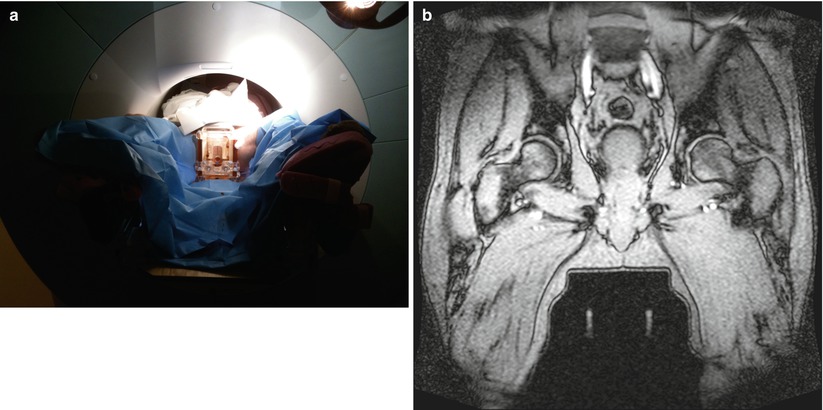
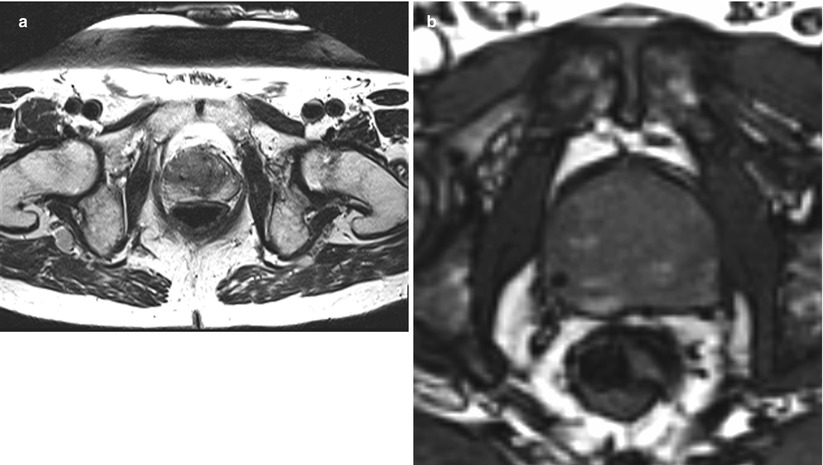
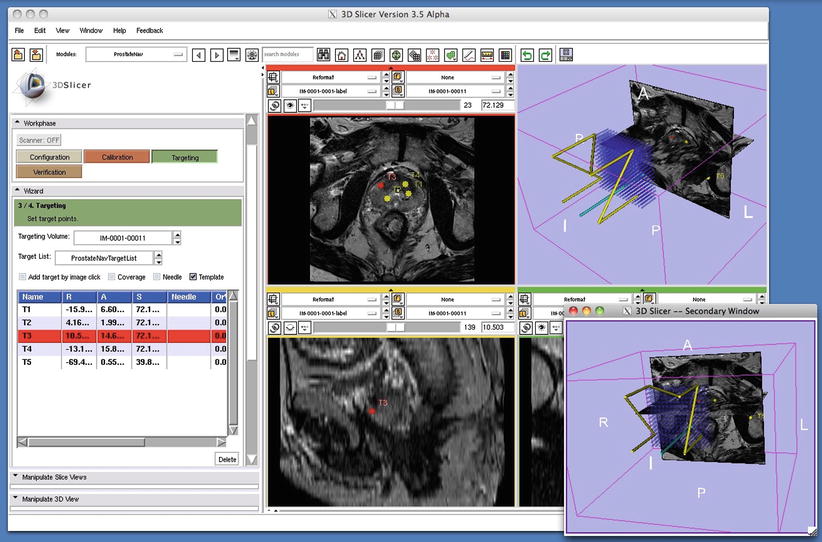
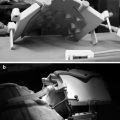
Fig. 56.9
(a) Pre-transperineal prostate biopsy setup. (b) This coronal gradient-echo image shows the patient in the pre-biopsy setup position with the transperineal template guide positioned between his legs. Two linear stripes of signal from the Z-frame are seen below the template. The Z-frame allows registration of the template and patients prostate gland
Fig. 56.10
MR-guided prostate biopsy needle in place. (a) This is an transverse T2W image with a biopsy needle in place—see small black void in 9 o’clock position in the right mid-gland. (b) This transverse gradient-echo image “near real time” shows a needle in position in the right side of the prostate. Note the focal black-signal void. This is more conspicuous than in (a) but lacks the T2W contrast inside the prostate
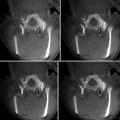
Fig. 56.11
3D Slicer prostate module. This single screen shot from the prostate biopsy module in 3D Slicer (www.slicer.org) shows four images: top left, transverse T2W image with pre-defined biopsy targets; top right, the Z fame and all template holes registered to the T2W image; bottom left, a sagittal image showing a target location; and bottom right, Z-frame and template again in alternative orientation
MR Guided Focal Therapy
This unique ability to validate the MR findings along with the improvements of MR for detection and characterization of focal disease allows for investigation of image-guided focal therapy. Many centers are using the MR and US capabilities to guide High Intensity Focused Ultrasound (HIFU), cryotherapy, laser or photodynamic therapy. We have completed preclinical trials in MR-guided FUS surgery (Fig. 56.12a, b) and demonstrated our ability to induce focal prostate necrosis. The exciting feature of this approach to focal therapy is the ability to closely monitor the temperature change in near real-time with MR thermometry (Fig. 56.2b). This allows for accurate placement of sonications and immediate feedback of therapeutic result. New clinical trials are underway which will allow carefully assessment of this exciting new approach to focal therapy for prostate cancer have begun and are underway.
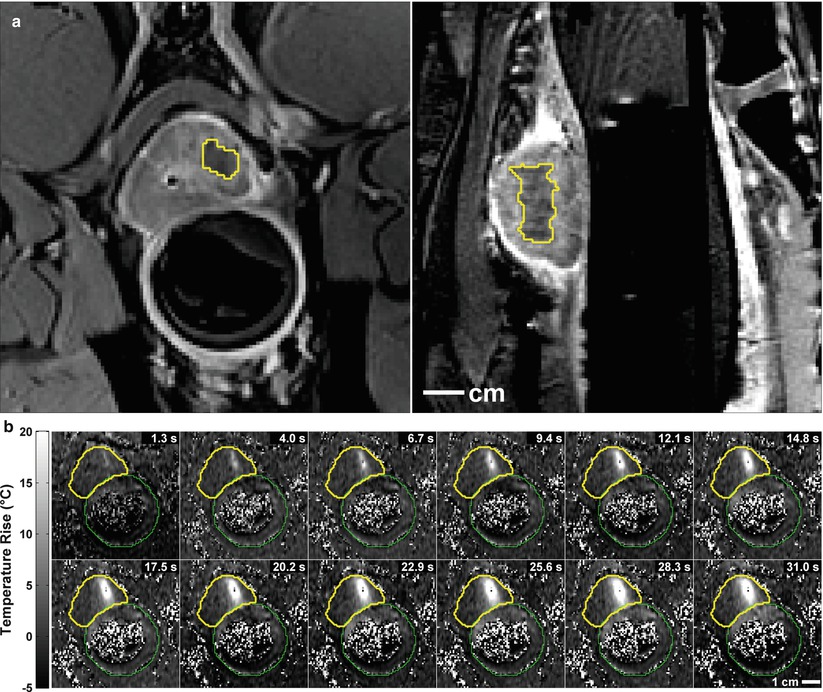
Fig. 56.12
(a) Two images obtained after MR-guided focused ultrasound surgery (FUS) to a small region of the prostate in a preclinical trial. The images show the well-defined non-perfused region after the IV gadolinium. (b) Multiple MR thermometry images, from time 1.3–31.0 s, acquired during the delivery of FUS energy show the local heating (white area) within the prostate. Thus local heat delivered can be monitored in real-time during the procedure
MRI-Assisted Prostate Biopsy with Real-Time TRUS Guidance
To marry the convenience of TRUS with the superior anatomical visualization of MRI in prostate biopsy, fusion of preoperative high-resolution MRI and intraoperative real-time TRUS has been proposed [55–57]. This method critically depends on the assumption of spatially correct co-registration between intraoperative decubitus ultrasound and pre-procedural supine MRI in the presence of extreme tissue motion and deformation, a problem that, at the moment, does not have a clinically robust solution. A sufficiently accurate and robust solution will undoubtedly turn up, but this approach will always suffer from the lack of direct and immediate pathological evidence of whether the registration was indeed correct and the biopsy was executed as planned in MRI. In contrast to the image fusion-based approach, in situ MRI-guided biopsy eliminates spatial uncertainty and doubt from the procedure.
Robotically Assisted MRI-Guided Prostate Biopsy
Although the use of MR imaging in prostate cancer biopsy and therapy guidance is highly desirable, physical limitations of conventional closed MRI scanners present significant obstacles. Robotic assistance is the only viable option to execute needle placement inside the long cylindrical bore of conventional MRI scanners. Compounding the challenges further, the strong magnetic field excludes the use of most metals, electronics, and electrodynamic actuation. Despite or perhaps owing to these challenges, MRI-guided prostate cancer interventions have been a subject of intense research. The prostate has appeared to be a kind of anatomical target that is accessible for minimally invasive needle-based interventions through either the skin or a body cavity particularly when there is a well-defined boundary; the prostate is not entirely rigid but also not exceedingly soft and when the prostate is not entirely stationary but also not prohibitively mobile. In short, coincident demand from the clinical side and supply from engineering side propelled medical robotics to be the subject of recent activities in needle-based prostate cancer interventions. Thus far, however, very little of those works have reached clinical patient trials, owing to the formidable difficulties that we will review shortly.
Technical Challenges Arising from MRI
In addition to previously mentioned challenges, MRI-guided robotic biopsy involves more difficulties, each of which we will elaborate on next.
Accuracy
Prostate cancer is a progressive disease, the malignant potential of which increases with tumor volume. A 0.5 cc prostate cancer volume has been proposed as the limit of clinically significant prostate cancer foci, which is a volume that corresponds to a tumor sphere with a diameter of 9.8 mm. An MRI-guided biopsy system employing a targeting accuracy of 5 mm or better could reliably sample clinically significant prostate cancer foci. Although it may seem like a lenient requirement, it has been notoriously difficult to meet in a consistent and reliable manner in clinical trials, which explains why there have been just a very few MRI-guided robotic intervention systems ever used on actual patients.
Workspace
To have a direct access to the patient during imaging inside the long and narrow scanner bore, compactness is a major requirement. The end effector, the part that makes contact with the patient, is usually designed to be small and slender, while the actuation, power, and control mechanisms may be larger as they can be situated outside the bore.
Related posts:
 Visualization and Display for Image-Guided Therapy
 Multimodality Navigation in Neurosurgery
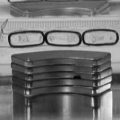 Image-Guided Robotics in Minimally Invasive Therapies
 Innovations in Ultrasound Instrumentation for Image Guidance
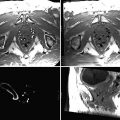 Image-Guided Prostate Brachytherapy
 CT-Guided Interventions: Current Practice and Future Directions
Stay updated, free articles. Join our Telegram channel

Full access? Get Clinical Tree


