Fig. 20.1
Work flow of standard congenital heart disease MRI. Dark-blood or bright-blood sequences may be included for further anatomic assessment. Delayed post contrast images can be obtained at the end if necessary. 2D two dimensional, 3D three dimensional, MRA MR angiography, PC phase contrast
Images are obtained during suspended respiration in order to avoid artifact from respiratory motion. Vascular anatomy is assessed with a 3D contrast-enhanced MR angiogram (MRA). For the purposes of hemodynamic analysis in patients with CHD, multiple 2D CINE phase-contrast (PC) images are used to provide maps of the through-plane velocity of blood. CHD exams typically require multiple acquisitions which, due to the complex cardiovascular geometry, are difficult to localize and may have to be repeated several times. As a result, CHD exams require many more MR measurements compared to patients with less complex pathologies and can be up to 60–90 min in duration [26]. To ensure robust image quality for cardiovascular MRI, a dedicated phased-array cardiac coil (typically 12–32 channels) should be used.
The majority of the cardiovascular MRI protocols established for adult acquired heart disease focus on the evaluation of impaired global function, perfusion, and viability of the left ventricle that are associated with myocardial infarction and myocarditis or aortic valve disease. In patients after repair for CHD, however, the right heart is often affected either due to progressive overload as a consequence of pulmonary regurgitation or due to its function as systemic ventricle [21]. MRI-based assessment of the right ventricle is more challenging and should be adapted to the individual heart defect and type of surgical repair. Moreover, for pediatric cardiac MRI exams, it is important to adjust image parameters to the faster heart rate and smaller size of children [14]. Younger children have to be examined in sedation or during anesthesia. Therefore, sequences with diaphragm navigation are important.
In general, a CHD MRI protocol consists of four groups of acquisition techniques to obtain information on the anatomy and function of the heart and surrounding vessels:
1.
Anatomic/morphologic imaging
2.
Dynamic imaging: ventricular and valve function
3.
Blood flow quantification
4.
3D angiography
1. Anatomic assessment is typically based on bright-blood imaging using fast gradient echo and balanced steady-state free precession (SSFP) sequences in the three standard anatomic dimensions [27]. These sequences have an inherently high myocardial-to-blood-contrast and can be performed during breath-held imaging [28]. Alternatively, black-blood pulse sequences (T1- or T2-weighted fast spin echo, T2-weighted HASTE) can be applied. More recently introduced respiratory- and ECG-gated 3D SSFP pulse sequences provide high image quality and have the advantage to obtain an isotropic volumetric data set which can be reformatted in multi-planar directions [29]. Stents often lead to artifacts which tend to be more pronounced in SSFP than in T1 TSE sequences (Fig. 20.2).
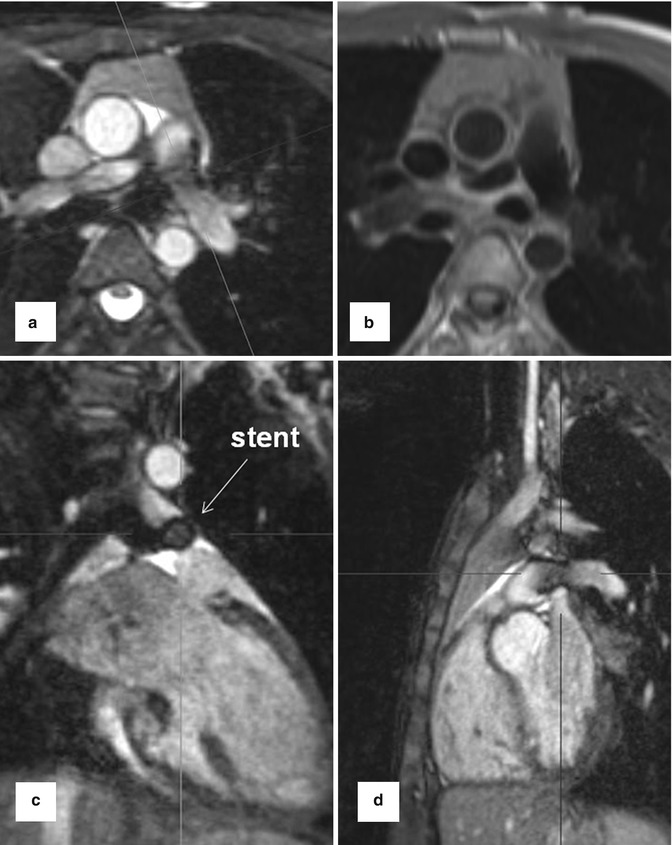
Fig. 20.2
Balanced steady-state free precession sequence with multi-planar reformations (MPR) in a patient with stent implantation in hypoplastic left pulmonary artery. (a) Axial, (c) coronal, (d) sagittal. (b) Axial dark-blood fast spin echo T1-weighted image at the level of the stent
2. ECG-gated and time-resolved 2D (CINE) SSFP sequences are used for dynamic imaging of cardiac function in the standard short-axis, long-axis 4-chamber/2-chamber/3-chamber, and axial transverse views. Additional orientations such as the right ventricular outflow tract (RVOT) or coronal may be acquired depending on the specific heart defect [30]. In addition to the assessment of ventricular motion over the heart cycle, CINE MRI can be employed to evaluate systolic and diastolic valve movements and detect valve or conduit stenosis and insufficiency. 2D CINE images covering the heart (“short-axis stack” sections from base to apex) are used for the quantification of global cardiac function (stroke volume, ejection fraction) as well as ventricular mass and volumes. The summation disc method for ventricular volume calculation and ejection fraction is considered the clinical reference standard [31, 32]. Cardiovascular MR measurements show good interobserver variability and high reproducibility [33–35], and there are several studies which provide age- and gender-specific reference values for right ventricular volumes for adults [36] and pediatric patients [37, 38]. The right ventricle differs from the left ventricle in its geometric shape but also in the more trabeculated myocardium and thinner wall. Due to its complex geometry, image acquisition of multi-slice 2D CINE MRI in axial orientation has been suggested as the method of choice by a number of groups [39, 40] (Fig. 20.3).
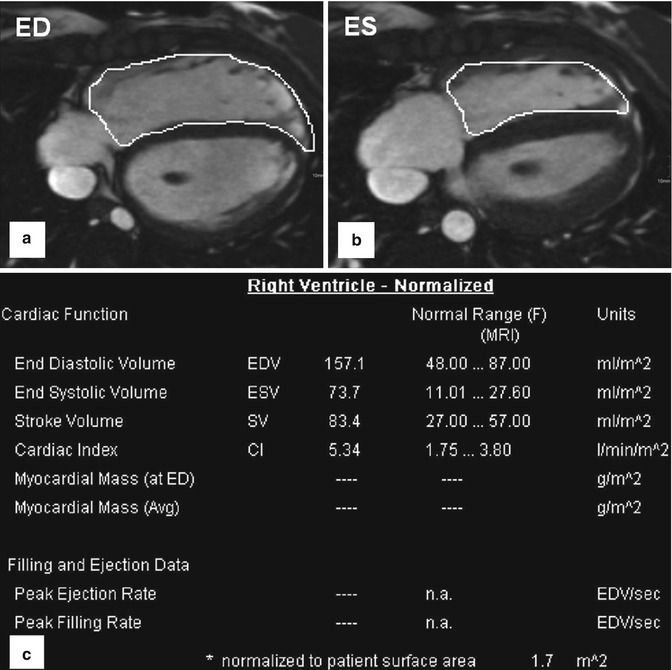
Fig. 20.3
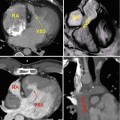
Volumetry of the right ventricle based on axial (transversal) cine-balanced steady-state free precession sequence images. (a) ED end diastole. (b) ES end systole. (c) Table shows an example for normalized to body surface area cardiac parameters for a female 14-year-old patient with enlarged right ventricle after surgery for tetralogy of Fallot
3. For the assessment of aortic and pulmonary valve disease or intracardiac shunts, 2D CINE phase-contrast (PC) MRI with through-plane velocity encoding is applied [41]. This technique allows quantifying blood flow (net flow, peak velocity, regurgitant fraction) to evaluate vessel, valve or conduit stenosis or intracardiac shunts (Fig. 20.4). Using the simplified Bernoulli equation, the pressure gradient over a stenosis can be estimated. Similar to direct trans-stenotic pressure measurements invasively acquired by catheter or echocardiography, pressure gradients can be estimated following the modified Bernoulli equation ΔP = 4(υ 2). A further clinical application of 2D CINE PC MRI is the evaluation of shunting, which is indicative of septal defects allowing blood transfer from the arterial to the venous system or vice versa (from the system with the higher to the lower pressure). To quantify shunt volume, two flow measurements are performed. 2D CINE PC MRI in the ascending aorta and in the pulmonary artery is used to quantify the left and right ventricular stroke volumes, QS and QP, respectively. The ratio of QP/QS represents the direction of shunt and the shunt volume. For QP/QS = 1, no shunt is present; if QP/QS > 1, a shunt from the aortic circulation to the pulmonary circulation is present and vice versa for QP/QS < 1.
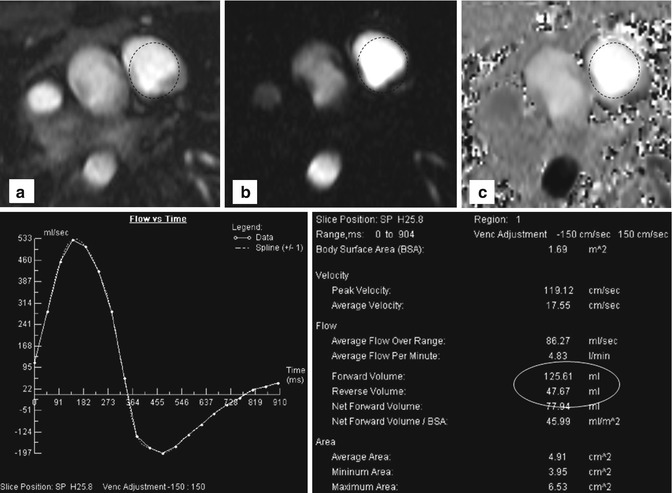
Fig. 20.4
Two-dimensional phase-contrast imaging with region of interest (dotted circles) in the pulmonary trunk: (a) Cine, (b) magnitude, and (c) phase-encoding image of a patient with relevant pulmonary reflux. Flow-time curve reveals retrograde flow below the x-axis. Table shows quantitative data with a regurgitation fraction of about 38 %
2D CINE PC MRI is a valid technique that can easily be performed in simple vessel geometries. For complex anatomic situations after the repair of a congenital heart defect, however, flow measurements in multiple 2D planes are often needed to capture the complex hemodynamic situation. This can be a rather challenging task, even for experienced technicians and radiologists. Measurements often have to be repeated due to incorrect velocity encoding or placement and angulation of imaging planes.
4. Gadolinium contrast-enhanced MR angiography (CE MRA) often reveals more detailed anatomic information of the surrounding vessels compared to the standard anatomic sequences and can depict aortopulmonary collaterals. CE MRA can be performed as a high spatial resolution angiography which can depict, for example, small collateral vessels in aortic coarctation (Fig. 20.5). In other cases the use of time-resolved MRA is preferred which allows to depict the dynamics of the passage of the injected contrast medium through the different cardiac compartments and vessels to simultaneous assess the pulmonary arteries, aorta, and shunts [42, 43] (Fig. 20.6). Additional late-enhancement imaging for viability imaging may be considered to evaluate potential left or right ventricular fibrosis or scars due to coronary insufficiency.
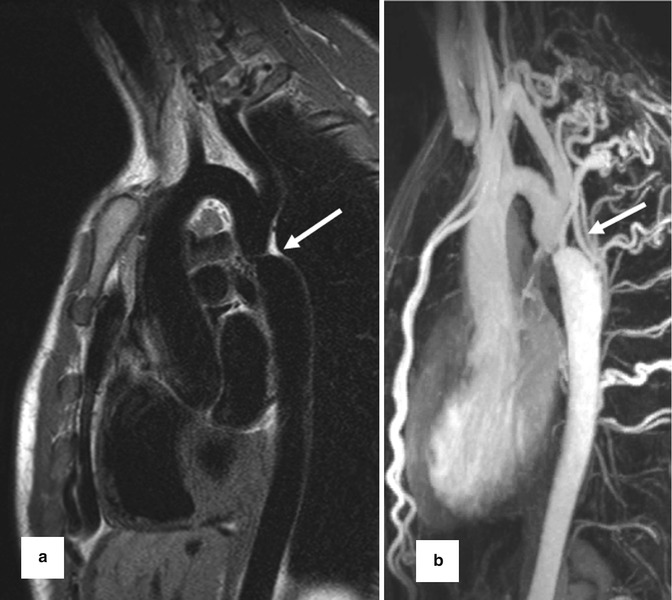
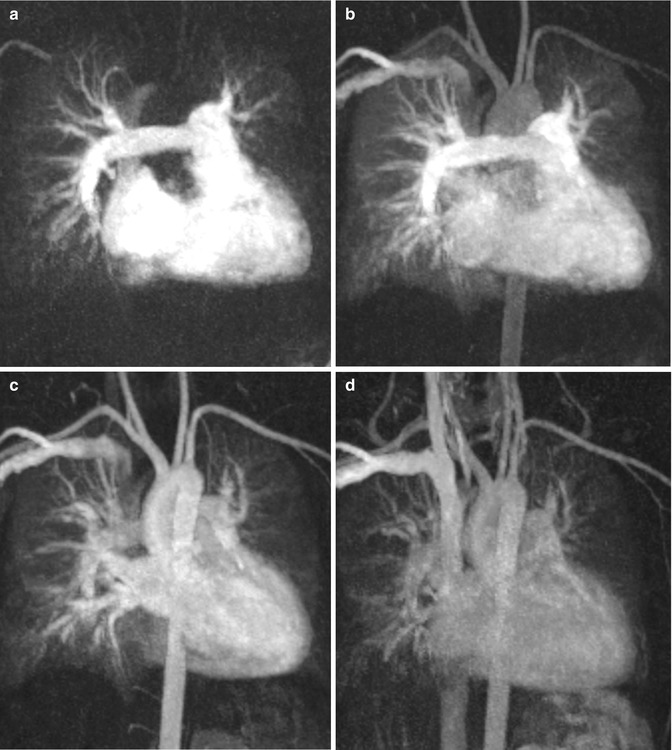
Fig. 20.5
(a) Dark-blood T2 pulse sequence reveals aortic coarctation (arrow). (b) High spatial resolution contrast-enhanced MR angiography for depiction of multiple collateral arteries (intercostal and internal mammary) in (arrow) aortic coarctation
Fig. 20.6
Time-resolved contrast-enhanced MR angiography in a patient with repaired tetralogy of Fallot at four different time steps: (a) At 25 s after gadolinium injection, (b) at 30 s, (c) at 35 s, (d) at 46 s. (a) The right atrium, ventricle, and pulmonary arteries are equally enhanced. (b) Enhancement of the right heart, pulmonary arteries, and veins; beginning enhancement of the aorta and supra-aortic branches. (c) Persisting pulmonary vessel enhancement which does not interfere with the left ventricle and sharp aortic enhancement. (d) Residual contrast medium in the heart, pulmonary vessels, and aorta in the venous phase due to prolongated contrast-medium injection
Traditionally, MR imaging of flow using PC sequence is accomplished by using methods that resolve single-directional flow in two spatial dimensions of an individual slice. More recently, 3D spatial encoding combined with three-directional velocity encoded PC MRI (4D flow MRI) has drawn increased attention. 4D flow MRI offers the ability to measure and to visualize the temporal evolution of complex blood flow patterns within an acquired 3D volume. 4D flow MRI has become a valuable method for the comprehensive assessment of 3D cardiovascular hemodynamics within a wide range of applications [44–50]. Using 4D flow MRI, pathological blood flow patterns in the aorta caused by aortic valve disease or aortic coarctation or in patients with Marfan syndrome have been evaluated in comparison with normal aortic hemodynamics [51–55]. Correlations between morphologic changes and flow alterations as well as the development of aneurysms and abnormal wall shear stress were examined [52, 56–58]. The 4D flow MRI acquisition scan can be prescribed as a single 3D volumetric acquisition covering the whole mediastinal cardiovascular system and therefore has several advantages in comparison with multiple 2D PC MRI: (1) All vessels of interest are scanned within on a single measurement, (2) pre- and post-processing tools allow investigation of blood flow at any location in the vessel of interest at every time point during the heart cycle, and (3) 3D visualization of complex blood flow patterns.
Since the acquisition of volumetric data requires considerably longer total scan times (up to 20 min) compared to traditional 2D CINE PC MRI, exams can no longer be performed during a breath hold. Patient breathing can cause data inconsistencies that result in image ghosting and blurring. Therefore, respiratory gating is usually applied to minimize artifacts. Most widely available approaches include bellows reading or navigator gating of the diaphragm movements. Overall scan time depends on heart rate and efficiency of respiration control and takes about 5–10 min for a volume covering the thoracic aorta and 10–20 min for whole-heart acquisitions.
To subsequently analyze the flow data by quantitative means and visualization of complex, three-directional blood flow patterns various tools have been proposed. The complex nature of the 4D flow MRI data (three spatial dimension, three velocity directions, and time within the cardiac cycles) imposes the challenge to translate the multidimensional information into images that can clearly depict the underlying anatomic and functional information. The combination of angiographic data (3D PC MRA) and 3D blood flow visualization, which can both be derived from the 4D flow data, can be powerful tools to efficiently display vascular anatomy and blood flow in 3D and over time.
There are different methods for the visualization of three-directional blood flow including 3D streamlines, time-resolved 3D pathlines, and 2D vector graphs. Vector graph displays the magnitude and direction of blood velocity within a specific voxel, encompassing all three measured velocity directions; 3D streamlines are used to describe an instantaneous path tangent to the velocity vectors at a specific point in time and provide an overview over flow field patterns at a specific point within the cardiac cycle. Time-resolved pathlines can be considered massless particles that display the temporal evolution of the blood flow velocity data over one or multiple heartbeats. Both streamlines and pathlines can be color-coded according to the flow velocity magnitude which allows a clear visualization of the velocity distribution within the cardiac chambers and vessels. Alternatively, traces can be color-coded according to their vascular origin to identify complex flow pathways in complex cases of CHD (Fig. 20.7).
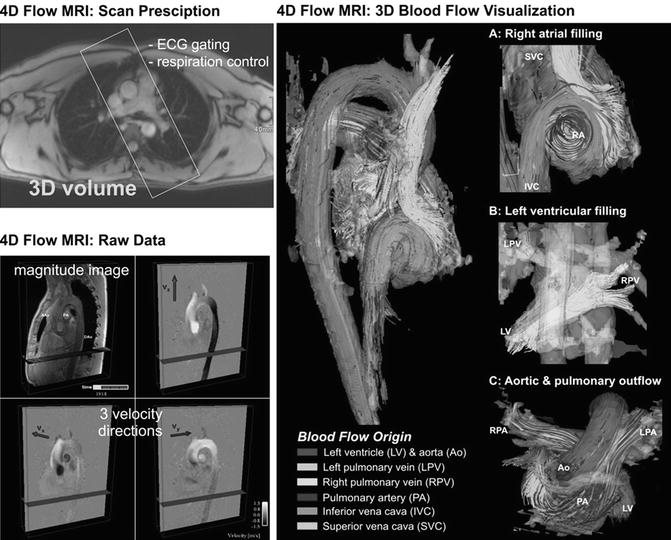
Fig. 20.7
Four-dimensional (4D) flow MRI data acquisition: Measurements are synchronized with the ECG cycle and the resulting raw data comprise information along all three spatial dimensions, three velocity directions, and time in the cardiac cycle. 3D blood flow visualization of the heart and large vessels using streamlines show the large-scale intracavity flow structures in ventricular systole and diastole in a healthy volunteer. Color coding is based on the streamline origin
Since 4D flow MRI data reflect the true underlying time-resolved blood flow velocity vector field, it is possible to perform quantitative analysis of the measured blood flow. Previous studies have demonstrated close agreement for flow derived from standard time-resolved 2D and 4D data [59, 60].
The aforementioned advantages play a key role for the use of 4D MRI technique in repaired CHD, particularly for the evaluation of the pulmonary arteries and the low-pressure system which is affected more frequently in this patient cohort than in adults with acquired valve or heart diseases.
Tetralogy of Fallot After Repair
Tetralogy of Fallot (TOF), the most common cyanotic congenital heart defect, accounts for about 5–10 % of all congenital heart diseases [61, 62]. Based on the main defects of this relatively common CHD (pulmonary stenosis, ventricular septal defect (VSD), overriding aorta, and hypertrophy of the right ventricle), these patients usually undergo corrective surgery in their first year of life. Advances in diagnosis, surgical techniques, and postoperative treatment have led to an increasing number of patients reaching adulthood [63] and a high survival rate of almost 90 % at 30 years [64].
Surgical treatment for TOF consists of the closure of the VSD and reconstruction of the RVOT [65]. Despite the great progress of surgical management, the majority of adult patients are burdened with functional abnormalities which can usually be tolerated well until adolescence [66]. Different surgical techniques have been used for RVOT reconstruction: homograft, transannular patch, or a valve-preserving technique. Despite the success of these interventional techniques, restenosis or aneurysm formation of the pulmonary outflow tract can complicate the patients’ mid- and long-term outcome [67, 68]. Pulmonary valve insufficiency with consecutive right ventricular volume overload is the most common and serious postoperative long-term complication in more than 70 % of TOF patients after repair [69, 70]. Progressive right ventricular dilatation or reduced ventricular function is an indicator of the need for valve replacement [71, 72].
MRI is superior to echocardiography for the evaluation of pulmonary artery stenosis, for detecting and quantifying pulmonary valve insufficiency, for assessing right ventricle volume, and for monitoring progression of pulmonary regurgitation and right ventricular dilatation [22, 24, 73]. The role of MRI as the preferred noninvasive imaging modality in patients with repaired TOF has gained international acceptance [66].
Standard MRI protocols based on ECG-gated SSFP sequences provide anatomic and volumetric information. Typically, the right ventricle is dilated and has a thickened trabecular wall. In the 4-chamber view, the interventricular septum is shifted backward to a horizontal position. Proximal stenosis of the left pulmonary artery (LPA) can often be observed on anatomic images, occasionally in association with poststenotic ectasia or in conjunction with hypoplastic LPA (Fig. 20.8). Time-resolved contrast-enhanced MRA can provide information on abnormal lung perfusion by depicting asymmetric contrast-medium distribution to both lungs (Fig. 20.8). MRA can additionally help to detect abnormalities of the aorta and supra-aortic arteries. In this context, post-processing of the MRA data to generate 3D surface-rendered or maximum intensity projection (MIP) images can often provide an improved 3D impression of the aortic and pulmonary vasculature (Fig. 20.9).
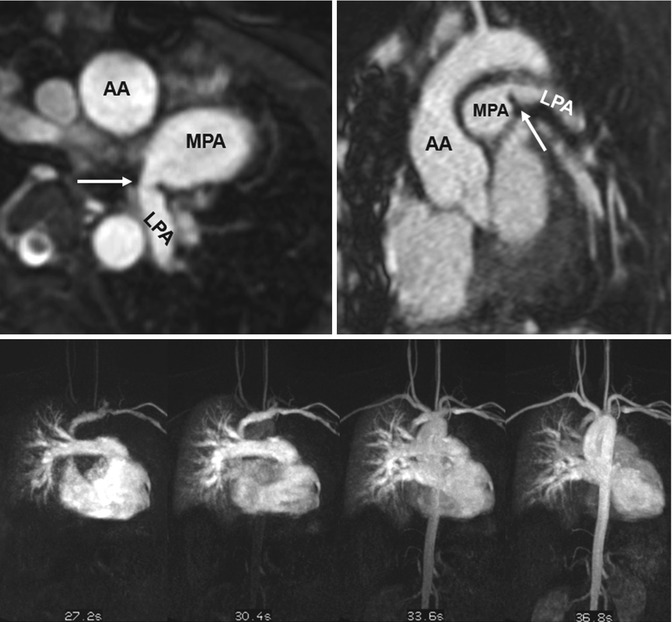
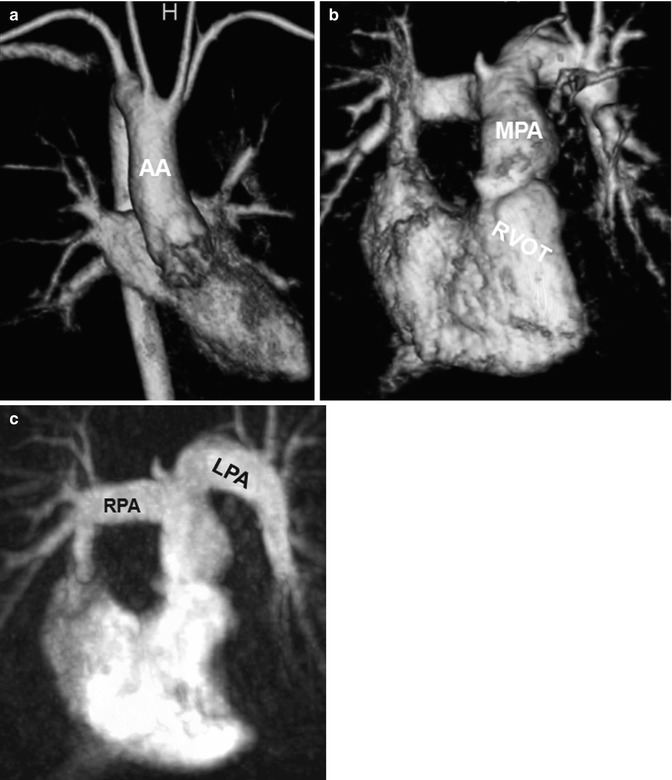
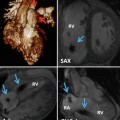
Fig. 20.8
(a) Axial and (b) sagittal balanced steady-state free precession (SSFP) images show high-grade proximal left pulmonary artery (LPA) stenosis in a Fallot patient (arrows); the poststenotic LPA is hypoplastic. (c) Time-resolved MR angiographies at four different time steps show markedly delayed and reduced contrast-medium filling of the LPA and peripheric lung vessels. AA ascending aorta, MPA main pulmonary artery
Fig. 20.9
Tetralogy of Fallot. (a) Volume-rendered anterior view of the systemic circulation shows a right aortic arch. Volume-rendered (b) and maximum intensity projection (c) images of the pulmonic circulation show ectatic right ventricular outflow tract (RVOT) and the pulmonary arteries with a curved shape of the left pulmonary artery (LPA). AA ascending aorta, RPA right pulmonary artery, MPA main pulmonary artery
2D CINE MRI in oblique sagittal orientation to depict the RVOT should be acquired in addition to basic 4- and 2-chamber views. By viewing 2D CINE images dynamically over the cardiac cycle, jet flow phenomena or flow turbulences caused by valve stenosis or insufficiency can be observed in the pulmonary outflow tract and pulmonary arteries of repaired TOF patients (Fig. 20.10). To quantify aortic and pulmonary blood flow and the degree of valve regurgitation, 2D PC MRI is used. Postsurgical anatomy often complicates 2D PC MRI planning, and RVOT 2D CINE images can facilitate the exact placement of the 2D PC plane in the main pulmonary artery.
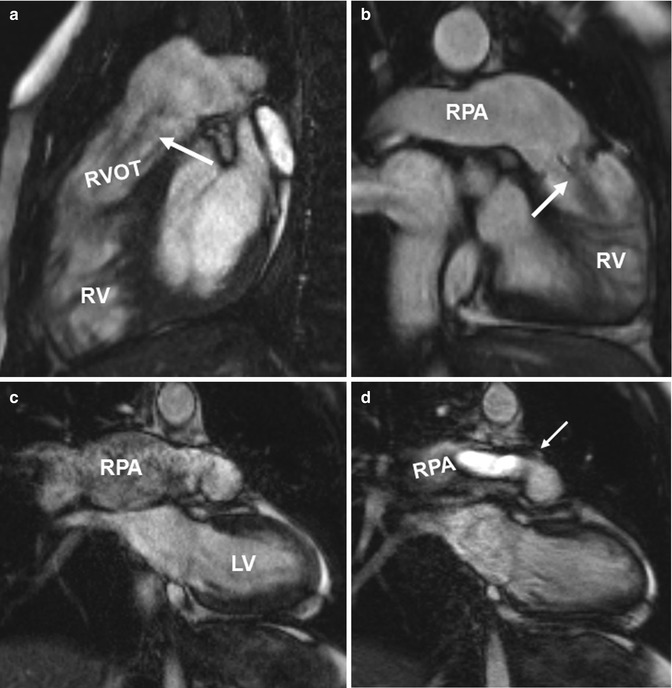
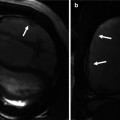
Fig. 20.10
(a) Sagittal and (b) oblique coronal balanced steady-state free precession (SSFP) images in two patients with tetralogy of Fallot depict ectatic right ventricular outflow tract (RVOT) with a low signal jet in diastole due to pulmonary valve insufficiency (arrows). Ectasia of the pulmonary trunk distal the valve is seen in both cases and the right pulmonary artery (RPA) dilatation is seen in the second case. (c, d). Coronal CINE SSFP images show signal alterations in the aneurysmatic RPA in (c) and a systolic high-velocity flow jet (arrow) in the RPA in (d). RV right ventricle, LV left ventricle
For the assessment of ventricular volumes and global cardiac function, 2D CINE SSFP planes in the ventricular short axis, which is preferred for biventricular volumetry, or in the axial plane should be performed. Both views allow for visual evaluation of regional wall motion abnormalities and ventricular asynchrony in contraction and relaxation.
This standard MRI protocol described above provides a broad overview over anatomy and function of the repaired heart after TOF but does not provide detailed information on potential right heart flow alterations associated with post-repair TOF. Since altered hemodynamics can result in right ventricular dilatation and thus at risk for sudden death and tachyarrhythmias [74], it is vital to obtain a better understanding of in vivo 3D flow patterns in TOF patients.
4D flow MRI pilot studies have shown that color-coded visualization by streamlines or particle traces can demonstrate increased peak velocity in the pulmonary trunk of TOF patients compared to normal controls. Higher flow velocity was frequently observed even in the absence of residual or restenosis of the RVOT (Fig. 20.11). Blood flow distribution to the right and left lung can easily be appreciated and measured by 4D MRI leading to an assessment of potential abnormal flow ratios (Fig. 20.12). In addition, 4D flow MRI can visualize diastolic retrograde flow in the pulmonary arteries and the RVOT (Figs. 20.11 and 20.12). A more precise assessment of pulmonary regurgitation is obtained by quantitative measurements. Accurate positioning of planes for regional flow quantification can be challenging in standard 2D phase-contrast imaging, particularly in TOF where the left pulmonary artery is often angulated or hypoplastic. Incorrect plane placement cannot be corrected after 2D data acquisition whereas the 4D data allow retrospectively for correct quantification of the regurgitation fraction. Feasibility studies depicted flow disturbances in the pulmonary trunk in terms of vortices or increased helical flow patterns which may be associated with pulmonary artery dilatation (Fig. 20.13). This observation has already been made in previous 4D flow MRI studies of the aorta showing that abnormal flow patterns and vortices contribute to ineffective vascular flow [56, 57, 75]. Similarly, pulmonary trunk abnormalities may influence the development of regurgitation and hemodynamic alterations. These observations in small patient cohorts are promising as 4D flow MRI may help to understand pathophysiological considerations of altered hemodynamics in TOF patients.
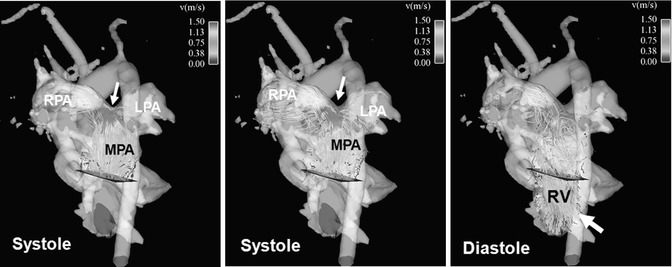
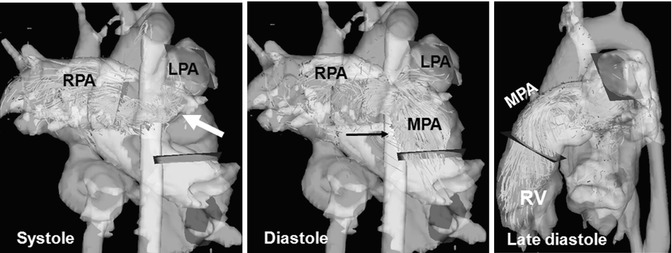
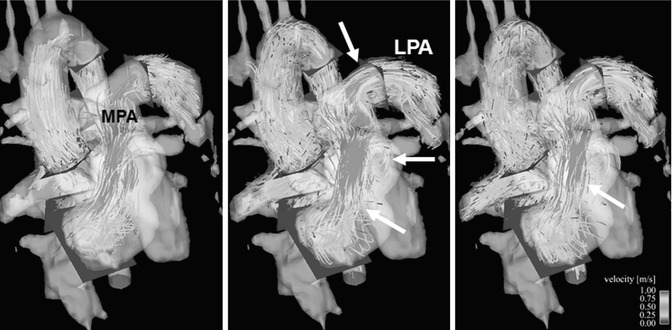
Fig. 20.11
Four-dimensional flow visualization by color-coded particle traces depicts high flow velocity above 1.5 m/s in the main pulmonary artery (MPA) and right pulmonary artery (RPA), particularly at the bifurcation during systole (arrow). There is a noticeably asymmetric flow distribution to the RPA and left pulmonary artery (LPA) although there is no vessel stenosis. Remarkable pulmonary reflux into the right ventricle (RV) can be visualized during diastole (arrow)
Fig. 20.12
Four-dimensional (4D) flow visualization of insufficient flow hemodynamics: particle traces emitted from a plane in the right pulmonary artery (RPA) flow partially backward to the left pulmonary artery (LPA) in late systole (arrow) showing strong helical flow patterns, which marked reflux to the main pulmonary artery (MPA) and into the right ventricle (RV) during the entire diastole
Fig. 20.13
Four-dimensional particle traces flow visualization of the right ventricular outflow tract (RVOT) at three different time points during systole. High flow velocity in the ectatic RVOT with helical and vortical flow disturbances (arrows), additional vortex in the left pulmonary artery (LPA) (arrows). MPA main pulmonary artery
Transposition of the Great Arteries After Arterial Switch Repair
Transposition of the great arteries (TGA) is a cyanotic congenital heart defect characterized by ventriculoarterial discordance with the aorta originating from the right ventricle and the pulmonary artery from the left ventricle [76]. Initial surgical interventions by Senning and modification by Mustard (atrial switch procedures) left the right ventricle acting as the systemic ventricle [77, 78]. In this procedure, intra-atrial baffles were used to direct the blood to the corresponding ventricle, resulting in a physiological but not anatomic repair [79]. This condition gives rise to complications such as arrhythmia, progressive ventricular dysfunction, and heart failure [80, 81]. Subsequently, the treatment for TGA has been modified and is nowadays based on the arterial switch procedure during the neonatal period (Jatene principle) which involves a surgical correction of the arterial displacement [82]. The arterial switch operation consists of transection of the aorta and the main pulmonary artery at their roots to correct the ventriculoarterial discordance with transfer of the coronary arteries to the neoaortic root (Fig. 20.14).
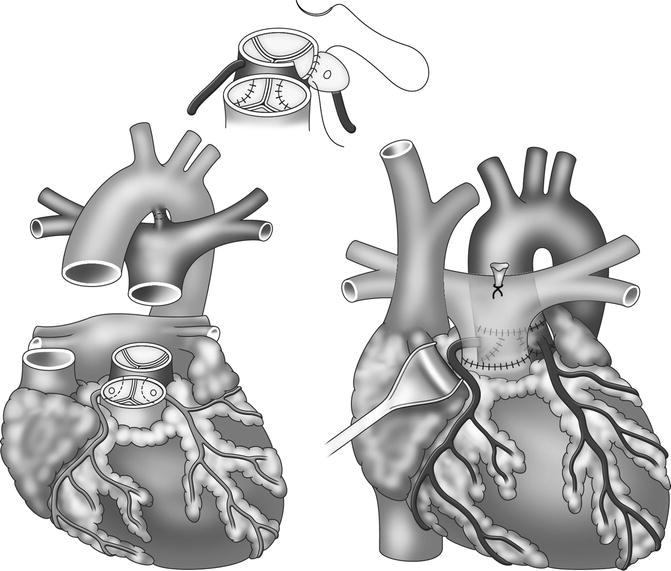
Fig. 20.14
Outline of arterial switch procedure in transposition of the great arteries
In the typical postoperative Lecompte position, the pulmonary trunk is located anterior to the ascending aorta and the pulmonary arteries embrace the ascending aorta [83]. In some cases, e.g., in case of associate defects such as VSDs, the classical Lecompte position cannot be accomplished and the left pulmonary artery is routed posterior to the ascending aorta (Fig. 20.15).
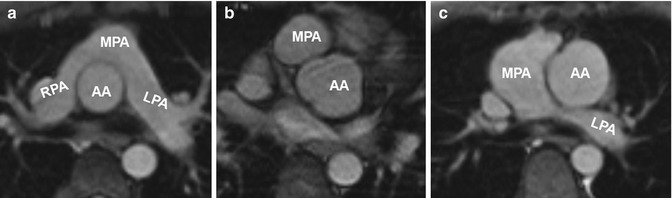
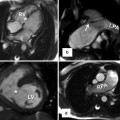
Fig. 20.15
(a) Axial image of balanced steady-state free precession (SSFP) sequence in a patient with transposition of the great arteries (TGA) after arterial switch procedure reveals the “typical” postsurgical anatomy with anterior main pulmonary artery (MPA) location and Lecompte position of the pulmonary arteries. (b) Axial SSFP image in another patient shows the MPA located right anterior in relation to the ascending aorta (AA) which has an ectatic root. (c) Axial SSFP slice demonstrates an ectatic MPA and an atypical course of the left pulmonary artery (LPA) dorsal the AA. RPA right pulmonary artery
Most common midterm and long-term complications include stenosis of the right ventricular outflow tract and the pulmonary arteries, coronary artery stenosis, aortic root dilatation, or valve insufficiency [84–88]. A recent study by Kempny and coworkers reported that coronary complications and aortic valve dysfunctions are rare. In contrast, RVOT obstructions or pulmonary valve insufficiencies were more frequently observed and lead to re-intervention [89]. Therefore, regular follow-up by echocardiography and MRI is mandatory to monitor ventricular size and function and to identify vessel stenosis or valve insufficiency needing intervention [90]. Echocardiography is challenging for older children due to the limited acoustic window by the postsurgically retrosternal location of the pulmonary trunk and the pulmonary arteries [91]. The complex postsurgical cardiovascular geometry requires multi-planar acquisitions as either dark-blood T2 HASTE or bright-blood SSFP MRI to completely capture the altered anatomy and detect a potential RVOT stenosis (Fig. 20.16) [92–95]. In analogy to the follow-up of Fallot patients, the use of 3D SSFP sequences with free-breathing and full volumetric coverage can facilitate the assessment of the complex cardiac anatomy and the measurement of vessel diameters [96].
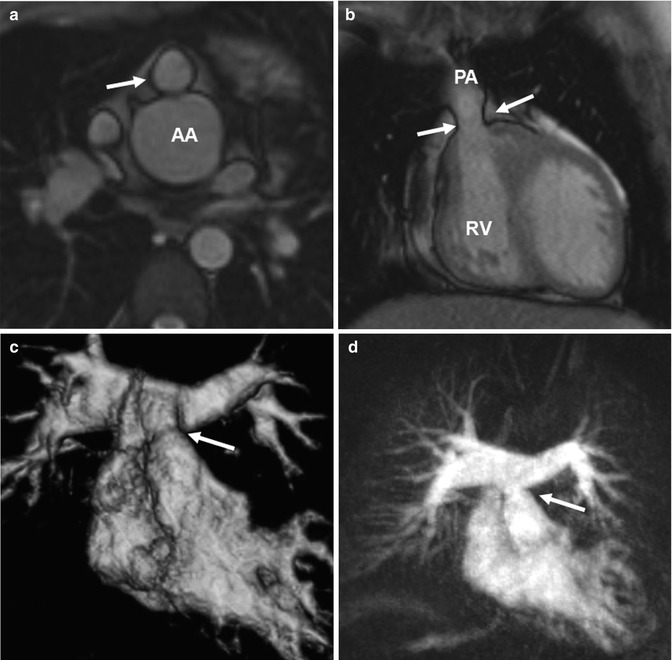
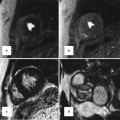
Fig. 20.16
(a) Axial and (b) coronal balanced steady-state free precession (SSFP) images show valvular pulmonary stenosis (arrows) and aortic root dilatation after arterial switch. (c) Volume-rendered and (d) maximum intensity projection images of another patient with a moderate supravalvular pulmonary artery stenosis (arrow) but no pulmonary valve stenosis and with regular symmetric contrast enhancement of both lungs. AA ascending aorta, RV right ventricle, PA pulmonary artery
Time-resolved CE MRA is most useful for the assessment of the extracardiac anatomy. It has the potential to demonstrate segmental pulmonary artery stenosis or morphologic alterations of the pulmonary trunk and the aortic root (Fig. 20.16). Because of the subsequent contrast filling of the different cardiac compartments, a detailed depiction of the vessels is warranted without interfering overlay by venous structures or suboptimal timing in contrast-medium arrival time using standard 3D MRA. In addition, information on the dynamics of the passage in the contrast agent through the cardiovascular system can be used to detect symmetric or delayed perfusion of the right and left pulmonary system (Fig. 20.17).
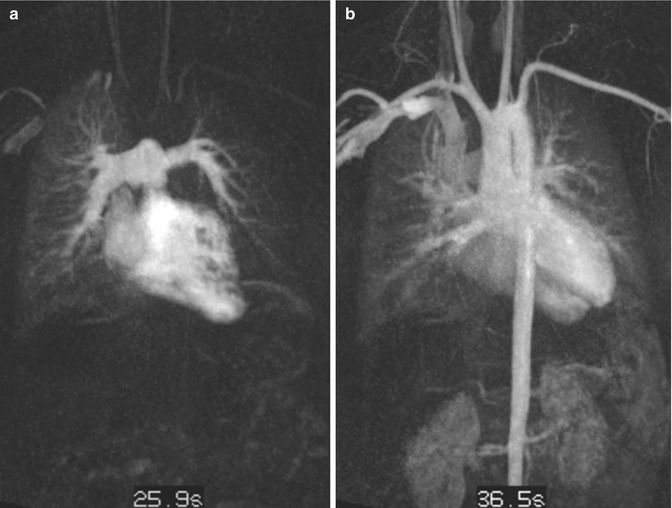
Fig. 20.17
Transposition of the great arteries (TGA) after arterial switch procedure. Time-resolved contrast-enhanced MR angiography at two different time steps. (a) Pulmonary contrast filling reveals asymmetric and delayed contrast enhancement of the left lung. (b) Aortic enhancement with slight venous overlay by pulmonary veins and capillary vessels
For the evaluation of ventricular function, a series of 2D CINE SSFP images is obtained in standard planes (4-chamber, 2-chamber, short-axis stack) and for the RVOT and LVOT. Similar to Fallot patients, an axial image stack may be used to assess the right ventricular volume. For flow quantification to evaluate valve insufficiency and residual shunts, 2D PC MRI is performed at the level of the ascending aorta and main pulmonary artery [97]. Blood flow in the pulmonary arteries can also be evaluated with 2D CINE PC MRI to investigate pulmonary stenosis arising from morphologic vessel lumen changes during the heart cycle [91].
Related posts:
Stay updated, free articles. Join our Telegram channel

Full access? Get Clinical Tree


