Abstract
This chapter discusses the recent progress in echocardiography, nuclear imaging techniques, CMR, and CT in characterizing patients with acute myocardial infarct. It will expose the pathophysiology of acute infarcts and the principles by which non-invasive imaging techniques allow the identification of different characteristics of infarcted myocardium such as necrosis, area at risk, microvascular obstruction, edema, hemorrhage, and altered metabolism and innervation. Next, it will discuss the clinical role of the different imaging techniques in patients with infarct and, in particular, for diagnosis of acute infarct, detection of acute and chronic complications, post-infarct remodeling, prediction of prognosis, identification of high risk patients, and selection of device and revascularization therapy. Finally, we attempt to provide an outlook on new and upcoming developments in infarct imaging for each of the respective imaging techniques.
Keywords
Myocardial infarct, Echocardiography, SPECT, Cardiac MR, Cardiac CT
10.1
Introduction
Acute myocardial infarction (MI) is defined as death of the myocytes (myocardial necrosis) in a clinical setting consistent with acute myocardial ischemia [ ]. Echocardiography, nuclear imaging techniques, CMR, and CT play an important role in detecting and following patients with acute MI (AMI).
10.1.1
Pathophysiology of AMI
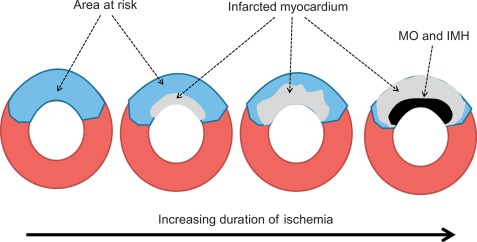
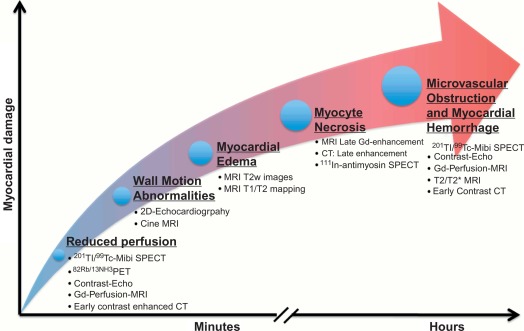
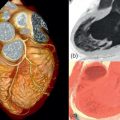
AMI is most often caused by acute coronary artery plaque rupture and thrombosis, but it may also occur due to vasospasm, myocardial supply-demand imbalance with or without associated stable coronary artery disease (CAD), or after revascularization procedures. AMI develops generally when myocardial ischemia lasts for more than 20 min. Because myocardial workload is higher and perfusion is less in sub-endocardial areas, infarcts spread in a wavefront phenomenon from sub-endocardial to epicardial layers with increasing duration of ischemia [ ] ( Figure 10.1 ). Complete transmural necrosis of the ischemic area of risk usually occurs when ischemia lasts longer than 4–6 h, depending on the severity of the coronary artery occlusion, the presence of collateral circulation, preconditioning, and the individual oxygen demand/supply balance. Intermittent durations of ischemia less than 4–6 h result therefore in incomplete mostly subendocardial necrosis, in which part of the area at risk remains viable. This concept is fundamental to current revascularization therapy of AMI. Indeed, modern treatment strategies of AMI aim at opening the infarct-related artery as quickly as possible, in order to reduce the duration of ischemia and to save viable myocardium in the risk area. The importance of saving such viable myocardium was underscored by the recent OAT trial [ ], which demonstrated no benefit of opening the infarct-related artery by PCI in patients having suffered an STEMI more than 3 days ago, likely because in such subacute STEMI the window of action for saving residual viable myocardium had expired. Experimental studies showed that additional myocardial injury may occur at the time of reperfusion or shortly thereafter [ ]. This suggests that the relation between risk area and final MI size for a given duration of occlusion could be still modified at the time of reperfusion by administration of “cardioprotective” drugs; however, clinically, none of such drugs are currently available.
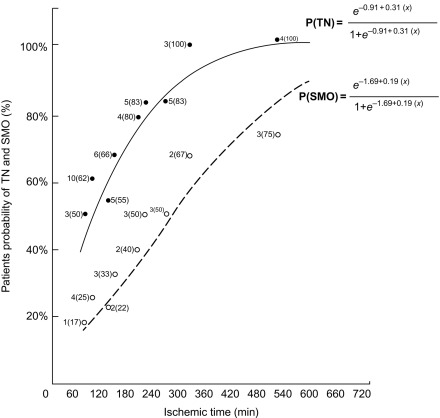
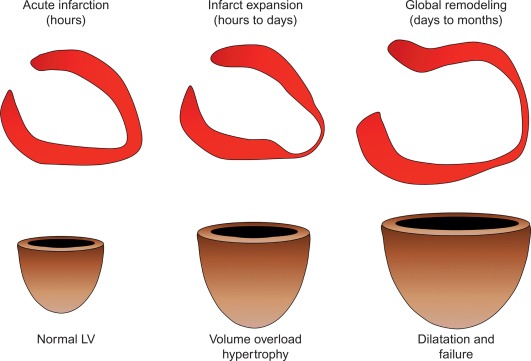
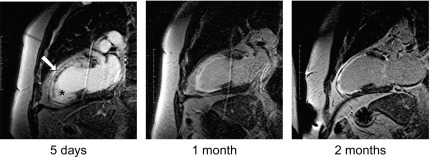
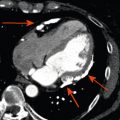
By histology, AMI is characterized by coagulation and contraction band necrosis of myocytes. In addition, AMI leads to the destruction of the extracellular matrix, and in the center of large infarcts, to destruction and occlusion of the microvasculature (the so-called no-reflow phenomenon) [ ], may be complicated by intramyocardial hemorrhage ( Figure 10.2 ). Non-infarcted post-ischemic areas may present with myocyte and interstitial edema. Subsequent to the acute injury is a complex healing process occurring in several different phases both in the infarcted area, the MI border zone, and in remote non-infarcted areas [ , ]. In the infarcted area, after an initial inflammatory phase leading to detersion of dead myocytes and other cellular debris, follows a proliferative phase characterized by neoangiogenesis and myofibroblast proliferation aiming to reconstitute a new extracellular matrix. Finally, MI healing is concluded when mature fibroblasts deposit a solid collagen-based extracellular scar (replacement fibrosis), approximately 4 weeks after the acute injury. During the phase of MI healing, the left ventricle (LV) can undergo significant remodeling ( Figures 10.3 and 10.4 ) caused by different underlying mechanisms: In the first days after infarction, the infarcted area may present significant expansion through sliding of myocytes during the inflammatory phase before collagen deposition has stabilized the extracellular matrix. This occurs particularly in areas where the extracellular matrix and microvasculature have been heavily damaged, such as in areas of microvascular obstruction. At later times, border zone and remote myocardium present left ventricular remodeling also occurring through adaptive hypertrophy of non-infarcted cardiomyocytes and extracellular matrix. These processes can continue for several months after AMI. Unfavorable MI healing and excessive remodeling may result in infarct thinning, ventricular dilatation, functional mitral regurgitation, and ultimately heart failure (HF).
10.1.2
Principles of detection of MI and associated phenomena by imaging techniques
Imaging techniques can detect AMI by various principles ( Table 10.1 ) based on the different phenomena occurring during the ischemic cascade ( Figure 10.5 ). Most often, AMI is revealed indirectly by demonstrating the presence of new regional wall motion abnormalities (WMA) or of new fixed perfusion defects. These features are, however non-specific, since they may occur also in acute other diseases mimicking acute coronary syndromes (ACSs), such as aborted MI with myocardial stunning, Takutsubo cardiomyopathy, myocarditis, etc. Definite detection of myocardial necrosis is allowed by late gadolinium-enhanced (LGE) CMR (and late contrast enhancement on MDCT) in typical subendocardial or transmural location corresponding to the distribution of coronary arteries. Myocardial necrosis can also be detected by 99m Tc-pyrophosphate or 111 In-antimyosin antibody imaging, which are, however, rarely used today because of their inability to early identify the occurrence of the acute event. Fibrosis in chronic scars may also be identified by echocardiography as regions with higher ultrasound reflection [ ].
| WMA | Global LV function | Ischemia | Coronary artery occlusion | Infarcted myocardium | Measurement of infarct size | MVO | Infarct hemorrhage | Area at risk | |
|---|---|---|---|---|---|---|---|---|---|
| Echocardiography | ++ | +++ | Possible with stress | − | − | Indirectly by WMS. EF | ++ with CE | − | Possible with intracoronary CE |
| SPECT | + | ++ | +++ | − | Possible with infarct avid tracers (rarely used) | Indirectly by perfusion defect | − | − | Possible before reperfusion |
| PET | + | + | +++ | − | Indirectly by perfusion defect/FDG defect | − | − | Theoretically possible before reperfusion | |
| MR | +++ | +++ | Possible with stress | + | Late enhancement | Area of LGE | ++ | Possible with T2/T2* T1 map | Possible by T2 imaging |
| CT | +− | + | Possible with stress | ++ | Late enhancement | Area of late-enhancement | +++ | − |
The quantification of MI size ( Figure 10.6 ) is traditionally performed in research studies by measuring Tc-99 m sestamibi defect size [ ]. This approach is, however, only valid for a first AMI. Measurements of ejection fraction or regional wall motion score at 6 weeks or later after AMI provide indirect measurements of MI size with good correlation to sestamibi defect. LGE CMR is currently the most accurate technique for measuring MI size; however, the actual size may depend on the cutoff value of signal intensity on LGE images that is used, and recent data suggests that LGE CMR performed very early after AMI may overestimate MI size [ ] as opposed to measurement performed later than 10 days. By combining LGE and T2-weighted imaging, CMR may also separate acute from chronic MI.
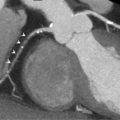
Microvascular obstruction ( Figure 10.7 ) is a phenomenon frequently associated with large infarcts and can be detected as perfusion defects in patients after reperfusion of epicardial coronary arteries. It may be revealed by various imaging techniques, in particular contrast-echocardiography, CMR, and CT. It is fairly specific, but not sensitive of AMI. It persists only for approximately 4–6 weeks after MI, and disappears thereafter, so it can provide additional information on the age of MI. Also, microvascular obstruction was shown to be an important predictor of events and left ventricular remodeling [ , ].
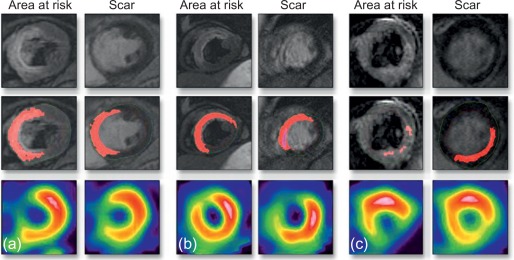
The area at risk of infarcts ( Figure 10.8 ) can be measured by intracoronary contrast echocardiography in the catheter laboratory. It can also be quantified by nuclear imaging if the tracer is injected prior to opening the occluded artery and images are acquired thereafter. These approaches are, however, rarely feasible in clinical practice and remain confined to research studies. A posteriori, that is, after revascularization, the area of edema by T2 weighted MR or non-enhanced T1 mapping provides an estimate of the initial area at risk. This seems to be possible up to several days after the acute event; however, controversy remains on the exact underlying mechanisms. Comparison of MI area and area at risk (AAR) allows an estimate of myocardial salvage [ ] of revascularization therapy.
10.1.3
Role of imaging techniques in AMI in clinical practice
Imaging techniques play a major role in diagnosis, follow-up, and prognosis of patients with AMI. Clinically, diagnosis of AMI is usually performed by a combination of clinical symptoms (i.e., chest pain or ischemic equivalents such as dyspnea or fatigue), electrocardiographic (ECG) findings such as new significant ST–T wave changes (either ST elevation or depression), development of pathological Q waves, or new left bundle-branch block and detection of rise and/or fall of biomarkers of myocardial necrosis, and in particular of troponin I or T. For the detection of STEMI, the ECG by itself is most often diagnostic, and the decision to reperfuse should not be delayed by imaging studies. Yet in some patients, and in particular in those with non-interpretable ECG such as left bundle block, or paced rhythm, the diagnosis of MI may be uncertain and may benefit from non-invasive imaging techniques to support the diagnosis of AMI. Because of its availability and ease, echocardiography is usually the technique of choice for this purpose. Also in the setting of suspected NSTEMI with normal or borderline ECG, patients may benefit from imaging studies to confirm the diagnosis and estimate the severity of ischemic injury prior to treatment initiation.
Imaging techniques play an even more important role in detecting complications of AMI . Indeed, the acute phase of MI may be complicated by HF and shock, due to severe left ventricular dysfunction, or mechanical complications such as papillary muscle rupture and acute mitral regurgitation, or left ventricular septal or free wall rupture and tamponade. Echocardiography is the technique of choice for detection of these complications. Patients with AMI can also develop intraventricular thrombi complicated by systemic embolization or stroke. This may be detected by echocardiography, but more sensitively by CMR or MDCT.
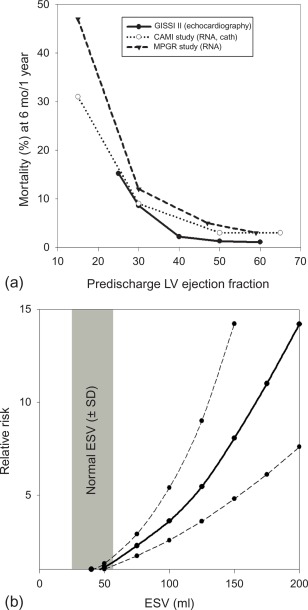
The long-term prognosis of patients with AMI is mainly determined by the magnitude size of the initial injury (MI size), by the severity of left ventricular remodeling, and by the extent of myocardial ischemia in the remote areas subtended by the stenosed artery, in particular in patients who have undergone thrombolysis and who have not been fully revascularized ( Figure 10.9 ). In clinical practice, LV ejection fraction (LVEF) and end-systolic volume are some of the most important predictors of prognosis in patients after acute ST- and NSTEMI [ , ]. Indeed, numerous studies have demonstrated that reduced LVEF predicts mortality, both due to HF and to arrhythmia [ ]. Yet because a substantial amount of myocardium after AMI may present reversible injury due to acute stunning, the initial severity of left ventricular dysfunction can overestimate true MI size and the final degree of left ventricular dysfunction. Therefore, the true MI size is more closely estimated by LVEF late (3–6 months) post AMI than by early LVEF. Also, in the acute phase of MI, viability imaging by nuclear imaging, stress echo, or direct MI size measurement by CMR/MDCT can better predict prognosis than severity of contractile dysfunction. The identification of microvascular obstruction and hemorrhage appears to have additional prognostic value.
Finally, imaging may also direct treatment . Patients with initial large infarcts and depressed ejection fraction require more clinical attention and benefit from more aggressive treatment with ACE inhibitors and beta blockers. Those who develop large ventricles due to adverse post MI remodeling and who present persistent low LVEF have substantial risk of subsequent development of HF and high risk of sudden cardiac death from ventricular arrhythmia. The MADIT-II trial demonstrated benefit of automated implantable cardioverter defibrillator (AICD) implantation in those patients. Therefore, it is necessary to evaluate the magnitude of remodeling and measurement of LVEF by cardiac imaging, 2–3 months after MI, allowing identification of high-risk patients who may benefit from AICD implantation for primary prevention. Also, nuclear myocardial innervation imaging appears to be a promising approach to identify such patients at high risk of sudden cardiac death after MI; however, this approach has not been validated for treatment selection. Finally, stress imaging techniques play an important role in detecting ischemia due to progression of coronary artery stenosis or due to in-stent restenosis post MI and to direct revascularization therapy in these patients.
10.2
Echocardiography
10.2.1
Introduction
Because of its wide availability, and its portability to the emergency room and intensive care unit, echocardiography remains the most commonly used imaging technique in patients with AMI. It allows comprehensive evaluation not only of regional wall motion and global systolic and diastolic function, but also of valve function in patients with AMI. It also allows detection of complications such as pericardial effusion, myocardial and pericardial rupture, and intraventricular thrombus. It is therefore useful not only for the initial diagnosis, but also for the follow-up of patients with AMI, and provides important prognostic information in these patients.
10.2.2
Echocardiographic techniques in use in patients with AMI
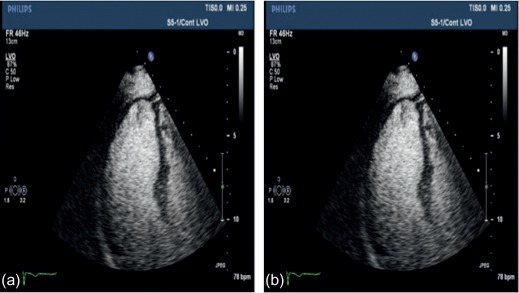
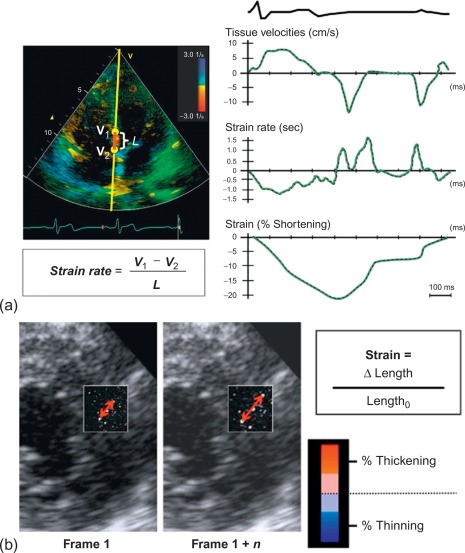
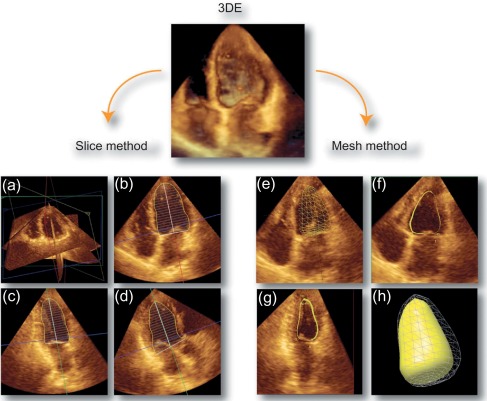
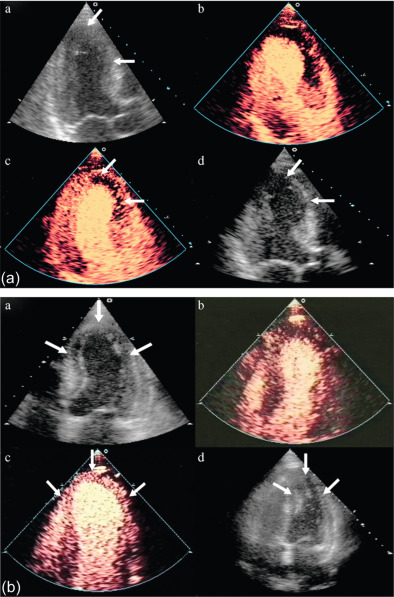
To date, echocardiography offers a multitude of techniques for assessment of patients with AMI. Standard 2D echocardiography still remains the most commonly used imaging technique and allows for the comprehensive evaluation of the dimensions of the left and right ventricles, and of their systolic global and regional function, as well as imaging of the pericardium. Doppler and tissue Doppler imaging of mitral flow patterns allows the evaluation of diastolic function and left ventricular filling pressures. Color , pulse , and continuous wave Doppler imaging allows the evaluation of valve function. Contrast echocardiography enhances discrimination between myocardial tissue and the blood pool by opacifying the LV cavity with contrast agents, which consist of gas-filled microbubbles surrounded by a shell (see Chapter 2 ). Commercially available contrast agents for use are Optison, Definity, and Sonovue. These are referred to as the second-generation contrast agents and allow accurate assessment of regional and global LV function ( Figure 10.10 ). Contrast enhancement is also recommended in patients requiring confirmation or exclusion of LV structural abnormalities and intracardiac masses and for the assessment of myocardial perfusion (discussed in detail in Chapter 2 ) and detection of microvascular obstruction in AMI. Myocardial deformation imaging (MDI) using either tissue Doppler-based or 2-dimensional speckle tracking-based methods ( Figure 10.11 ) (see Chapter 2 ) allows computation of regional and global myocardial strain and strain rate, parameters of regional and global of contractile function, which are believed to have higher reproducibility than 2D-LVEF. 3D echocardiography offers advantages in the assessment of LV volumes and LVEF ( Figure 10.12 ). Unlike 2DE, it eliminates the need for geometric modeling, which is inaccurate in the presence of aneurysms, asymmetrical LVs, and WMA, which commonly occur in patients with AMI. Several studies comparing real-time 3-dimensional echocardiography with widely accepted reference techniques such as radionuclide ventriculography and CMR have demonstrated higher levels of agreement and reproducibility in comparison to 2DE [ ]. Recently, RT3DE with contrast enhancement was found to be comparable to CMR for accuracy and reproducibility of LV volumes and LVEF and superior to unenhanced images [ ].
10.2.3
Role of echocardiography in AMI
10.2.3.1
Detection of AMI and ACSs in the emergency department
In patients presenting to the emergency department (ED) with possible MI, both the assessment of global [ ] and regional WMA [ ] enhance risk stratification and may facilitate rapid decision making. Diagnostic uncertainty remains even if resting LV function is normal when patients present several hours after chest pain with non-diagnostic ECG, negative troponins, and an intermediate clinical risk score (TIMI score). In this population, stress echocardiography may be potentially useful in risk stratification and rapid discharge of patients with a normal stress echocardiogram. In 839 such patients, stress echocardiography performed within 24 h of admission was able to risk stratify patients during follow-up. In the first year, the event rate was 0.5% and 6.6% in the normal and abnormal stress echocardiography groups, respectively. Over 70% of patients could be discharged within 24 h with a normal stress echocardiogram [ ].
Contrast defects by MCE allow the identification of AAR during arterial occlusion [ ]. Recent work demonstrated the prognostic value of MCE in patients presenting to the ED with chest pain syndromes and non-diagnostic ECGs.
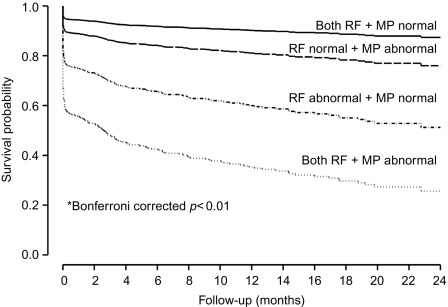
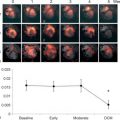
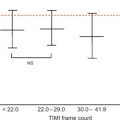
In a large single-center study in over 1000 patients in with chest pain and non-diagnostic ECG [ ], adding regional function assessment by MCE increased the prognostic information of the clinical and ECG variables significantly for predicting early events occurring within 48 h. When myocardial perfusion assessment was added, additional information was obtained. Also, when patients without early events were followed up for a median of 7.7 months, those with normal perfusion and function had excellent prognosis, whereas those in whom both were abnormal had the worst outcome. Intermediate outcome was noted in those with normal perfusion despite abnormal function ( Figure 10.13 ). In another study in 532 patients presenting to the ED, regional function on MCE provided incremental information over modified TIMI scores for predicting intermediate (< 30 days) and late (> 30 days) events. In patients with abnormal regional function, myocardial perfusion further classified those into intermediate- and high-risk groups. The full TIMI score (after troponin levels became available) could not improve on these results at any follow-up time point [ ].
10.2.3.2
Assessment of microvascular obstruction and reperfusion in patients with established AMI
No reflow as assessed by MCE has been found to be an important predictor of LV remodeling, LV dysfunction, and adverse cardiac events in patients with established STMI. Initially, this was demonstrated using intracoronary MCE, where such imaging is performed within the first hour following PPCI. In a study of 199 patients, MCE was performed on average 15 min following PPCI. No reflow occurred in 40% of patients, and this population had higher CK levels than those without MCE no-reflow [ ]. Also in patients with anterior MI, where no-reflow phenomenon identified by this technique was associated with higher incidence of pericardial effusion, early and late HF and increase in LV end diastolic volume during the convalescent period [ ]. Subsequently, these results were also reproduced for intravenous MCE with second- or third-generation contrast agents. In a small number of patients, MCE performed within 24 h of AMI treated by primary PCI (PPCI) was the best predictor of LV remodeling at 1 month over clinical and angiographic parameters, with a sensitivity and specificity of 88% and 74%, respectively [ ]. More recently, a larger multicenter study has produced similar results [ ]. The optimal timing to assess no-reflow by intravenous MCE is at 48 h. Here, the coronary hyperemia has settled and the dynamic character of the microcirculation has abated. One study examined patients at 24 h and 3–5 days after PCI following AMI. Intravenous MCE performed at 3–5 days correlated more strongly with contractile reserve than MCE at 24 h [ ].
10.2.3.3
Risk stratification after MI
Prognosis after AMI depends on residual LV dysfunction, extent and degree of residual myocardial viability, and ischemia (at the site of MI or remote territory).
LV function
As for other techniques, LV function assessed by echocardiography strongly predicts outcome following AMI [ ]. Several studies have shown that contrast-enhanced determination of LV volumes and function are more accurate and reproducible than non-enhanced echocardiography using CMR as the gold standard [ , ]. In a post-AMI study by Lim, LVEF determined by contrast-enhanced echocardiography with low-power real-time imaging was found to be more accurate compared with unenhanced echocardiography [ ]. The importance of accurate assessment of LVEF is not only for risk stratification, but also accurate delivery of life-saving, invasive treatments.
Assessment of viability and ischaemia
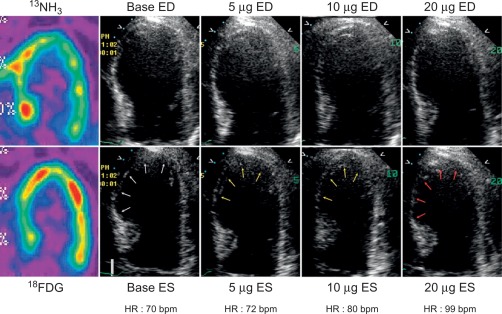
In patients with AMI, DSE allows for detection of myocardial ischemia and viability in regions with abnormal resting function (see Chapter 11 ) by four different responses. (1) biphasic response—an increase in contractile function and wall thickening at low dose, with deterioration of systolic function with higher dose ( Figure 10.14 ), indicating both viability and ischemia; (2) uniphasic—an improvement in function at low dose that persists or further improves into high dose, indicating myocardial viability; (3) worsening of resting wall function, indicating ischemia; or (4) no change in function, indicating scar. The biphasic response has the higher predictive value (72%) for improvement of regional recovery [ ] than uniphasic response, since this latter pattern can be present not only in jeopardized myocardium, but also in subendocardial scar or remodeled myocardium with no flow-limiting stenosis. Although the interpretation of wall motion is subjective, and there is significant intra- and interobserver variability with DSE, in the clinical setting, the diagnostic accuracy of DSE is good with 85% sensitivity and 79% specificity for the identification of regional functional recovery [ ] after AMI.
Adding tissue Doppler deformation measurements with DSE was shown to provide additional benefit over wall motion in predicting functional recovery [ ]. Hanekom showed that the addition of strain rate imaging enhanced the sensitivity of dobutamine echocardiography (82% vs. 73%) for assessing myocardial viability, without affecting the specificity [ ]. Few studies have examined the role of speckle tracking during stress testing.
Deformation imaging has also been shown to predict myocardial viability at rest. Zhang performed tissue Doppler strain rate measurements and contrast-enhanced CMR to assess the extent and transmurality of scar in the immediate post MI period. Peak myocardial deformation by SRI was able differentiate transmural from non-transmural MI, and thereby the extent of non-viable myocardium [ ]. In 147 AMI patients, global longitudinal strain was able to predict viability and LV recovery with sensitivity 86% and specificity 74% [ ].
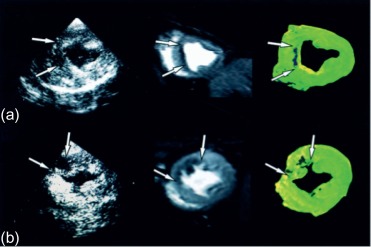
The assessment of viability assumes that viable myocardium requires a preserved micro-vasculature. This can be accurately assessed by MCE, with its excellent spatial resolution ( Figure 10.15 ). The absence of myocardial contrast enhancement on MCE should indicate areas that lack viability, and tissue necrosis. This was verified in 20 patients with ischemic cardiomyopathy undergoing CABG, in which MCE was performed within 24 h of surgery. Myocardial signal intensity (an index of myocardial blood volume) closely correlated with microvascular density and capillary area on pre-procedural MCE. An inverse correlation was demonstrated between the degree of myocardial fibrosis, and myocardial intensity [ ]. The role of MCE in predicting regional and global wall motion recovery after AMI is well documented. In 96 AMI patients with a patent infarct related artery, failure of myocardial replenishment within 10 cardiac cycles during high-power imaging resulted in lack of recovery of function in 84% of the time [ ]. Similarly in patients with recent AMI and occluded infarct-related artery (IRA), MCE accurately evaluates collateral blood flow and contractile reserve [ ]. In a study by Janardhanan, 50 patients underwent low power continuous MCE 7–10 days after AMI. Myocardial segments that did not replenish within 10–15 cardiac cycles following microbubble destruction showed significantly less contractile reserve after revascularization compared with those segments that replenished. Contrast intensity measured in this way had a predictive value of 90% for the presence of contractile reserve. The absence of contrast enhancement predicted the absence of contractile reserve in 90% of cases ( Figure 10.6 ) [ ].
There is excellent agreement between MCE and DSE in predicting LV functional recovery [ ]. Senior et al. assessed the incremental value of MCE in addition to low-dose dobutamine for the assessment of viability post MI [ ]. The presence of contrast enhancement in segments with no contractile response resulted in improvement in function compared with segments with no contrast enhancement. MCE thus predicted viability in this group of patients with no contractile response to dobutamine. Perfusion abnormalities appear earlier in the ischemic cascade, followed by wall motion abnormality during stress testing, making perfusion more sensitive.
Although LVEF is a powerful predictor of outcome, the extent and intensity of the perfusion defect is a superior predictor of recovery of LV function. This underscores the fact that perfusion, not wall motion abnormality, accurately differentiates stunned from necrotic myocardium. MCE performed 7–10 days post MI predicts the transmural extent of AMI as assessed by CMR [ ], and predicts cardiovascular outcomes immediately following AMI [ ]. 99 patients post thrombolysis underwent MCE at 7 ± 2 days and were followed up for 46 ± 16 months. The extent of residual myocardial viability was an independent predictor of cardiac death and cardiac death or AMI. A Contrast Defect Index of < 1.86 and < 1.67 predicted survival and survival or absence of re- current AMI in 99% and 95% of the patients, respectively [ ].
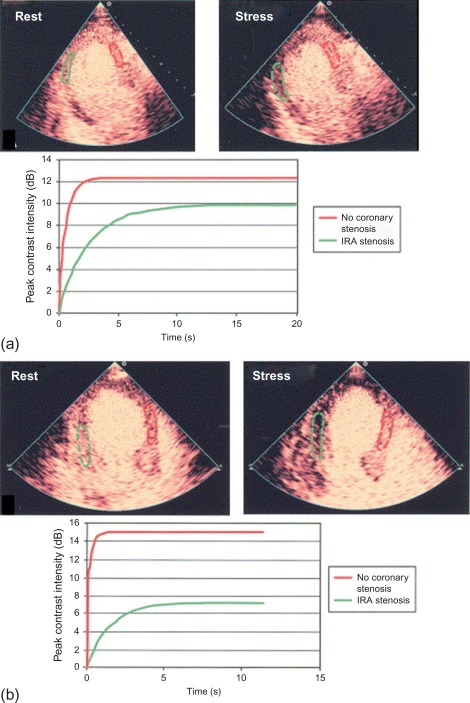
The accuracy of vasodilator MCE for detecting flow-limiting coronary artery stenosis in suspected coronary artery has been confirmed in several studies. A 73-patient study demonstrated the ability of Dipyridamole MCE to detect residual IRA stenosis and presence of remote flow-limiting CAD in patients with recent STEMI and thrombolysis ( Figure 10.16 ). Sensitivities for the detection of > 50% IRA stenosis and MVD were 88% and 72%, respectively [ ].
10.3
Nuclear imaging
10.3.1
Introduction
Nuclear imaging allows the assessment of the major predictors of subsequent patient outcome after AMI, including MI size, LVEF, LV volumes, and the presence and extent of residual myocardial ischemia [ ] and therefore also plays an important role in the initial evaluation and risk stratification of patients surviving AMI, as well as in guiding and monitoring subsequent patient management.
10.3.2
Principles of AMI imaging by nuclear imaging
Nuclear cardiac imaging can detect MI by demonstrating fixed perfusion defects present both at stress and rest myocardial perfusion imaging (MPI) ( Figure 10.17 ). It also allows measurement of myocardial ejection fraction on gated MPI ( Figure 10.17 ) or radionuclide angiography. Myocardial damage can also be directly detected with infarct avid tracers. Finally abnormalities of cardiac sympathetic innervation in infarcted areas can be detected by 123 I-metaiodobenzylguanidine ( 123 I-mIBG) scintigraphy.

10.3.2.1
Myocardial perfusion imaging
As discussed in Chapter 3 , MPI with gated single-photon emission tomography (SPECT) evaluates relative myocardial blood volume at rest and stress. Resting MPI defect size has shown to accurately assess MI size. Animal studies with 99m Tc-sestamibi and 99m Tc-tetrofosmin demonstrate close correlation between their respective initial myocardial uptake and occluded flows by microspheres, and the gradient in count activity between normally perfused and infarcted zones remains relatively constant over time [ ]. Therefore, quantitative assessment of the total LV perfusion defect size, the extent of inducible ischemia, and the degree of LV dysfunction is possible with a single imaging technique.
MI size has been quantitated on MPI using a standardized approach [ ] based on cardiac phantom studies [ ]. The feasibility of performing multicentre trials using MPI in patients with AMI was demonstrated in a cardiac phantom experiment, which showed that the measured MI size closely correlated with the actual phantom defect size with an average absolute error of < 3% of the LV [ ]. The quantitation was not subject to differences in camera, collimator, or imaging routine [ ]. In one large trial, 98% of 1184 studies provided analyzable end point data [ ].
In addition, a close association between MI size measured by MPI and various parameters related with MI size used clinically has been published, including LVEF, LV end-systolic volume, LV regional wall motion, and enzyme release [ ].
A close association between fibrosis in human hearts and MI size assessed by MPI has been described. The defect of tracer uptake measured by ex vivo MPI of myocardial slices from explanted human hearts showed a close association with the quantitation of fibrosis by pathology in a cardiac transplantation study [ ]. Likewise, a good correlation between in vivo MPI defect size and the amount of fibrosis has been found on myocardial biopsies [ ].
Although measurements of global and regional LV function are often used clinically in the estimation of MI size, these measurements are less direct and are influenced by the presence of arrhythmias, cardiomyopathies, valvular heart disease, and ventricular loading.
10.3.2.2
Infarct avid tracers
MI avid imaging evolved from 99m Tc-pyrophosphate to 111 In-labeled monoclonal antimyosin antibodies and, more recently, 99m Tc-glucarate [ ].
99m Tc-pyrophosphate is a polyphosphate derivative, first introduced for bone scanning, which bounds to the necrotic myocardium in relation to the presence of residual MBF or the redevelopment of MBF to the infarcted region, predominantly targeting the sequestered calcium phosphate deposited in the mitochondria of the infarcted or severely injured myocardium [ ]. The process thus occurs within a few hours of the acute event if the infarct-related artery is patent, or later (≥ 12 h) if the vessel remains occluded. Maximum infarct uptake occurs 24–72 h later, and usually lasts for 6–10 days [ ].
111 In-labeled murine monoclonal antimyosin Fab antibody fragments (R11D10-Fab) target specifically and with high affinity the intracellular heavy chain of cardiac myosin exposed to extracellular fluid by loss of cell membrane integrity [ ] ( Figure 10.18 ).

The sensitivity and specificity of both tracers for AMI detection vary depending on MI size and the timing of imaging, but in the appropriate setting have generally provided similar sensitivity results (87–98% for Q wave MI, and 78–84% for non-Q wave MI) [ ], with 111 In-antimyosin being more specific (85–96%) [ , ]. In contrast to 99m Tc-pyrophosphate, 111 In-antimyosin uptake is maximum in areas with severe flow impairment [ ]. This difference may be explained considering that antimyosin antibodies remain in the plasma much longer time than pyrophosphate does, which is rapidly cleared from the blood due to bone uptake and renal clearance, thus antimyosin would have a greater opportunity to interact with necrotic tissue. However 111 In-antimyosin uptake is more intense in MI with reperfusion than in those MI with persistent coronary occlusion. The time interval between 111 In-antimyosin administration and effective visualization of the target necrotic myocardial region has been a major clinical concern because of the delayed blood-pool clearance of 111 In-antimyosin. In reperfused canine models, the experimental MI could be visualized relatively soon after the administration of 111 In-antimyosin, although visualization of nonreperfused infarcts took longer time.
The uptake of 111 In-antimyosin by infarcted myocardium may persist for as long as 9 months after the acute event [ ], although the intensity of uptake tends to decrease with time. Slow clearance of such a large and insoluble molecule as myosin by granulocytes may account for this persistent uptake. Thus, the use of 111 In-antimyosin scintigraphy to differentiate acute from old myocardial injury occurring within 1 year should be interpreted using all available clinical information.
Although these two infarct avid tracers are effective in localizing MI, they have limited clinical value due to their inability to early identify the occurrence of the acute event for an early use of interventions aimed at myocardial salvage. 99m Tc-glucarate has been reported to be useful in this setting. Glucaric acid is a six-carbon dicarboxylic acid sugar, natural endogenous end-catabolite of UDP-glucose that can be labeled with 99m Tc [ ]. 99m Tc-glucarate does not accumulate in ischemic or old necrotic tissues. The proposed mechanism of 99m Tc-glucarate localization in MI is through collateral circulation and/or diffusion across sarcolemmal breaches owing to its avidity for the positively charged histones within disintegrated nuclei and reduced subcellular organelles proteins in necrotic myocytes [ ].
99m Tc-glucarate distribution in the central necrotic zone closely parallels the distribution of 111 In-antimyosin ( Figure 10.18 ), contrarily to 99m Tc-pyrophosphate, which principally accumulates peripherally to the necrosis, where residual MBF is highest. 99m Tc-glucarate by comparison appears to have less dependence on residual MBF for tracer delivery, and a rapid uptake into either reperfused or nonreperfused necrotic myocardium, with a relative rapid blood-flow clearance, which allows imaging within 1–2 h of injection [ ]. However, since 99m Tc-glucarate predominantly targets the positively charged histones, which disintegrate fairly rapidly, the clinical window for 99m Tc-glucarate uptake appears to be limited to 9 h after the onset of an AMI. This time window may allow differentiation of acute from recent MI [ ]. If early 99m Tc-glucarate uptake in AMI with persistently occluded infarct related coronary artery is confirmed in clinical studies, it may help to direct the use of thrombolytic therapy in patients presenting with equivocal diagnosis, as well as to differentiate acute from old MI. Neither 99m Tc-glucarate nor 111 In-antimyosin are commercially available currently.
10.3.2.3
Innervation imaging ( 123 I-mIBG)
Imaging cardiac autonomic nervous system has shown to be of value in the assessment of patients with different cardiac disorders, especially in those with HF, where it has an independent prognostic value and provides a potential tool for improving patient management [ ].
123 I-mIBG is the most used tracer for cardiac innervation imaging. Cardiac 123 I-mIBG uptake and retention is reflected, with good reliability [ , ], by the heart to mediastinum ratio (HMR) at early (15 min) and late (4 h) planar images and the washout rate (WR) between them. The late HMR reflects the relative distribution of sympathetic nerve terminals, offering the global information about neuronal function resulting from uptake, storage and release. The WR is an index of the sympathetic tone [ ].
The sympathetic nervous tissue is more sensitive to ischemia than the myocardial tissue. 123 I-mIBG uptake is significantly reduced in areas of MI and adjacent noninfarcted regions ( Figure 10.19 ), as well as in areas with acute and chronic ischemia. Reinnervation late after MI in periinfarct regions has been demonstrated by reappearance of 123 I-mIBG uptake, which may be in part responsible for the improvement of function. It is likely that ischemia induces damage to sympathetic neurons which may take a long time to regenerate resulting in decreased 123 I-mIBG uptake [ ]. This characteristic may be important in the pathophysiology of HF and arrhythmias [ ] and offers potential for 123 I-mIBG imaging at rest for the detection of sporadic transient ischemic attacks such as those of vasospastic angina, and for the evaluation of the AAR in the subacute phase of ACSs by revealing more extensive defects than MPI at rest, as well as a marker of reversible ischemia in patients with contraindications for stress MPI.

10.3.3
Prognostic value of nuclear imaging in AMI
Scintigraphic size of MI has shown to predict subsequent survival following the acute event. MI size as determined by resting MPI is frequently used as a surrogate marker for mortality in clinical trials assessing therapies during acute MI [ ].
In addition, LVEF and LV volumes can be accurately measured with gated SPECT MPI [ ], which is important since LVEF is still the single best long-term predictor of mortality in survivors of AMI, irrespective of initial therapy during ST elevation MI (STEMI). It should be taken into account that if the LVEF is measured within the first 2 weeks after MI, cardiac risk could be overestimated because of the presence of myocardial stunning that may subsequently resolve over the ensuing 1–2 months. LV enlargement is also related with increased mortality in patients with AMI, particularly when coexisting with myocardial dysfunction (LVEF < 50%) [ ].
The amount of tracer uptake predicts the response of myocardium with abnormal function to subsequent revascularization in chronic CAD, and the recovery of myocardium after reperfusion therapy for AMI. The mismatch between MI size and LV function after reperfusion therapy in AMI identified myocardial stunning in both retrospective [ ] and prospective [ ] studies. MPI infarct size measured at discharge predicts short-term patient mortality in both single-center [ ] and multicenter [ ] studies. In the largest study among 1181 patients, MI size assessment by MPI at 1–2 weeks after MI was significantly associated with 6-month mortality [ ]. Furthermore, two different randomized trials have shown a corresponding improvement in clinical outcome in association with treatment that reduces MI size as determined by means of serial MPI with 99m Tc-sestamibi [ , ].
The presence and extent of residual myocardial ischemia are strong predictors of cardiac events and improve risk stratification beyond that provided by clinical variables or the extent of CAD. The assessment of total and ischaemic perfusion defects and LVEF by means of MPI allows risk stratification of individual patients and early hospital discharge [ , ]. Patients with AMI and preserved LV function and no residual ischemia are at very low risk, which is no further reduced with coronary revascularization [ ]. Likewise, PCI of an occluded infarct-related artery does not improve outcome over medical therapy in patients who have depressed LV function and minimal or no residual ischemia [ ].
Pharmacologic vasodilators such as adenosine, regadenoson, and dipyridamole can be administered safely within 1–2 days of AMI, allowing very early risk stratification based on MPI results and thereby expediting appropriate patient care [ ].
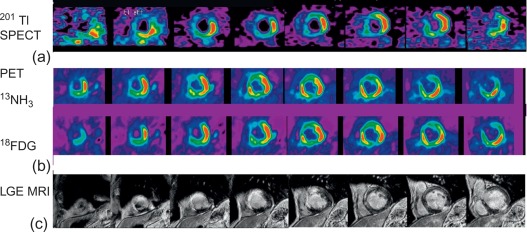
In patients with STEMI treated with primary PCI in the current era of interventional cardiology, MPI could be used to identify viable myocardium within the MI zone, to assess for ischemia outside the MI zone in those patients with multivessel CAD, and to predict recovery in LV function in those with myocardial stunning. In addition, patients not treated with primary PCI are also good candidates for noninvasive risk stratification using MPI. Regarding viability assessment, 18 F-fluorodeoxyglucose (FDG) metabolic imaging with positron emission tomography (PET) in conjunction with MBF imaging with 13 N ammonia (NH 3 ) or 82 Rb has become a recognized clinical standard [ ].
10.3.3.1
Positron emission tomography
PET offers the unique opportunity to quantitatively measure physiological parameters such as absolute MBF (using NH 3 , 15 O, water or 82 Rb), oxidative (using 11 C acetate) and glucose metabolism (using FDG) in post-infarcted myocardium, allowing better understanding of the underlying pathophysiology of infarcted, stunned, and hibernating myocardium [ ]. In clinical practice, the typical assessment of myocardial viability using PET relies rather on a semiquantitative comparison of regional myocardial perfusion by either 13 N ammonia or 82 Rb and glucose utilization using FDG in the dysfunctional myocardium relative to remote normally functioning myocardium (see Chapter 11 for a more detailed discussion of myocardial viability assessment). Different perfusion/metabolism patterns have been described in dysfunctional myocardium and related to recovery of myocardial function: Infarcted non-viable myocardium typically presents with reduced perfusion and concomitant reduced or absence of FDG uptake (the so called perfusion-metabolism match) pattern. Under fasted conditions and after glucose load, dysfunctional myocardium with preserved viability has been shown to present either both normal perfusion and FDG uptake, or a pattern of moderate reduced perfusion with increased FDG uptake (perfusion-metabolism mismatch pattern), since dysfunctional hibernated or postischemic stunned myocardium displays preferential use of glucose rather than free fatty acids as metabolic substrate. Alternative protocols to standardize myocardial glucose uptake other than oral glucose loading include the more time-consuming hyperinsulinemic euglycemic clamp or administration of nicotinic acid, which blocks lipid utilization by the heart. Several studies have examined the value of detection of viability by NH 3 -FDG PET for predicting recovery of LV function after AMI and demonstrated high accuracy of the technique [ ].
As discussed above, myocardial sympathetic innervation is an important determinant of prognosis (LV remodeling, HF, and arrhythmic events) after MI. 11 C-meta-hydroxyephedrine ( 11 C-HED) is a structural radiolabeled analog of norepinephrine and allows interrogating presynaptic catecholamine reuptake (which is reduced either with increased sympathetic drive, or with rarification of sympathetic nerve endings). The recent PAREPET study [ ] demonstrated in 204 survivors of AMI that reduced myocardial 11 C-HED uptake (meaning sympathetic denervation) was a strong and independent predictor of sudden cardiac death over a follow-up of 4.1 years. Such information may allow an improvement in risk stratification in AMI survivors and in the selection of those at higher risk for AICD implantation.
10.3.4
Future directions in nuclear imaging of AMI
The role of nuclear cardiac imaging in AMI continues to evolve. New imaging devices with higher spatial and contrast resolution are being developed [ ], with capability to detect subendocardial MI, as well as to quantify the MI size with increased confidence, which will enhance the assessment of dysfunctional myocardial states associated with depressed myocardial flow, i.e., differentiation between hibernating myocardium and nontransmural MI. Furthermore, new tracers for PET MPI are also being developed, with higher myocardial extraction than that of SPECT tracers and closer linearity with MBF [ ]. Additionally, potential advantages of PET over SPECT include higher resolution and sensitivity, as well as robust attenuation correction and absolute quantification of MBF, with higher accuracy than SPECT in the diagnosis of CAD [ ]. Furthermore, all these developments allow a shortening of the acquisition protocols and/or lowering of patient radiation exposure. The advent of hybrid SPECT/CT and PET/CT equipment offers the additional clinical advantages of evaluating coronary calcium and myocardial anatomy (including non-invasive CT angiography) together with myocardial function and myocardial perfusion in a single imaging procedure. Finally, the development of new tracers for vascular imaging of the coronary bed may also allow the identification of vulnerable plaques and better predict which patients with cardiovascular risks factors are likely to have a subsequent cardiac event.
Recently hybrid PET/CMR imaging systems are being developed. This novel assembly combines the high soft tissue contrast of CMR with the high molecular sensitivity of PET. While their advantages over conventional PET/CT scanners have not been proven systematically yet, for cardiac imaging PET/CMR may offer some interesting avenues: The high soft tissue contrast of CMR allows for differentiation of myocardial integrity and cine imaging allows for accurate assessment of myocardial wall motion. Late gadolinium enhancement is useful in distinguishing infarcted from viable myocardium. In combination with FDG and NH 3 PET, integrated PET/CMR may offer interesting possibilities to distinguish infarcted or necrotic from viable underperfused myocardium [ ].
Related posts:
Stay updated, free articles. Join our Telegram channel

Full access? Get Clinical Tree


