The term nonischemic cardiomyopathy refers to a heterogeneous group of disorders that ultimately lead to impaired cardiac performance, either from decreased function or from abnormal conduction. Although the diseases are extremely diverse, they share important characteristics: the absence of ischemic myocardial damage from atherosclerotic coronary artery disease (CAD) and the absence of other cardiac disorders such as valvular disease, systemic hypertension, or congenital heart disease that could otherwise explain the cardiac dysfunction. Classification of cardiomyopathies has frequently changed over the past several decades as understanding of these diseases has improved, thus leading to confusion among clinicians about appropriate terminology. The current classification system of the American Heart Association (AHA) categorizes cardiomyopathies as either primary or secondary based on the most up-to-date understanding of the pathogenesis. Primary cardiomyopathies are those disorders that are confined to the heart muscle and are subdivided into genetic (e.g., hypertrophic cardiomyopathy [HCM]), acquired (e.g., myocarditis), or mixed (e.g., dilated cardiomyopathy [DCM]). Secondary cardiomyopathies represent cardiac involvement from systemic diseases (e.g., sarcoidosis, amyloidosis) ( Table 31-1 ).
| Primary | Secondary | ||
|---|---|---|---|
| Genetic | Acquired | Mixed | |
| Hypertrophic cardiomyopathy | Myocarditis | Dilated cardiomyopathy | Infiltrative (amyloid) |
| ARVC/D | Stress cardiomyopathy | Restrictive | Storage (hemochromatosis) |
| Ventricular noncompaction | Peripartum | Toxicity (drugs) | |
| Glycogen storage diseases | Tachycardia-induced | Endomyocardial (Loeffler) | |
| Ion channel disorders | Infants of mothers with insulin-dependent diabetes mellitus | Inflammatory (sarcoid) | |
| Mitochondrial myopathies | Autoimmune | ||
| Conduction defects | |||
The role of the imager can be challenging when patients have potential nonischemic cardiomyopathy because these diseases often have overlapping appearances. The primary objective in many cases is to ensure that the cardiac dysfunction is not caused by CAD-related ischemia or infarction. Correlation with catheter angiography, the gold standard, is ideal; however, coronary computed tomography (CT) angiography (CTA) has been validated as an alternative noninvasive method for evaluation of the coronary arteries, especially in younger patients and those with a low pretest probability of atherosclerotic disease. Moreover, certain patterns of enhancement on delayed gadolinium–enhancement (DGE) magnetic resonance imaging (MRI), including subendocardial or transmural enhancement in a vascular distribution, are highly suggestive of ischemia, whereas other patterns of enhancement suggest nonischemic cardiomyopathy.
Although the AHA classification system of cardiomyopathies is a useful tool for clinical organization, its utility for an imager is limited because several cardiomyopathies (e.g., ion channelopathies and other conduction disorders) do not have specific imaging findings, or imaging features may be entirely normal. Characteristic imaging features of each disease are described where applicable.
Approach to Imaging Nonischemic Cardiomyopathies
Common modalities in evaluation of nonischemic cardiomyopathy are as follows:
Chest radiograph. Findings in nonischemic cardiomyopathy on chest radiographs are often nonspecific and may be normal in spite of severe disease (e.g., HCM, infiltrative cardiomyopathies), or radiographs may show findings of congestive heart failure (e.g., DCM, myocarditis). Associated findings in the lungs (e.g., sarcoid) may be the best clue to the cause of underlying cardiomyopathy.
Echocardiography. This technique is typically the initial noninvasive test of choice in patients with nonischemic cardiomyopathy. Echocardiography is excellent at providing functional assessment of the heart including chamber size, wall thickness, ejection fraction, valvular dysfunction, pressure estimations, and wall motion abnormalities. Echocardiography is limited in patients with poor acoustic windows (e.g., obese patients), and visualization of the right ventricle (RV) or apex can sometimes be difficult or impossible. Furthermore, tissue characterization is limited, and echocardiography cannot evaluate the coronary circulation when wall motion abnormality may be caused by ischemia or nonischemic cardiomyopathy.
MRI. Cardiac MRI is a versatile examination that provides not only provides anatomic and functional imaging similar to echocardiography but also tissue characterization and assessment of myocardial perfusion and viability. The examination should be customized based on the clinical scenario, but any basic examination for evaluation of nonischemic cardiomyopathy should include the following:
- ▪
Anatomic imaging: Black-blood imaging can be performed with either T1 or T2 weighting with blood suppression performed through a double inversion recovery pulse technique. These sequences are typically acquired in all three orthogonal planes (transaxial, sagittal, and coronal) to include the heart and great vessels.
- ▪
Functional imaging: Electrocardiogram (ECG)–gated cine imaging of the heart (images obtained throughout the cardiac cycle) is typically performed with a steady-state free precession (SSFP) sequence that takes advantage of the signal difference between flowing blood and myocardium. Stacks of cine sequences through the heart (6- to 10-mm slice thickness) in the two-chamber short-axis and four-chamber planes, with at least one image in the two-chamber long-axis plane, are usually sufficient.
- ▪
Additional sequences and techniques used in assessment of nonischemic cardiomyopathy are as follows and are covered in more detail for specific diseases:
- ▪
Delayed contrast-enhanced imaging: Assessment of myocardial scar or viability, fibrosis, or infiltration is performed with DGE imaging, which can provide crucial information that differentiates among causes of nonischemic cardiomyopathy ( Table 31-2 ). The contrast agent accumulates in regions of expanded extracellular space, either because of myocyte death and fibrosis or because of deposition of abnormal material (e.g., amyloid). The typical dose is 0.1 to 0.2 mmol/kg, and imaging is performed approximately 10 minutes after contrast administration. An inversion recovery gradient recalled echo (GRE) pulse is performed to null normal myocardial signal and increase the signal-to-noise ratio. This sequence requires acquisition of a series of scout images to determine the optimal myocardial nulling time (typically ~200 to 300 msec). Alternatively, a phase sensitive inversion recovery (PSIR) sequence can be performed that improves nulling of the normal myocardium over a wider range of inversion times. Imaging is usually performed in the two-chamber short-axis plane, but orthogonal views to confirm the presence of an abnormality and exclude artifact are often useful. At a minimum, mid–two-chamber long-axis or mid–four-chamber images should be obtained for assessment of the cardiac apex, which cannot be adequately evaluated on short-axis sequences.
Table 31-2
Patterns of Cardiac Magnetic Resonance Imaging Delayed Myocardial Enhancement
Subendocardial
Mesocardial
Subepicardial
Transmural
Infarct ∗
Hypertrophic cardiomyopathy
Myocarditis
Infarct ∗
Hypereosinophilic syndrome
Fabry disease
Sarcoid
Myocarditis
Amyloid
Dilated cardiomyopathy
Sarcoid
Cardiac transplantation
Right ventricular insertional fibrosis
Sarcoid
∗ Infarct usually confined to a coronary vascular territory.
- ▪
Long inversion time contrast-enhanced imaging for evaluation of thrombus: Intraluminal cardiac chamber filling defects are commonly encountered in the evaluation of nonischemic cardiomyopathy and usually represent clot. To confirm that a filling defect represents a thrombus (and not a mass such as a myxoma or metastasis), the inversion time can be lengthened to 600 msec; this will cause vascular tissue to appear gray and thrombus to be black.
- ▪
T2 ∗ for evaluation of iron deposition: Iron is a paramagnetic element that alters the local magnetic field and results in significant reduction in T2 ∗ for affected tissues. Myocardium with abnormally increased iron concentrations (i.e., hemochromatosis or siderotic cardiomyopathy) shows decreased signal on T2-weighted and T2 ∗ -weighted sequences, and measurement of T2 ∗ can help to quantify cardiac iron levels.
Hypertrophic Cardiomyopathy
HCM, the most common genetic cardiomyopathy, affects approximately 1 in 500 individuals. HCM is the result of hundreds of different genetic mutations that result in myocyte disarray and variable amounts of hypertrophy and scar within the myocardium. The underlying genotypic variability results in a spectrum of phenotypes that vary in imaging appearance, clinical presentation, and severity of disease.
Most cases of HCM manifest in adolescence or early adulthood, although the disease has been seen across the spectrum of age range from infants to older adults. HCM is associated with a mortality rate of approximately 0.5% to 1.0% per year. Most patients are referred for imaging because of a positive family history of HCM, unexplained sudden cardiac death (SCD), or ECG abnormalities. Most symptomatic patients present with dizziness or syncope (from left ventricular outflow obstruction or arrhythmia) or dyspnea (from diastolic dysfunction).
Normal myocardium is less than 12 mm in thickness, and the following criteria indicate HCM:
- 1.
Wall thickness greater than 15 mm
- 2.
Normal-sized ventricular chambers
- 3.
Normal afterload (i.e., absence of severe aortic stenosis or uncontrolled systemic hypertension)
The most common form of HCM involves the septum (asymmetric septal), but other variants exist, including apical, circumferential (diffuse), and midcavity.
Historically, the obstructive form of HCM received the most attention because of the well-known cases of SCD that result from lethal arrhythmia. Various names have been used as understanding of this entity has evolved, including idiopathic hypertrophic subaortic stenosis (IHSS), hypertrophic obstructive cardiomyopathy (HOCM), and muscular subaortic stenosis. These terms can be misleading because only 25% of cases cause left ventricular outflow tract (LVOT) obstruction, and many involve areas of myocardium other than the interventricular septum. HCM is now the preferred, all-inclusive term.
Because the overall size of the heart is normal in HCM, the chest radiograph is usually not helpful.
Imaging in HCM relies heavily on echocardiography and MRI for diagnosis, quantification of severity of disease, and response to therapy. Echocardiography is typically the first modality used to evaluate HCM. In the setting of the septal variant of HCM, echocardiographers frequently use the estimate of interventricular septal thickness greater than 1.5 times that of the opposed posterior wall for diagnosis. Systolic function (left ventricular ejection fraction) is normal to increased (complete obliteration of the left ventricle [LV] lumen during systole), and diastolic function may be decreased. With increasing use of MRI, however, an estimated 6% to 12% of cases of HCM go undetected on echocardiography. MRI is quickly becoming the imaging modality of choice.
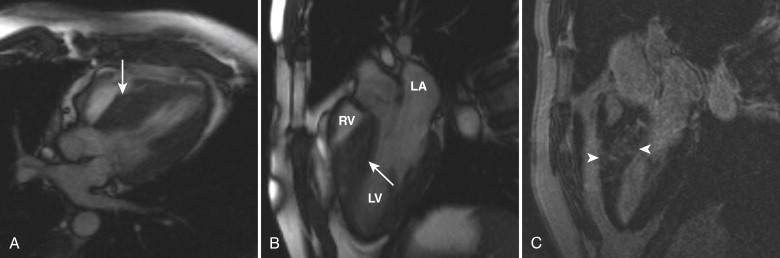
MRI for the evaluation of HCM should include a basic cardiac examination and delayed contrast-enhanced sequences. Additional sequences that may be helpful in HCM include a three-chamber cine sequence and phase contrast cine images across the LVOT. The three-chamber view offers an excellent look at the LVOT and is best for evaluating turbulent flow resulting from subaortic stenosis and systolic anterior motion of the anterior mitral valve leaflet that further exacerbates obstruction and causes mitral regurgitation ( Fig. 31-1 ). The phase contrast sequence is used to measure peak velocities across the LVOT that can be translated into a pressure gradient using the modified Bernoulli equation (mm Hg = square of peak velocity in meter/second multiplied by 4).
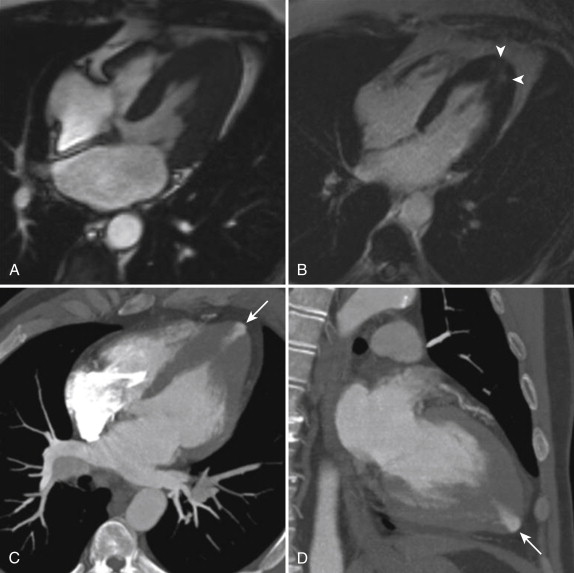
Cine images show a normal to increased LV ejection fraction, and obliteration of the LV cavity may be observed during systole. Measurement of wall thickness and myocardial mass should be performed at end-diastole. MRI offers precise delineation of hypertrophied segments of myocardium, is highly accurate and reproducible, and offers a better evaluation of the LV apex and the RV than echocardiography; these areas can be affected by variants of HCM ( Fig. 31-2 ). As previously mentioned, normal myocardium is less than 12 mm thick in end-diastole, and segments affected with HCM are usually at least 15 mm thick. Patients with wall thickness greater than 30 mm are at increased risk of SCD.
Abnormal delayed contrast enhancement is seen in up to 50% of cases of HCM. The hyperenhancement is typically patchy and usually mesocardial (midmyocardial); these findings help differentiate HCM from ischemic infarcts, which always are subendocardial with variable degree of transmurality. These areas of delayed hyperenhancement represent foci of fibrosis within the hypertrophic myocardium. Multiple studies have shown that more extensive areas of enhancement correlate with poorer prognosis because the areas of fibrosis serve as arrhythmogenic foci.
At institutions where alcohol ablation of the septum is performed, MRI may be used as a follow-up imaging modality to assess response to treatment (i.e., decrease in septal thickness and improved LVOT flow). Other MRI applications including myocardial tissue tagging and myocardial perfusion imaging are being investigated but are not currently used in routine clinical practice.
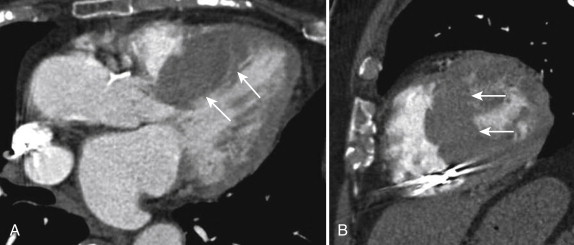
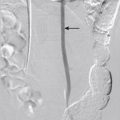
CT is not typically performed in the workup of HCM; however, because of the use of CT as a first-line imaging modality (particularly in emergency departments), cases may be incidentally detected by the imager ( Fig. 31-3 ). The diagnosis is difficult on nongated CT examinations because motion artifact may simulate increased wall thickness, and the imager may be unaware of underlying systemic hypertension or other mimics of HCM. Cardiac-gated CT may be indicated in patients with inconclusive echocardiographic evaluations and contraindications to MRI. Care should be taken to include functional data at end-diastole for wall thickness measurements. Delayed enhanced CT may detect areas of abnormal late enhancement, but the contrast-to-noise ratios are much inferior to those of MRI, and therefore the use of this technique is usually not recommended.
Arrhythmogenic Right Ventricular Cardiomyopathy/ Dysplasia
Arrhythmogenic right ventricular cardiomyopathy/dysplasia (ARVC/D) is a primary genetic form of cardiomyopathy that, despite a low incidence of 1 in 5000 to 1 in 10,000 in the United States, accounts for 5% of cases of SCD in persons less than 35 years old. Because of this risk despite its relatively low incidence, ARVC/D is a common referral for cardiac MRI, either as part of an arrhythmia workup or for evaluation of patients with a positive family history.
ARVC/D is an autosomal dominant type of cardiomyopathy that results from one of several genetic mutations in the cardiac desmosome (responsible for cellular binding) and pathologically results in progressive fibrofatty infiltration of the myocardium. The disease almost always involves the RV and may progress to biventricular involvement. The earliest stages of the disease may not manifest on a macroscopic level, and imaging findings may be normal (although patients are still at risk for SCD). As the disease progresses, abnormalities in RV structure and function become visible on imaging, including fat infiltrating the myocardium of the RV free wall (seen on MRI), as well as chamber enlargement, decreased RV function, dyskinesis, and focal aneurysmal outpouchings (seen on MRI or echocardiography). End-stage ARVC/D may result in heart failure and a DCM pattern on imaging.
Diagnostic criteria for ARVC/D were established by the Arrhythmogenic Right Ventricular Dysplasia Task Force in 1994 and include major and minor criteria for structural, histologic, ECG, arrhythmic, and genetic features. Because of the high interobserver variability of the original imaging criteria for assessment of RV function and structural changes, revised criteria were proposed in 2010 to increase the sensitivity for the diagnosis of ARVC/D while maintaining specificity. These newer criteria include specific imaging criteria for two-dimensional echocardiography, MRI, and angiography ( Table 31-3 ). Even though fat infiltration of the myocardium is a pathologic hallmark of ARVC/D, the presence of fat on imaging is not included in either set of criteria.
| Major Criteria |
|---|
| Two-Dimensional Echocardiography |
Regional RV akinesia, dyskinesia, or aneurysm and one of the following:
|
| Cardiac MRI |
Regional RV akinesia or dyskinesia, or dyssynchronous RV contraction and one of the following:
|
| Minor Criteria |
|---|
| Two-Dimensional Echocardiography |
Regional RV akinesia or dyskinesia and one of the following:
|
| Cardiac MRI |
Regional RV akinesia or dyskinesia or dyssynchronous RV contraction and one of the following:
|
Echocardiography is often the initial imaging test of choice in suspected cases of ARVC/D. Structurally, right ventricular outflow tract (RVOT) dilation is the most common abnormality in patients who satisfy the Task Force Criteria, with an RVOT long axis greater than 30 mm in 89% of cases. Other structural abnormalities seen on echocardiography include trabecular derangement and a hyperreflective moderator band, present in 54% and 34% of cases, respectively. Functionally, regional wall motion abnormalities are present in 79% of cases, with the apex and anterior wall the most commonly affected (72% and 70%, respectively).
MRI has several advantages over echocardiography in the evaluation of ARVC/D, including better visualization of the RV, more accurate volume measurements, and the ability to characterize tissue composition (i.e., muscle versus fat). MRI examination for evaluation of ARVC/D should include a modified basic examination with breath-hold, high-resolution black-blood sequences through the RV free wall for evaluation of the presence of fat.
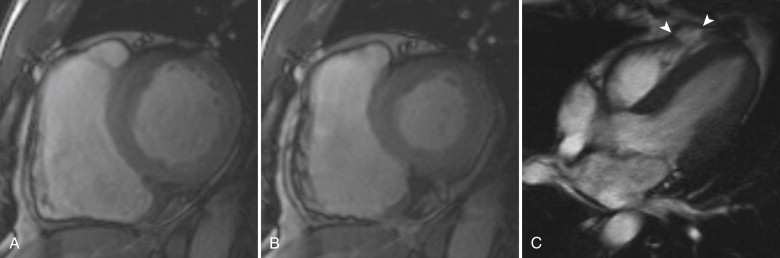
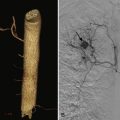
RV enlargement (defined as an RV larger than the LV at end-diastole on four-chamber cine views) was the most specific finding in a study of 40 patients imaged for suspected ARVC/D, with a specificity of 96% and a sensitivity of 68%. Enlargement of the RVOT (defined as larger than the LVOT) has 94% specificity and 78% sensitivity. Fat infiltration of the RV is the most sensitive finding (84%), but it is less specific (79%) and can easily be confused with epicardial or pericardial fat. Quantitative measurement of RV end-diastolic volume and RV ejection fraction were incorporated into the 2010 Task Force Criteria modifications ( Fig. 31-4 ).
Delayed contrast-enhanced imaging can also be performed to look for areas of fibrous infiltration. Enhancement is seen in up to 70% of patients, but it is not a component of the Task Force Criteria.
Related posts:
Stay updated, free articles. Join our Telegram channel

Full access? Get Clinical Tree


