The detection of residual myocardial viability in a patient with regional or global severe left ventricular (LV) dysfunction is of clinical importance to plan the therapeutic strategy because revascularization of dysfunctional but viable myocardium may improve LV function. Several imaging techniques have been shown to be successful in detecting myocardial viability; these include LV angiography using appropriate interventions, perfusion scintigraphy, positron emission tomography (PET), and echocardiography. More recently, cardiovascular magnetic resonance (CMR) has gained widespread acceptance as a technique to identify viable myocardium and distinguish it from myocardial necrosis and scar. This chapter reviews the current knowledge of how these techniques can be used in humans to guide clinical decision making and predict recovery of function after revascularization of dysfunctional myocardium.
All scientific papers on the value of imaging techniques for detecting myocardial viability use the well-known statistical terms of sensitivity, specificity, and the predictive values. The sensitivity of a test is commonly defined as the number of true positives divided by the sum of true positives and false negatives. In other words, the sensitivity of a test is the number of diseased persons with a positive test divided by the total number of diseased persons. Common sense might suggest that scar tissue and, hence, absence of viability might indicate the presence of disease. The total number of diseased people or segments would thus be the number of people with scar or segments without recovery of function. The presence of viability would be synonymous with a healthy state (relatively speaking), and the total number of viable, healthy people or segments would appear as the denominator in the formula for calculating specificity. In the viability literature, however, sensitivity indicates the ability of a test to identify viable myocardium, and specificity is an indicator of how well the test performs when it comes to detecting scar. Positive and negative predictive values are used accordingly. This needs to be borne in mind when it comes to the interpretation of test results reported later in this chapter.
Features of Viable Myocardium Detectable by Cardiovascular Magnetic Resonance
Scar Formation and Left Ventricular Wall Thickness
Myocardium is commonly defined as viable if it shows severe dysfunction at baseline but recovers function with time either spontaneously (myocardial stunning) or following revascularization (hibernating myocardium). Clinically, stunned myocardium may be found in patients with early reperfusion of an infarct-related artery. If there is no residual high-grade stenosis, blood flow at rest will be normal and the myocardium will recover spontaneously after a few days. Patients with hibernating myocardium often present with severe triple vessel disease, globally depressed LV function, and prominent dyspnea but often surprisingly little angina. This type of dysfunction is often more chronic, and previous myocardial infarction may or may not be reported in the history. Pathology may reveal regions of transmural scar, regions with predominantly subendocardial scar, and regions with mixtures of scar and viable myocardium.
Severe wall thinning is the hallmark of transmural chronic myocardial infarction. However, wall thinning is the end result of infarct healing, and it may take up to 4 months before the remodeling process is completed. In contrast to the severe thinning of chronic transmural scar, the best example for which is the thin-walled anterior LV aneurysm, acute and subacute transmural infarcts may not yet have reached the stage of thinning because local infarct remodeling is incomplete. In contrast with transmural myocardial infarction, which may or may not appear thinned, depending on infarct age, healed nontransmural infarcts usually do not develop severe thinning. Some thinning may be observed, however, depending on the degree to which the endocardially located infarct extends throughout the wall. Therefore the finding of preserved myocardial wall thickness in diastole in a patient with a known chronic infarct that is more than 4 months old will likely represent nontransmural infarction with a substantial rim of viable myocardium surrounding the endocardial scar. If the infarct is more recent than approximately 4 months, preserved end-diastolic wall thickness cannot be used to distinguish between viable and nonviable myocardium.
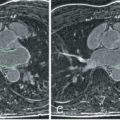
Patients with small subendocardial infarcts may, however, also present with regional wall thinning despite the presence of substantial amounts (>50% of wall thickness) of viable myocardium. In a case described by Kim and Shah, diastolic thickness of the anterior wall on a long-axis late gadolinium enhancement (LGE) CMR image measured only 5 mm. However, the subendocardial rim of scar was only 1.5 mm of total wall thickness, indicating the presence of substantial amounts of viable myocardium. Indeed, recovery of the myocardium occurred following revascularization. Shah et al. systematically looked at more than 1000 consecutive patients who had LGE CMR for viability assessment and found that 19% of them had regional wall thinning. Within these regions, the extent of scarring was 72%. However, 18% of thinned regions had only limited scar burden (≤50% of total extent). Among patients with thinning undergoing revascularization and follow-up cine CMR ( n = 42), scar extent within the thinned region was inversely related to regional and global contractile improvement. End-diastolic wall thickness in thinned regions with limited scar burden increased from 4.4 mm to 7.5 mm after revascularization ( P < .001) with resolution of wall thinning ( Fig. 21.1 ). Thus regional wall thinning may be possible in myocardium that has only little subendocardial scarring probably because of ventricular remodeling, and full recovery of function may occur following revascularization. The ratio of viable to total myocardium (viable plus nonviable) irrespective of wall thickness in the dysfunctional region may therefore be more accurate than end-diastolic wall thickness in predicting functional improvement.

Contractile Reserve of Viable Myocardium
A well-known feature of viable myocardium is augmented contractility in response to a suitable stimulus. Such stimuli include sympathomimetic agents or postextrasystolic potentiation. In contrast, necrotic or scarred tissue will not respond to such stimulation. Today, the most widely used mode of stimulation is to infuse low doses of dobutamine up to 10 µg/kg/min. If a contractile reserve can be elicited, the responsive myocardium will usually recover function after appropriate revascularization. However, it appears that there is also some spontaneous improvement in the response to dobutamine over the course of infarct healing after reperfused myocardial infarction, which may affect the accuracy of this viability marker after myocardial infarction.
Noninvasive Observation of Tissue Edema
Irreversible myocardial damage occurs after approximately 30 to 120 minutes of ischemia. Very early changes can be observed by electron microscopy; these changes include intracellular edema and swelling of the entire cell, including the mitochondria. The sarcolemma ruptures, and there is free exchange between the extracellular and intracellular compartments. In some infarcts, light microscopy reveals changes just a few hours after the onset of ischemia; these changes are most pronounced at the periphery of the infarct. After 8 hours, there is edema of the interstitium, and infiltration of the infarct zone by neutrophils and red blood cells becomes evident. Small blood vessels undergo necrosis, and karyolysis of muscle cell nuclei can be observed. Plugging of capillaries by erythrocytes is most pronounced in the center of the infarct. If reperfusion can be achieved at an early stage, the resulting infarcts contain a mixture of necrosis and hemorrhage within zones of irreversibly injured myocytes.
Myocardial edema is associated with prolonged magnetic resonance (MR) relaxation times, and this leads to characteristically increased signal intensity on MR images, which are sensitive to such changes. By using modern T2-weighted pulse sequences, the edema associated with acute infarcts can be depicted, and this can be used to differentiate between acute and chronic infarcts.
No-Reflow Phenomenon and Early Hypoenhancement With Gadolinium
A feature of the central necrotic region within a myocardial infarct is intracapillary red blood cell stasis. Plugging of the capillaries leads to tissue hypoperfusion. This hypoperfusion is primarily related to the resulting reduced functional capillary density rather than reduced microvascular flow rates. This decrease in functional capillary density results in a prolonged washin time constant. This lack of reperfusion despite restoration of flow in the epicardial vessel is known as the no-reflow phenomenon . When the myocardium is imaged by CMR early after injection with gadolinium (early gadolinium enhancement), no-reflow zones appear dark in comparison with the surrounding rim regions of the infarct.
Late Gadolinium Enhancement in Infarcted Tissue
Gadolinium chelates are commonly used as CMR contrast agents. These metabolically inert molecules are distributed extracellularly, and they shorten both T1 and T2 relaxation times. Rupture of myocyte membranes leads to an increased volume of distribution of CMR contrast agents with a corresponding increase in the effective voxel concentration of such agents. Thus a higher concentration of gadolinium contrast agents leads to a more pronounced shortening of relaxation times. CMR images are usually T1 weighted (because the RR interval is approximately 800 ms, which corresponds to the T1 value of myocardium), and this will result in a higher signal intensity of infarcted as compared with normal tissue once the contrast material has fully penetrated the infarct region. The time–concentration curve of MR contrast agents in infarct tissue does not correspond to that in blood or normal tissue kinetics. Thus, while early hypoenhancement of infarcted regions after injection of contrast material is caused by delayed contrast penetration, late enhancement in infarction is due to both increased volume of distribution and slow contrast washout. The enhancement pattern that is seen will depend on regional differences in tissue washin/washout kinetics, as well as the time after injection of contrast when the image is acquired. LGE has now been extensively validated in animal and human studies, and with improved imaging sequences (notably the use of inversion recovery to null signal from normal myocardium), the signal-to-noise ratio of enhanced to unenhanced tissue is dramatically higher than with previous sequences, at approximately 500%. This has led to greatly improved image quality and a substantial increase in use of the technique. In animal experiments, the area of LGE has been shown to correlate closely with areas of infarction, and for the first time in vivo, high-quality imaging of the distribution of scar is possible.
High-Energy Phosphates and Viability
The primary energy reserve in living myocardial cells is stored in the form of creatine phosphate and adenosine triphosphate (ATP). Depletion of total myocardial creatine, creatine phosphate, and ATP follows severe ischemic injury, as shown in biopsy samples obtained from patients during cardiac surgery or necropsy. Using P magnetic resonance spectroscopy (MRS), it is possible to measure the myocardial content of phosphocreatine and ATP. 1 H-MRS has a higher sensitivity than 31 P-MRS and has the ability to detect the total pool of phosphorylated plus unphosphorylated creatine in skeletal and cardiac muscle. MRS is currently not used clinically and is not discussed further in this chapter.
Cardiovascular Magnetic Resonance to Detect Viable Myocardium in Acute Myocardial Infarction
Signal Intensity Changes on T2-Weighted Images
Myocardial edema accompanies acute myocardial necrosis. On T2-weighted spin echo images, the increased water content leads to an increase in signal intensity. T2-weighted spin echo images acquired early after myocardial infarction (within 10 days) demonstrate that the infarct site is a region of high signal intensity in comparison with normal myocardium. The advent of modern rapid pulse sequences, which produce a higher contrast between edematous and normal myocardium, has led to some revival of T2-weighted CMR.
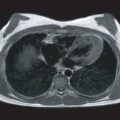
However, it is important to keep in mind that there are several potential pitfalls to the acquisition and interpretation of T2-weighted images, including the necessity to differentiate the signal from slowly flowing blood in the ventricle from increased signal intensity from a region of infarction and to recognize artifactual variation of signal intensity in the myocardium because of respiratory motion or residual cardiac motion. Thus careful optimization of all imaging parameters is required for achieving interpretable results during T2-weighted image acquisition ( Fig. 21.2 ).

Late Enhancement With Gadolinium in Acute Infarction
In the mid and late 1990s, Kim and Judd developed late enhancement imaging. Within a short time, LGE CMR became widely used because of its high image quality, simplicity, and high resolution allowing clear demarcation of the transmural extent of necrosis and scar. The T1-weighted segmented inversion recovery pulse sequence that is employed in most centers acquires images in mid diastole when cardiac motion is minimal ( Fig. 21.3 ). Segmentation of k -space makes it possible to acquire images during a breath-hold, which reduces motion artifacts as compared with the older T1-weighted techniques. With the appropriate choice of the inversion time and imaging 10 to 20 minutes after the intravenous application of contrast material, the signal intensity of normal myocardium is nulled but the infarcted tissue becomes very bright ( Fig. 21.4 ). Kim and colleagues clearly demonstrated that this technique provides precise images of acute and subacute infarcts irrespective of transmurality and reperfusion status ( Fig. 21.5 ).


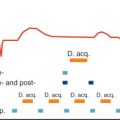
The time between contrast injection and starting the imaging process is important, as contrast concentration and hence enhancement of a region vary over time. Normal regions with normal contrast washin and washout reach a constant enhancement within 2 to 3 minutes. The border zones of an infarct, however, have longer time constants for washin and washout as compared with normal, and these time constants are even longer in the center of the infarct (see later). Consequently, both core and border zone of the infarct appear dark during the early phase of contrast washin ( Fig. 21.6 ). Later, core and normal myocardium have similar signal intensities, but the border zone begins showing some enhancement. When contrast washout begins in normal myocardium at about 10 minutes after injection, core and border zones of the infarct are enhanced, and this persists in the core of the infarct at late stages of contrast washout. At this time, the border zones have already returned to near-normal signal intensities.

There has been debate about whether LGE occurs exclusively in regions with myocardial necrosis or also in edematous viable border zones around infarcted areas. However, the observation by Saeed and colleagues that the Gd-DTPA-enhanced region overestimates true infarct size by approximately 8% was not supported by other animal studies. Fieno and colleagues compared ex vivo CMR with triphenyltetrazolium chloride–stained sections and confirmed that the spatial extent of enhancement was the same as the spatial extent of infarction at every stage of healing from day 1 to 8 weeks. The ischemic area at risk was defined by fluorescent microparticles injected into the left atrium with the infarct-related artery occluded. Enhanced regions were smaller than the ischemic area at risk at every stage of healing ( Fig. 21.7 ). Image intensities of viable myocardium within the risk region were the same as those of remote, normal myocardium. A possible explanation for the discrepant findings of Saeed and colleagues and the group of Kim and Judd is that Saeed and colleagues used a different pulse sequence than that found to be highly and reproducibly accurate for infarct sizing.

It is important to note that accurate infarct imaging requires constant adjustment of the TI if imaging cannot be completed within 5 minutes. This is necessary because the null point of normal myocardium depends on the concentration of the contrast agent at any given point in time. As contrast washout from normal myocardium occurs at a comparatively rapid pace, TI increases continuously, necessitating corresponding increases of TI to achieve perfect nulling of normal myocardium. Typical TI values range from 310 ms at 10 minutes to 385 ms at 30 minutes ( Fig. 21.8 ). With appropriate adjustment of TI, there are no differences in infarct size measurement by contrast-enhanced MR between 10 and 30 minutes after contrast injection ( Fig. 21.9 ). If TI is not adjusted, the spatial extent of enhancement decreases by up to 30% over time after contrast application.


No-Reflow by Cardiovascular Magnetic Resonance
CMR of acutely necrotic myocardium sometimes reveals a central core of low signal intensity surrounded by the typical bright infarct zone ( Fig. 21.10 ). In the center of the infarct region, myocytes and capillaries may undergo necrosis simultaneously because of profound and sustained ischemia. In that situation, capillaries become occluded by dying blood cells and debris, to the extent that even with restoration of epicardial blood flow, the infarct core will not promptly reperfuse. This area of microvascular obstruction is called the no-reflow region . Microvascular obstruction following acute infarction correlates with greater myocardial damage by echocardiography and poorer global LV function in the early postinfarction phase. The central low signal intensity region seen on CMR images within the first 2 to 3 minutes after contrast injection corresponds to experimentally produced no-reflow regions. CMR enables in vivo monitoring of the time course of microvascular obstruction. It could be shown that this zone increases 3-fold during the 48 hours after reperfusion, indicating progressive microvascular injury well beyond coronary occlusion and reflow. Moreover, the extent of microvascular obstruction is the strongest predictor of LV volume at 10 days after reperfusion. Large areas of microvascular obstruction within infarcts lead to significant reductions of radial thickening in adjacent noninfarcted regions. CMR could also prove in a dog model that intraaortic balloon counterpulsation improves myocardial perfusion at the tissue level and reduces the extent of no-reflow caused by microvascular obstruction.

CMR may also be used to study the effects of the no-reflow phenomenon in patients with acute infarcts. Wu and co-workers studied 44 patients by using perfusion CMR. Almost all of these patients had thrombolysis or direct angioplasty. To study LV remodeling, 17 patients underwent repeated CMR 6 months after the initial study. Microvascular obstruction was defined as hypoenhancement seen 1 to 2 minutes after contrast injection. Infarct size was assessed as percent LV mass enhanced 5 to 10 minutes after contrast. Patients with microvascular obstruction ( N = 11) had more cardiovascular events than did those without (45% vs. 9%, P = .02). The risk of adverse events increased with infarct extent (30%, 43%, and 71% for small [ N = 10], mid-sized [ N = 14], and large [ N = 14] infarcts, respectively; P < .05). Even after infarct size was controlled for, the presence of microvascular obstruction remained a prognostic marker for postinfarction complications ( Fig. 21.11 ). Rogers and colleagues confirmed the adverse outcome of patients with low signal intensity regions within the infarct zone after injection of gadolinium contrast. However, Gerber and associates reported that early gadolinium enhancement in the infarct area was inferior to LGE for predicting functional improvement in dysfunctional segments in patients studied 4 days after acute myocardial infarction. Receiver operating characteristic analysis showed an accuracy of 74% for the absence of late enhancement but only 49% for the absence of early hypoenhancement.

Late Gadolinium Enhancement and Recovery of Function
The transmural extent of myocardial infarction as defined by LGE CMR predicts the likelihood of improvement of contractile function. Spontaneous recovery of function can be expected after ischemic injury in a segment with a limited amount of subendocardial scar. In contrast, a segment with transmural infarction will usually not recover wall thickening. This concept was confirmed in a dog experiment of acute myocardial infarction. Segments with less than 25% of enhancement on day 3 after induction of the infarct had an 87% probability of improvement by day 28. In contrast, no segment with 100% transmurality of enhancement improved.
Choi and colleagues confirmed these experimental findings in 24 patients who presented with their first myocardial infarction and were successfully revascularized. Improvement in segmental contractile function at 2 to 3 months was inversely related to the transmural extent of infarction as demonstrated by LGE within 7 days of the acute event. Improvement in global contractile function, as assessed by ejection fraction and mean wall thickening score, was not predicted by peak creatine kinase-MB or by total infarct size, as defined by CMR. Instead, the best predictor of global improvement was the extent of dysfunctional myocardium that was not infarcted or had infarction comprising less than 25% of LV wall thickness.
Combining T2-Weighted Images and Late Enhancement Images for Evaluation of Myocardial Salvage After Early Reperfusion
Friedrich and colleagues studied patients with reperfused acute myocardial infarction using a T2-weighted breath-hold short TI inversion recovery pulse sequence and late enhancement images. In comparison with the zone of high signal intensity on late enhancement images corresponding to the area of irreversible ischemic damage, the high signal intensity zone on T2-weighted images was larger, and was speculated to correspond to the ischemic area of reversible damage (ischemic area at risk). Thus Friedrich et al., as well as other authors, concluded that the combination of these two techniques may allow for quantifying the extent of the salvaged myocardial area after early reperfusion therapy ( Fig. 21.12 ).

However, for this concept to hold true it is necessary that the entire ischemic area at risk has substantial edema and that the high signal intensity zone on T2-weighted images is related to the ischemic area at risk measured by microspheres in an animal model as the gold standard. Whalen et al. reported that there is an increase in tissue water of about 88% in myocardial regions that are completely infarcted (postmortem data). In contrast, Jennings et al. found an increase of tissue water of only 9% in reversibly injured myocardium which persisted for less than 24 hours after reperfusion.
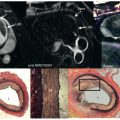
Based on the data from Whalen and Jennings, there is at least a 9-fold difference in tissue water content between reversibly and irreversibly injured myocardium, casting serious doubt that there is any pathophysiologic basis for the quantification of the area at risk, or the salvaged area using T2-weighted imaging. These doubts are supported by experimental data from the Duke group, who recently studied 21 canines and 24 patients to determine whether T2-weighted images delineate the area at risk. Matching the pathophysiology described by Whalen and Jennings, they found no relationship between the transmural extent of T2-intense regions and that of the ischemic area at risk ( P = .97) because the tissue water content of reversibly injured myocardium is only increased by 9% for less than 24 hours after the acute event. Instead, there was a strong correlation with that of infarction ( P < .0001) because tissue water content in infarcted myocardium is increased by 88%. There was a fingerprint match of T2-intense regions with the intricate contour of infarcted regions by late enhancement and pathology ( Fig. 21.13 ).

Related posts:
 Use of Navigator Echoes in Cardiovascular Magnetic Resonance and Factors Affecting Their Implementation
 Clinical Cardiovascular Magnetic Resonance Imaging Techniques
 Atherosclerotic Plaque Imaging: Coronaries
 Cardiac Iron Loading and Myocardial T2*
 Pulmonary Vein and Left Atrial Imaging
 Noncardiac Pathology
Stay updated, free articles. Join our Telegram channel

Full access? Get Clinical Tree


