Myocardial Viability
Rob S.B. Beanlands
Stephanie Thorn
Jean DaSilva
Terrence D. Ruddy
Jamshid Maddahi
Heart failure resulting from impaired left ventricular (LV) function is associated with significant morbidity and mortality. The leading cause of heart failure is coronary artery disease (CAD). Among patients with coronary disease and severe ventricular dysfunction, mortality rates range from 10% to 60% per year (1,2,3,4,5). The inverse relationship of ventricular function with mortality has been well established (3,6). Heart failure is also associated with significant health care costs. The number of hospitalizations from heart failure in North America has risen by 159% from 1990 to 2000 (7). In recent years, advances in medical therapy have improved the outcome for patients with heart failure (7,8,9,10,11,12). However, even with these advances, mortality rates remain high (9,11), with epidemiological surveys suggesting no significant change in overall death rates (7,13). With limited access to transplantation, revascularization is often considered, as this may improve the clinical outcome in some patients (3,14,15). However, bypass surgery in such patients can have high perioperative risk (16,17,18,19). Hence, a need arose for diagnostic techniques that could better define and select the high-risk patients with ventricular dysfunction most likely to benefit from revascularization. The diagnosis of the extent of viable myocardium has become pivotal in this regard. Although several approaches have been developed, the identification of preserved metabolic activity in the myocardium using fluorine-18 [18F]-fluorodeoxyglucose (FDG) positron emission tomography (PET) imaging is the most well-established approach.
Glucose Metabolism
The primary substrate for energy metabolism in the normal myocardium depends on the substrate that is most available for oxidative metabolism, for which the majority of the time is fatty acids. However, after a glucose load, there is a subsequent increase in insulin levels. This leads to an increase in glucose metabolism and inhibition of lipolysis. Thus, in the fed state, the preferred substrate for cardiac energy metabolism becomes glucose (20,21).
In ischemic myocardium, oxidative metabolism is reduced, and there is a shift from aerobic to anaerobic metabolism. The primary substrate for energy metabolism becomes glucose to support adenosine triphosphate (ATP) production from glycolysis. Thus, the ischemic heart preferentially selects glucose as a substrate regardless of the availability of other fuels (20,21). Imaging techniques that can track myocardial glucose utilization are therefore useful in defining the state of viability in the myocardium.
Glucose is transported across the myocyte membrane by primarily the glucose transporters (GLUTs) GLUT4 and GLUT1 (22,23). Once glucose enters the cell, it undergoes phosphorylation to glucose 6-phosphate, the substrate for glycolysis, glucose oxidation, or glycogen synthesis. FDG is a glucose analogue that enters the myocyte in proportion to glucose uptake and undergoes phosphorylation (24,25). However, unlike glucose, the resulting FDG-6-phosphate becomes metabolically trapped by the myocyte. This allows for FDG uptake to reflect the rate of exogenous glucose utilization and can be used to identify viable myocardium (26,27).
Viability, Stunning, and Hibernation
When flow is reduced to the myocardium, metabolic cellular changes occur due to ischemia and results in reduced contractile function of the myocardium. When ischemia is acute, severe, and sufficiently prolonged (more than 20 to 30 minutes in the acute setting), infarction may result with irreversible cell injury, cell death, and subsequent myocardial scar formation. Once irreversible cellular damage has occurred, these myocytes are no longer viable and cannot recover even if adequately revascularized.
However, the metabolic derangements in the myocyte after short bouts of ischemia may result in more prolonged reduction in myocardial contractile function than can eventually recover. This postischemic ventricular dysfunction has been termed stunned myocardium (28,29). More prolonged sustained or repetitive reductions in flow may also lead to myocardial dysfunction, which some investigators now refer to as hibernating myocardium (30,31). Hibernating myocardium can recover if adequate nutrient flow is restored.
Myocardial Stunning
The myocardial dysfunction that can occur after an episode of ischemia (28,29,32) is a form of reperfusion injury that may result from calcium influx, which hinders the myocyte contractile function (33). It has been well described in animal models and in patients, particularly in the setting of acute myocardial infarction after reperfusion therapy, in acute coronary syndromes, and less frequently after severe exercise-induced ischemia (28,29,30,32,33). When blood flow is restored, the recovery of function may take minutes to days or even weeks depending on the severity of the initial ischemic episode. However, it is considered completely reversible. On the other hand, if repeated episodes of ischemia occur, the resulting postischemic dysfunction may become more persistent. The latter may be an important cause of chronic LV dysfunction in patients with severe ischemic heart disease (32,34,35,36). This repetitively stunned myocardium is viable and has the potential to recover after adequate revascularization (35,36).
Hibernating Myocardium
Hibernating myocardium is the term applied to dysfunctional myocardium with reduced myocardial perfusion at rest but preserved cell viability (30,31). The resulting reduction in myocardial function has been thought to be a protective chronic down-regulation mechanism to reduce myocardial oxygen utilization and ensure myocyte survival (30,31,32). The classic perfusion–metabolism mismatch pattern seen on perfusion PET as compared with FDG PET imaging supported this hypothesis of sustained reduction in flow with maintained viability (and therefore, glucose utilization). This perfusion–metabolism mismatch is considered to represent hibernating myocardium.
However, recent data suggest that the pathophysiology may be more complex. Two theories on the pathogenesis of hibernating myocardium have emerged. One suggests it is due to chronic hypoperfusion and secondary down-regulation of function and metabolism (37). Reductions in flow have been demonstrated in some studies but not in others (34,38,39,40,41,42,43,44,45). This, along with progressive histological changes, sequential down-regulation of function, as well as altered gene expression, suggests that other factors contribute to LV dysfunction in these patients (34,42,43,44,45,46,47,48,49,50). Current evidence points to an alternate mechanism due to repetitive postischemic dysfunction (stunning) that initiates a process of progressive down-regulation. Changes from repetitive stunning with normal resting flow progress to functional hibernation with intact metabolism and contractile reserve; then to structural hibernation without contractile reserve but with preserved glucose uptake on FDG imaging; eventually progressing to irreversible injury with scar formation (34,37,42,43,44,45,46,47,48,49,50,51,52) (Fig. 11.2.1 and Table 11.2.1) Indeed Canty and Fallavollita (45) have observed in a swine model of hibernation
that flow reduction itself is down-regulated secondary to the down-regulation in myocardial function. Other adaptive changes may include reduced high affinity binding sites for β-1 receptors and impaired catecholamine responsiveness. That myocardial hibernation is progressive and may deteriorate to cell death is supported by the repeated observation that early revascularization in patients with viable myocardium improves outcomes (53,54,55) (Fig. 11.2.2). Thus, ischemia from reduction in flow may be only one of multiple factors contributing to the perfusion–metabolic mismatch pattern observed on imaging. Despite this complexity, the accuracy of the PET “mismatch” pattern has been well demonstrated and is associated with recovery after revascularization (5,20,23,32,35,36,56,57,58,59,60,61,62,63,64,65,66,67,68,69,70).
that flow reduction itself is down-regulated secondary to the down-regulation in myocardial function. Other adaptive changes may include reduced high affinity binding sites for β-1 receptors and impaired catecholamine responsiveness. That myocardial hibernation is progressive and may deteriorate to cell death is supported by the repeated observation that early revascularization in patients with viable myocardium improves outcomes (53,54,55) (Fig. 11.2.2). Thus, ischemia from reduction in flow may be only one of multiple factors contributing to the perfusion–metabolic mismatch pattern observed on imaging. Despite this complexity, the accuracy of the PET “mismatch” pattern has been well demonstrated and is associated with recovery after revascularization (5,20,23,32,35,36,56,57,58,59,60,61,62,63,64,65,66,67,68,69,70).
 Figure 11.2.1. Schematic for pathogenesis of hibernating myocardium: progressive adaptive down-regulation from repetitive stunning to hibernation. CFR, coronary flow reserve; DE, dobutamine echo; FDG, fluorine-18-fluorodeoxyglucose. (Figure adapted from Camici P, Dutka D. Repetitive stunning, hibernation, and heart failure: contribution of PET to establishing a link. Am J Physiol Heart Circ Physiol 2001;280:H929–H936; Depre C, Vatner SF. Mechanisms of cell survival in myocardial hibernation. Trends Cardiovasc Med 2005;15:101–110; Canty JM Jr, Fallavollita JA. Hibernating myocardium. J Nucl Cardiol 2005;12:104–119, with permission.) |
Table 11.2.1 Features of Hibernating Myocardium | ||||
|---|---|---|---|---|
|
Image Acquisition, Analysis, and Interpretation
Several approaches for FDG imaging have been developed. However, because myocardial substrate metabolism can be quite variable, most centers use some form of glucose loading and/or insulin protocol to optimize FDG uptake in viable tissue. In addition, because there can also be regional variability, normalization to the perfusion image is often required. Knowledge of the regional perfusion also helps to better characterize the state of the myocardium. Most of the existing accuracy studies have used combined perfusion–FDG uptake imaging protocols using qualitative relative imaging. Accurate detection of myocardial viability, particularly in patients with severely impaired ventricular function, is best achieved by the evaluation of both perfusion and metabolism (5,32,59,71).
Patient Preparation
Oral glucose loading following a 6- to 12-hour fast has become the most widely used approach for preparing patients for FDG imaging. FDG is administered 60 to 90 minutes after a 25 to 100 g (typically 50 g) oral glucose load (5,53,58,59,63,71,72,73,74,75). This switches the primary substrate for myocardial metabolism from free fatty acids to glucose, facilitated by the release of insulin. Thus, viable myocardium will preferentially take up glucose and hence FDG. However, oral glucose loading can result in suboptimal image quality in 2% to 30% of patients (75,76,77,78,79). After the oral load, blood glucose values often unmask glucose intolerance. In such patients and those with frank diabetes, supplemental insulin is necessary (59,71,75). Even with such glucose-loading protocols inclusive of bolus insulin, images are often suboptimal in patients with diabetes (75,79).
In many centers, the hyperinsulinemic euglycemic clamp has been used to improve image quality (43,72,76,79,80,81,82,83,84,85). However, this approach can be more time consuming and cumbersome for the patient and staff.
Some centers have modified the hyperinsulinemic glucose clamp with front loading to reduce the time required to reach steady state. However, this clamp approach still requires monitoring of glucose levels every 5 minutes until stable, and then every 5 to 10 minutes. Glucose infusion rates are adjusted accordingly, aiming to maintain baseline glucose levels (85). Patients with diabetes whose blood glucose has not been well controlled before the study may present with high baseline glucose values. In these cases, a supplemental insulin bolus may be required in addition to the clamp, with careful monitoring of glucose. Due to FDG and glucose competition for the same uptake mechanism, lowering blood glucose levels to the normal or near normal range may reduce competition for FDG uptake and improve image quality.
Practically speaking, the oral glucose-loading protocol is technically easier to perform and requires less nursing and technology resources than the insulin clamp approach. The insulin clamp approach is often preferred for patients with diabetes who are likely to have poor imaging quality. Some centers also use modified approaches with intravenous glucose loading with or without intravenous insulin (71).
Newer approaches are utilizing nicotinic acid derivatives (niacin in North America; acipimox in Europe). The antilipolytic effect of these agents leads to a reduction of competing free fatty acids, thereby facilitating glucose utilization by the myocardium. The approach is simple, making it an attractive alternative, although these agents have not been consistently successful in studies for improving image quality (79,86,87). Additionally, there may be some flushing with niacin, but this can usually be minimized by administration of acetylsalicylic acid before the niacin. One study in patients with CAD, severe LV dysfunction, and diabetes suggested that only the clamp approach significantly improved uptake of FDG in this patient population (79). Further studies on the role of nicotinic acid derivatives are needed.
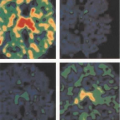
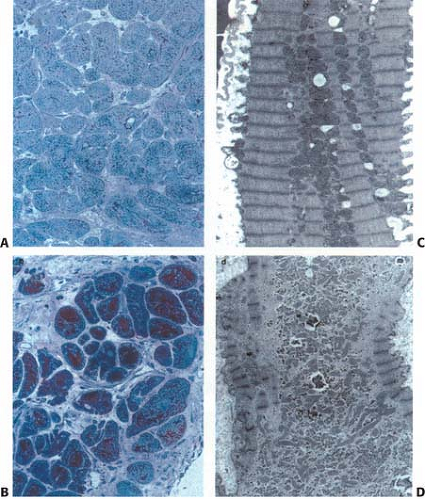 Figure 11.2.2. A: Light micrograph of myocardium showing normal cardiomyocytes with virtually no glycogen (Periodic Acid Schiff [PAS] staining in red). B: Transmission electron micrograph of normal cardiac myocytes. C: Representative light micrograph of a biopsy sample of human hibernating myocardium. Cardiac myocytes are depleted of their contractile material and filled with glycogen (PAS positive staining). D: Representative transmission electron micrograph of a hibernating cardiomyocyte. Microcytic cytoplasm is devoid of sacromeres and filled with glycogen. Original magnification: A and C, X320; B, X7100; and D, X7500. (From Vanoverschelde J-LJ, Wijns W, Borgers M, et al. Chronic myocardial hibernation in humans. From bedside to bench. Circulation 1997;95: 1961–1971, with permission.) |
Because the administration of glucose and insulin can also lead to the influx of potassium (K+) into cells, hypokalemia could theoretically result. In the authors’ experience, the K+ level may drop by up to 0.5 mEq/L after insulin clamp. Supplemental K+ may be necessary in rare circumstances. Generally, this is only a problem in patients who already have hypokalemia, often due to the use of diuretics, and those who undergo the insulin clamp or receive multiple insulin boluses.
Cardiac Fluorodeoxyglucose PET Imaging Protocols
Transmission imaging is required to obtain measured attenuation correction. This is particularly important in cardiac studies because of the significant problems of nonuniformity in the thorax. Transmission imaging to measure attenuation correction may be acquired before the perfusion or before FDG (if perfusion is done at a separate time). More recently postemission transmission using computed tomography (CT) attenuation in PET/CT hybrid devices have been used. This can significantly shorten scanner time for the patient by allowing the patient to enter the camera after FDG is injected and just before the image acquisition begins. CT attenuation methods, while quick, may provide challenges as they may not exactly match the position of the PET image acquisition.
Perfusion PET imaging is important to define the relative state of blood flow in the myocardium at rest. This is usually performed at rest and is compared with FDG uptake. Stress perfusion imaging may also be required in the assessment of some patients with ischemic heart disease to rule out stress-induced ischemia.
Several agents have been used as PET perfusion tracers, including rubidium-82 ([82Rb]), nitrogen-13 ([13N])-ammonia, and Oxygen [150]-water (H2[15O]). In centers without access to a cyclotron or strontium-[82Rb] generators, technetium-99m (99mTc)-based agents or thallium-201 (201Tl) single-photon emission computed tomography (SPECT) imaging can be used for the assessment of perfusion (53,61,62,73,74). This approach carries a limitation of often having perfusion images without attenuation correction (in some centers), while having FDG imaging with attenuation correction. This must be considered when interpreting the images.
FDG imaging can be either static or dynamic. Static imaging typically is a 10- to 30-minute image acquisition, depending on counts, that begin 45 to 60 minutes after injection of 5 to 15 mCi (185 to 555 MBq) FDG (72). This is usually a sufficient time for myocardial uptake to be well visualized while the blood pool activity is low. However later images can also be performed. As FDG clears from the bloodstream over time, it increases the myocardial to blood pool ratio in many patients. Dynamic imaging begins simultaneously with FDG injection and continues for 60 to 70 minutes, such that time activity data for blood pool and myocardium can be determined (e.g., 36 frames: 12 × 10 seconds, 6 × 20 seconds, 6 × 60 seconds, 12 × 300 seconds). The dynamic data are necessary for quantitative analysis of the rate of myocardial glucose utilization. However, this parameter may not be critical for clinical decision making.
Image Interpretation
Accurate tissue characterization and detection of myocardial viability, particularly in patients with severely impaired ventricular function, is best achieved by evaluation and direct comparison of both perfusion and metabolism (5,35,59). Perfusion FDG imaging has become the standard approach for PET viability imaging and is the focus of the discussion later in this chapter.
After the usual evaluation for image quality control, patient motion, artifacts, and extracardiac activity interpretation should begin with a view of the perfusion images to identify regions of maintained or reduced perfusion. Then FDG imaging should be viewed relative to the maximal zones of perfusion (Fig. 11.2.3) As FDG uptake may actually be greater in ischemic or hibernating zones than the FDG uptake seen in normal well-perfused and functional tissues, it may be necessary to normalize the FDG uptake to the zones of maximal perfusion. This can be achieved by scale adjustments or by semiquantitative analysis (Fig. 11.2.4).
It is also important to consider regional and global ventricular function to identify the regions where viability is in question and to determine the potential impact on overall LV function. Several patterns of uptake may be observed and are discussed.
Reduced Perfusion/Maintained or Increased Fluorodeoxyglucose (Mismatch)
The (low) perfusion (preserved)–metabolism mismatch in a dysfunctional myocardial segment is considered the sine qua non of hibernating myocardium (Fig. 11.2.3A). Typically, this has been viewed as representing regions with reduced flow that have been rendered ischemic but are still viable (5,26,32,34,38,39,40,41). As the term hibernating implies, this has been viewed as a down-regulation of function and oxidative metabolism, with preservation of glycolysis as a protective mechanism (30,31). However, the pathophysiology of the mismatch pattern may be more complex. Ischemia from reduction in flow may be only one of many contributing factors. Although perfusion tracer uptake appears reduced, absolute flow may or may not be reduced (34,38,39,40,41,42,43).
Stunning from recurrent stress-induced ischemia may occur and alter the uptake of the perfusion tracer or FDG. Wall thinning and reduced motion may, in part, account for apparent defects on the perfusion image (34). The mixture of ischemic and necrotic tissue may add to the complexity. Reduction in fatty acid oxidation has also been demonstrated in hibernating myocardium (42). Alteration in the GLUT1 and GLUT4 transporter expression has been proposed for hibernating and ischemic tissue (34,88), and glycogen accumulation has been observed, which may not be expected in the presence of ischemia alone (34,35,36,89,90). In addition, the extensive depletion of sarcomeres, loss of sarcoplasmic reticulum, and the observed cellular sequestration suggest that this is a progressive process that may quickly become irreversible injury if not corrected by adequate revascularization (34,35,36,47,48,49,50,54,55,89,90) (Figs. 11.2.1 and 11.2.2; Table 11.2.1).
Hibernating myocardium may represent the limits of viability when adaptive processes have been exhausted (35,47,48,49,50,89)
(Fig. 11.2.1). It may also take several months after revascularization for recovery of function, which may, even then, be incomplete (35,36). This concept of a progressive process of injury is further supported by studies showing increased mortality and impaired recovery of function when revascularization is delayed in patients with viable myocardium (53,54,55).
(Fig. 11.2.1). It may also take several months after revascularization for recovery of function, which may, even then, be incomplete (35,36). This concept of a progressive process of injury is further supported by studies showing increased mortality and impaired recovery of function when revascularization is delayed in patients with viable myocardium (53,54,55).
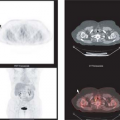
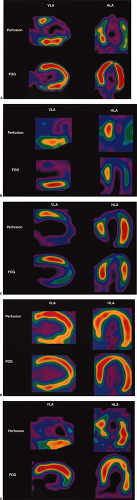 Figure 11.2.3. Examples of perfusion fluorodeoxyglucose (FDG) imaging patterns. Color scale: lowest to highest radioactivity concentration = black/blue/green/yellow/red (yellow/red are normal). A: Perfusion–metabolism mismatch in the anterior, lateral, and anteroseptal regions, indicating extensive hibernating myocardium and high risk. This patient died awaiting revascularization. B: Perfusion–metabolism matched defect in the anterior, lateral, and apical regions indicating extensive scar. This 45-year-old woman subsequently underwent cardiac transplant. C: Partial mismatch in the inferior wall and apex indicating a mixture of nontransmural scar and hibernating myocardium. This patient underwent revascularization and had a modest improvement in ejection fraction from 23% to 28%. D: “Normal” perfusion–metabolism pattern in most of the left ventricle (LV), indicating maintained relative perfusion and metabolism at rest. This patient had severe proximal three-vessel disease and global LV dysfunction. Much of the myocardium was probably “stunned” due to prior ischemic episodes. Ejection fraction improved from 32% to 53% after revascularization. E: Reverse mismatch in the inferior wall. There is a large mismatch in the anterior wall and apex. In this case, the reverse mismatch is due to normalization error because of the intense FDG uptake in the contralateral anterior wall. The patient had single-vessel proximal left anterior descending coronary artery disease and underwent successful percutaneous transluminal coronary angioplasty with improvement in heart failure symptoms. VLA, Vertical Long Axis; HLA, Horizontal Long Axis. |
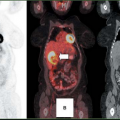
 Figure 11.2.4. Examples of semiquantitative polar map displays. A: Nitrogen-13 ammonia ([13N])-H-ammonia perfusion and fluorodeoxyglucose (FDG) polar maps are shown. The viability map (right) shows the percentage of the left ventricular myocardium with “normally” perfused myocardium (green), “flow-metabolism mismatch” (blue), and “scar tissue” (red). (From Haas F, L J, U H, et al. Ischemically compromised myocardium displays different time-courses of functional recovery: correlation with morphological alterations? Eur J Cardio Thorac Surg 2001;20:290–298, with permission.) B: Rubidium-82 ([82Rb]) perfusion and FDG polar maps are shown. The lower maps are on the same color scale to show the size and extent of the abnormal myocardium expressed as a percentage of the total left ventricle (LV) for both scar tissue and mismatch. The advantage of (A) is the ease of interpretation of the parametric map and emphasis on the mismatch in a segment. The advantage of (B) is that when there is mixture of scar and mismatch it can be defined in the same segment. |
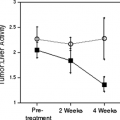
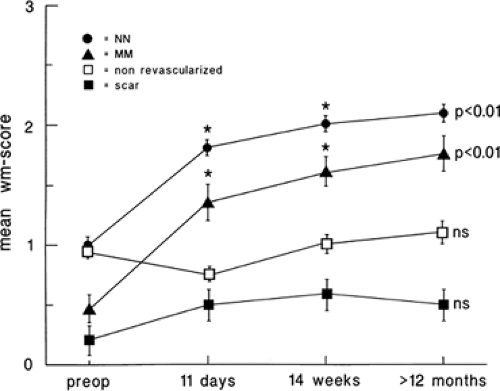 Figure 11.2.5. Time course of recovery of regional wall motion (wm) scores after revascularization in mismatched myocardium (MM), normally perfused myocardium (NN), and scar tissue (mean ± SEM). In contrast to viable tissue (MM and NN), no significant changes were observed for scar tissue. ns, not significant. (From Haas F, Augustin N, Holper K, et al. Time course and extent of improvement of dysfunctioning myocardium in patients with coronary artery disease and severely depressed left ventricular function after revascularization: correlation with positron emission tomography. J Am Coll Cardiol 2000;36:1927–1934, with permission.) |
Regardless of the mechanism, the accuracy of PET “mismatch” as a marker for hibernating myocardium has been well demonstrated and is associated with recovery after revascularization (5,32,35,36,53,56,57,58,59,60,61,62,63,64). Furthermore, the extent of mismatch is related to the degree of recovery (5,32,58). Regional recovery may, however, be incomplete or delayed (Fig. 11.2.5) due to the extent of cellular disruption or coexisting subendocardial infarction, ventricular remodeling, or incomplete revascularization (35,36).
Related posts:

Stay updated, free articles. Join our Telegram channel

Full access? Get Clinical Tree


