Table 6-1 Inherited Cancer Predisposition Syndromes in Which Exposure to Ionizing Radiation Should Be Minimized | ||||||||||
|---|---|---|---|---|---|---|---|---|---|---|
|
 Neurofibromatosis Type 1
It acts as a tumor suppressor gene that functions in part as a negative regulator of the RAS protooncogene (12) and of the mammalian target of rapamycin (mTOR) pathway (13).
It acts as a regulator of neural stem cell proliferation, survival, and astroglial differentiation, in addition to regulating neuroglial progenitor function (14,15). Neurofibromin is required for regulation of intracellular cyclic AMP (cAMP) generation in both neurons and astrocytes; abnormal levels of cAMP appear to be, at least in part, responsible for the abnormalities in glial and neuronal development evident in NF1 patients.
Table 6-2 The Rasopathies
NF1
Noonan syndrome (NS)
Costello syndrome
Capillary malformation-arteriovenous malformation syndrome
Cardiofaciocutaneous syndrome
Legius syndrome
NS with multiple lentigines (LEOPARD syndrome)
It regulates ERK signaling in GABA release, an important pathway involved in learning (and therefore in learning disabilities) (16).
It is involved in the maintenance of the vascular wall. Neurofibromin is expressed in the vascular endothelium and in vascular smooth muscle cells; loss of neurofibromin likely causes smooth muscle proliferation, possibly in response to nonspecific injury to the vascular wall (15), which can lead to vasculopathy (17).
It is involved in bone formation and remodeling. Neurofibromin is expressed in osteoblasts; it inhibits collagen synthesis, promotes mineralization, and regulates osteoclastogenesis (18).
It seems to be required for normal myelination by Schwann cells (18). In addition, the gene for oligodendrocyte myelin glycoprotein, a major myelin protein, is embedded within intron 27b of the NF1 gene (19). Therefore, it is not surprising that abnormalities of myelin/white matter are seen in patients with NF1.
enlargement is primarily attributable to an increase in cerebral white matter volume, with a smaller contribution from the gray matter (30). About 4% to 7% of patients have epilepsy, primarily related to intracranial masses and cytoarchitectural abnormalities (31).
Table 6-3 Criteria for Diagnosis of Type 1 Neurofibromatosis | ||
|---|---|---|
|
Table 6-4 Incidence of Clinical Features of NF1 | ||||||||||||||||||||||||||||||||||||||||||||||||||||||||||||||||||||||||||||||||||||||||||||||||||||||||||||||||||||||||||||||||||||||||||||||||||||||||||||||||||||
|---|---|---|---|---|---|---|---|---|---|---|---|---|---|---|---|---|---|---|---|---|---|---|---|---|---|---|---|---|---|---|---|---|---|---|---|---|---|---|---|---|---|---|---|---|---|---|---|---|---|---|---|---|---|---|---|---|---|---|---|---|---|---|---|---|---|---|---|---|---|---|---|---|---|---|---|---|---|---|---|---|---|---|---|---|---|---|---|---|---|---|---|---|---|---|---|---|---|---|---|---|---|---|---|---|---|---|---|---|---|---|---|---|---|---|---|---|---|---|---|---|---|---|---|---|---|---|---|---|---|---|---|---|---|---|---|---|---|---|---|---|---|---|---|---|---|---|---|---|---|---|---|---|---|---|---|---|---|---|---|---|---|---|---|---|
| ||||||||||||||||||||||||||||||||||||||||||||||||||||||||||||||||||||||||||||||||||||||||||||||||||||||||||||||||||||||||||||||||||||||||||||||||||||||||||||||||||||
time to progression. Sirolimus (an inhibitor of the mammalian target of rapamycin (mTOR) pathway) (51), imatinib mesylate (Gleevec, a cMET blocking agent) (52), and MEK inhibitors (53) have shown demonstrable activity in their treatment.
 Figure 6-1 Optic pathway glioma in NF1. A. Contrast-enhanced sagittal T1-weighted image shows a mass (arrows) infiltrating the chiasm and the hypothalamus and extending into to the lower third ventricle. B. Axial T2-weighted image reveals posterior extension (arrows) of the OPG from the chiasm into the optic tracts to the level of the lateral geniculate body. C. Postcontrast axial T1-weighted image shows incomplete enhancement of the tumor within the optic tracts (arrows). |
significant subarachnoid tumor (Fig. 6-2C). The perineural form is tumor infiltration of the subarachnoid space (astrocytic proliferation), creating a rim of tumor around a relatively unaffected nerve; at times, both forms can coexist (Fig. 6-3B) (66,67). Postcontrast MR using fat suppression will distinguish the two architectural forms of optic nerve gliomas. When the nerve is diffusely infiltrated, enhancing tumor fills the optic nerve sheath, whereas infiltration of the subarachnoid spaces shows a rim of enhancing tumor around a minimally enhancing optic nerve. Marginal cases (characterized by development of mild thickening of the optic nerves or by transient or mild enhancement of the optic nerves) are commonly observed; it is not clear whether these truly warrant a diagnosis of OPG (60). Finally, optic nerve tortuosity (without abnormal thickening or enhancement) is commonly observed in NF1 and should not be mistaken for an optic nerve glioma (60,68).
 Figure 6-2 Optic pathway glioma with extensive infiltration. A. Sagittal T1-weighted image shows a mass extending from the chiasm and hypothalamus (arrows) extending toward the mammillary bodies and the fornices. The pons is slightly enlarged and shows abnormal low T1 signal. B. Axial T2-weighted image shows T2 hyperintense tumor has infiltrated into the medial basal ganglia/internal capsules (white arrows) and the fornices (black arrow). The tumor has extended posteriorly to the level of the lateral geniculate bodies. C. Axial T2-weighted image at a lower level reveals diffuse tumor infiltration, manifested as hyperintensity of the pons and middle cerebellar peduncles (long white arrows). Both optic nerves (short white arrows) are enlarged with homogeneous low T2 signal. |
septum pellucidum; laterally into the temporal lobes; posteriorly into the optic radiations; and inferiorly into the cerebral peduncles and the brainstem (Fig. 6-2). Rarely, tumor can extend into the lateral ventricles.
 Figure 6-3 Optic nerve tumor with infiltration of the optic nerve sheath. A. Postcontrast axial T1-weighted image with fat suppression shows enlarged, enhancing the left optic nerve (long white arrow) and tumor infiltration into the dilated perineural spaces (low T1 signal bordered by a thin rim of enhancement [short white arrows]). The right optic nerve (black arrows) shows a smaller tumor. B. Oblique sagittal T2-weighted image of the left optic nerve with fat suppression reveals thickening and elongation of the nerve. The sheath around the nerve shows marked dilatation and hyperintense signal (white arrows). |
 Figure 6-4 Multivoxel spectroscopy of optic pathway tumor in NF1. A. Axial FLAIR image shows tumor infiltration in the chiasm/hypothalamus (long white arrow) and into the optic tracts (short white arrows). B. Color map of the choline to creatine ratio (Ch:Cr) from a long echo (TE = 270) multivoxel spectroscopy reveals the highest ratio of choline to creatine (red color) at the level of the chiasm/hypothalamus. Significant Ch:Cr elevation is also evident in the thalami bilaterally (yellow color). C. MR spectra from four different ROIs (numbered in image B). Highest (Ch:Cr) is evident in box 1, at the level of the chiasm/hypothalamus. Ch:Cr levels are elevated in the thalami (boxes 3, 4) compared to the putamen (box 2); this suggests the presence of microscopic tumor infiltration in the thalamus, despite the normal FLAIR signal. |
 Figure 6-5 Spontaneous partial involution of a diencephalic tumor. A and B. Axial T2 FLAIR (A) and contrast-enhanced T1 (B) images of a 5-year-old reveals a mass in the inferior left diencephalon with intense enhancement (long arrows, A, B); nonenhancing, presumed vacuolation is evident in the right globus pallidus (short arrow, A). C. Axial FLAIR image 3 years later (without intervening treatment) shows only a small T2 bright residual abnormality, immediately behind the anterior commissure (arrow), which could represent vacuolation or residual tumor (lesion did not enhance). T2 abnormality previously evident in the right globus pallidus shows near-complete resolution. |
vacuolation (Fig. 6-9). This hamartomatous enlargement should not be misdiagnosed as a brainstem glioma; differentiating features from infiltrating gliomas include normal or nearly normal signal in T1-weighted images, only modest (and usually heterogeneous) signal increase on T2 images, absence of contrast enhancement, and lack of progression on follow-up scans. The T2 signal abnormalities partly regress during adolescence, though the brainstem remains enlarged. For more discussion of brainstem tumors, see Chapter 7.
 Figure 6-6 Development of a pilocytic astrocytoma in an area of extensive myelin vacuolation. A. Axial T2-weighted image of a 5-year-old child reveals multiple characteristic foci of T2 hyperintensity (arrows) in the deep cerebellar white matter and middle cerebellar peduncles. B and C. Axial T2-weighted (B) and postcontrast sagittal T1-weighted image (C) obtained 4 years later. A large rim-enhancing T2 hyperintense mass (arrows) has developed within the deep right cerebellar white matter, with surrounding edema. |
 Figure 6-7 Midbrain juvenile pilocytic astrocytoma in a 14-year-old with NF1. A. Postcontrast T1-weighted image shows a sharply marginated, intensely enhancing mass (white arrow) in the dorsal inferior midbrain. B. Axial FLAIR image demonstrates the well-circumscribed hyperintense mass (white arrow) to have minimal surrounding edema. C. Single voxel long echo (TE = 270) spectroscopy of the tumor reveals a very high Ch:Cr (3.49; normal < 1.5) and presence of lactate (double arrows). These MRS findings, worrisome for a malignant tumor, are commonly observed in pilocytic astrocytomas, the likely diagnosis in this patient. N-Acetylaspartate to creatine ratio (NAA:Cr) is decreased (1.68; normal > 2). The NAA:Cr is higher than expected for a glial neoplasm, likely secondary to contamination of the voxel by surrounding (normal) brain tissue as the voxel (2 × 2 × 2 cm size) is slightly larger than the tumor. |
 Figure 6-8 Grade 2 (fibrillary) glioma in the left temporal lobe of a 10-year-old with NF1. A. Axial T2-weighted image shows a tiny, hyperintense lesion (white arrow) in the white matter of the posterior left temporal lobe. B. Axial T2-weighted image a year later shows an ovoid, well-defined T2 bright focus in the same location (arrow), representing the enlarged tumor. |
 Figure 6-9 Probable hamartomatous enlargement of the brainstem. A. Sagittal T1-weighted image reveals diffuse enlargement of the pons and, especially, medulla (white arrows); the signal intensity is normal. B. Axial T2-weighted image shows enlargement and heterogeneously increased signal in the dorsal right pons and middle cerebellar peduncle, with slight mass effect on the fourth ventricle (arrow). |
Occasionally, the tectum may appear short and thick in aqueductal stenosis because of mass effect on the rostral aspect of the tectum by a dilated suprapineal recess (see Chapter 8). In these cases, the patient should be reevaluated after ventricular decompression.
 Figure 6-10 Hypothalamic hamartoma in a 15-year-old boy with NF1. A. Sagittal T1-weighted image shows a gray matter intensity mass (short white arrows) in the floor of the third ventricle, posterior to the chiasm (long white arrow), and anterior to the mammillary bodies (black arrow). B. Coronal T2-weighted image reveals bilateral gray matter intensity mass (black arrows) in the floor and left lateral wall of the hypothalamus. |
 Figure 6-11 Sagittal T1-weighted image shows an abnormally thick corpus callosum (white arrows). The ventral pons (black arrows) is prominent. |
repair or remyelination (98). The increased diffusivity of white matter (even normal-appearing white matter) in NF1 (99,100) further supports the concept of abnormal myelin as an underlying cause.
 Figure 6-12 Evolution of characteristic T2 bright signal abnormalities in pediatric NF1. A. Axial T2-weighted images through the posterior fossa of a 14-monthold reveals a few ill-defined foci of increased T2 signal within the deep cerebellar white matter in the middle cerebellar peduncles (arrows). B. Corresponding axial T2-weighted image in the same patient at age 3 years. There are now extensive foci of T2 abnormality within the deep cerebellar white matter, the middle cerebellar peduncles, and the pons (arrows). The volume of the involved tissue is mildly increased, resulting in mild distortion of the fourth ventricle. |
 Figure 6-13 Partial resolution of basal ganglia signal abnormalities in NF1. A. Axial T2-weighted image at age 7 years shows multiple bilateral hyperintense abnormalities (white arrows) in the globi pallidi and internal capsules. B. Axial T2-weighted image 4 years later shows significant regression of the abnormalities. |
abnormality or be located along its periphery/rim. (Calculation of T1 values shows that the frontal white matter, caudate nuclei, putamina, and thalami also have some T1 shortening (86), but it is not apparent to visual inspection in these other areas.) In some patients, the T1 shortening is observed at the time of a first MRI, prior to exposure to gadolinium-based contract agents. However, many of the NF patients with appreciable T1 bright signal changes in the globus pallidus also have bright T1 signal in their dentate nuclei and have undergone multiple contrast-enhanced MRI exams; the T1 bright signal changes in some of these cases, therefore, may be a reflection of gadolinium deposition in the brain (107), rather than a reflection of an intrinsic abnormality of the myelin.
 Figure 6-14 T1 and T2 prolongation in the basal ganglia in NF1 of an 18-year-old. A and B. Noncontrast sagittal T1- (A) and axial T2 (B)-weighted images show a lesion in the left globus pallidus with hyperintensity on both T1 and T2 images (arrows). There was no associated mineralization or calcification on susceptibilityweighted images or CT images (not shown). |
artery, or proximal anterior cerebral artery is the most common site of involvement (Figs. 6-16 and 6-17). Moyamoya phenomenon with marked enlargement of the lenticulostriate arteries (which function as collateral vessels) is seen in many such patients (113). (Moyamoya is discussed further in Chapter 12.) Fusiform arterial dilation, cerebral aneurysms, and arteriovenous fistulas are also described, although less commonly (109,113,114).
 Figure 6-15 High-resolution coronal FSE T2-weighted image reveals hyperintense T2 signal of both hippocampal formations (white arrows) (compare signal to that of adjacent temporal cortex). The right hippocampus is brighter and larger than the left. |
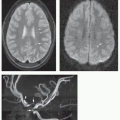
 Figure 6-16 Progressive NF1-related vasculopathy. A. Axial T2-weighted image at age 18 months shows normal-appearing signal voids in the basilar and proximal anterior and middle cerebral arteries—note the normal right MCA (arrow). B. Axial T2-weighted image 2 years later shows diminished size of the right MCA signal void (white arrow). C. Coronal reconstructed MIP image from a 3D TOF MRA reveals a lack of flow-related enhancement in the right MCA (arrows), consistent with an acquired complete occlusion (or very severe stenosis). |
 Figure 6-17 Vascular dysplasia in NF1. A. Axial T2-weighted image shows asymmetric appearance of the internal carotid arteries with absent flow void within the right posterior cavernous sinus (short arrow). The left optic nerve sheath is enlarged (long arrow). B. Lateral view of catheter angiography of the right common carotid artery shows dysplasia of the horizontal segment of the cavernous segment of the internal carotid artery with three focal areas of aneurysm formation (arrows); focal stenosis is evident next to the most distal aneurysm. |
 Figure 6-18 Dysplasia of the sphenoid wing with associated plexiform neurofibroma. A. Axial T2-weighted image shows an extensive neurofibroma (white arrows) infiltrating the superior orbit and the left temporal fossa (the V1 distribution). The greater wing of the sphenoid bone is dysmorphic, resulting in anterior extension of the contents of the left middle cranial fossa. B. Axial T2-weighted image at a slightly lower level shows the inferiorly displaced, proptotic left globe. Neurofibroma is also evident within an enlarged pterygopalatine fossa (V2 distribution, white arrows). |
often reveals extension into the cavernous sinus, nasopharynx, or pterygomaxillary fissure. The neck is another common location for neurofibromas, especially along the course of the vagal nerve, with an estimated occurrence of 25% to 30% in patients with NF1 (Fig. 6-20) (120). Neck masses, their appearance, and their differential diagnoses are discussed in Chapter 7.
 Figure 6-19 Rapid progression of orbital plexiform neurofibroma. A. Axial fat-suppressed T2-weighted image of an 8-month-old reveals a dysplasia of the left greater wing of the sphenoid with resultant enlargement of the left middle cranial fossa. Mild soft tissue thickening is evident in the left cavernous sinus (black arrow) and in the lateral left orbital extraconal soft tissue (white arrows) indicative of a V1 distribution plexiform neurofibroma. The left globe is mildly proptotic. B and C. Corresponding axial fat-suppressed T2 (B) and contrast-enhanced T1 (C) images 2 years later show marked progression in the size of the plexiform neurofibroma within the cavernous sinus (black arrows) and in the pre- and postseptal soft tissues of the left orbit (white arrows). Left globe proptosis has significantly worsened. |
 Figure 6-20 Slow progression of an extensive plexiform neurofibroma. A. Coronal inversion recovery fat-suppressed T2 image at age 5 years reveals several infiltrative T2 hyperintense masses (numbered 1 to 3, seen to connect on other images) in the paravertebral, deep cervical, and upper thoracic soft tissues typical of a plexiform neurofibroma. B. Corresponding coronal fat-suppressed T2 image 12 years later shows marked enlargement of the plexiform neurofibroma. The largest component measures approximately 40 mm in diameter. It has preserved central T2 dark/target characteristic (evident in all components of the mass); findings are not suggestive of a malignant transformation. |
curves are associated with a high incidence of paraspinal or other internal neurofibroma next to the vertebra. Patients with paraspinal PNs have sixfold higher odds of developing spinal curvature abnormalities compared to patients without PNs (128). Dysplasia of the vertebral bodies is common, as are hypoplasia of the pedicles, transverse processes, and spinous processes; scalloping of the posterior aspects of the vertebral bodies; and hyperplastic bone changes (120,129). It is not certain whether these bony anomalies result from a primary mesodermal dysplasia or are secondary to the effects of nerve sheath tumors. Plain film radiography is essential to demonstrate the scoliosis optimally. CT is the optimal modality for demonstrating the changes of the individual vertebrae, as it shows superior bone detail. However, most of the bony changes are well visualized with high-quality MR studies.
 Figure 6-21 Malignant nerve sheath tumor developing within a plexiform neurofibroma in a 15-year-old who recently experienced lower neck pain. A and B. Axial (A) and coronal (B) T2-weighted images with fat suppression reveals a mass in the right brachial plexus. Central target signs (black arrows) are evident in the more superficial aspects of the lesion, characteristic of plexiform neurofibroma. In the deeper portion of the mass, a larger confluent area (white arrows) without target sign is evident. Malignant nerve sheath tumor was confirmed by needle biopsy of this area. |
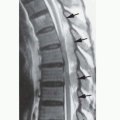
 Figure 6-22 Rapid progression of cervical kyphosis (without surgical intervention) in NF1. A. Sagittal T1-weighted image at age 10 years shows a focal kyphotic deformity in the mid cervical spine (black arrows) secondary to dysplasia and erosions of the adjacent cervical vertebrae. B. Postcontrast axial T1-weighted image with fat suppression through the midportion of the kyphosis reveals enhancing, infiltrating plexiform neurofibroma in the prevertebral space (short arrows), extending laterally into the right vertebral foramen (long arrow). The anterior aspect of the vertebral body is eroded (white arrowheads). The subarachnoid spaces (black arrowheads) along the posterior/right lateral aspect of the cord are enlarged secondary to the dural ectasia and kyphotic deformity. C. Sagittal T1-weighted image 6 years later reveals marked progression in kyphotic angulation. |
 Figure 6-23 Dural ectasia in NF1. A and B. Sagittal (A) and axial (B) T2-weighted images demonstrate scalloping of the posterior vertebral bodies at the lumbosacral junction (arrows, A). Bilateral anterior sacral meningoceles are evident (arrows, B). The largest on the left extends out of the spinal canal through a widened neural foramen (*). |
 Figure 6-24 Extensive plexiform and spinal neurofibromas with cord compression in NF1. A. Coronal T2-weighted image of the lumbar spine and upper pelvis shows extensive plexiform neurofibroma (subcutaneous and muscular spaces). Intraspinal involvement is evident at the level of the kidneys (black arrow). B and C. Axial FSE T2-weighted image (B) and postcontrast axial SE T1-weighted image (C) through the upper lumbar spine show large bilateral neurofibromas (n) expanding the spinal canal and neural foramina; the intradural component of the right-sided neurofibroma displaces the thecal sac to the left (white arrow). Extensive plexiform neurofibromas infiltrate the retroperitoneum. |
a threshold value of 5 cm is frequently used (140,141). Other MR findings indicative of a MPNST (Fig. 6-21) include irregular tumor shape, poor demarcation from surrounding tissues, evidence of necrosis, intratumoral lobulation, presence of high-signal-intensity foci on T1-weighted images (corresponding to intratumoral hemorrhage) and lack of target sign. ADC values tend to be lower than for benign peripheral nerve sheath tumors. Heterogeneous enhancement and a lower proportion of enhanced area have been documented (122,125,142). Of note, marked heterogeneity can be seen in benign tumors as well (124), so this is not a specific imaging sign.
 Figure 6-25 Multiple small intraspinal neurofibromas. A. Sagittal T2-weighted image shows multiple small nodular soft tissue intensity foci (white arrows) in the subarachnoid space. B. Axial postcontrast T1-weighted image shows that the lesion (arrow) at the sacral level enhances. |
 Figure 6-26 Bilateral C1-C2 spinal neurofibromas with spinal cord compression in NF1. Axial T2-weighted image shows neurofibromas (white arrows) that compress the thecal sac and spinal cord (small white arrowheads). An intradural neurofibroma component is evident on the right (large white arrowhead). (* denotes odontoid process of C2). |
 Neurofibromatosis Type 2
begin to develop in children, symptoms are often delayed until early adulthood (late teens or 20s) when the tumors become large enough to cause symptoms. In contrast to the situation in adults, hearing loss is an uncommon presentation in childhood; seizures (caused by meningiomas) and facial nerve palsy are much more common presenting symptoms, as are neurologic symptoms related to brainstem and/or spinal cord tumors (150,153,154). Tumor load tends to be extensive when presentation is during childhood; cranial meningiomas are seen in 60% of cases, cranial schwannomas (other than vestibular) in 36%, and spinal schwannomas and meningiomas each in 80% (154). NF2-associated intracranial tumors show substantial variability in growth rate and pattern. The most common growth pattern is saltatory, characterized by periods of growth and quiescence; linear growth and exponential growth are less common (155).
 Figure 6-27 Small bilateral acoustic schwannomas in NF2. A. Postcontrast axial T1-weighted image shows bilateral enhancing masses (arrows) filling the internal auditory canals. On the right, the mass extends into the vestibule (arrowhead). B. Axial steady-state acquisition T2-weighted image (FIESTA) shows replacement of hyperintense CSF signal in the interval auditory canals by the hypointense schwannomas (arrows) and a filling defect in the right vestibule (arrowhead) from intralabyrinthine tumor extension. |
 Figure 6-28 Bilateral acoustic schwannomas and cerebellar hamartomas in an adolescent with NF2. A and B. Postcontrast axial T1 (A) and axial fat-suppressed fast spin-echo T2 (B) images demonstrate bilateral nerve VIII schwannomas (arrows, A); the larger leftsided lesion expands the internal auditory canal and extends into the cerebellopontine angle cistern, compressing the middle cerebellar peduncle. Multiple nonenhancing T2 bright lesions are evident in the cerebellar hemispheres (arrows, B), with associated retraction deformities; appearance is consistent with that of hamartomas. |
mildest form of the disease with late onset. Patients have slowly growing eighth cranial nerve schwannomas and not more than one other tumor (meningioma or schwannoma). Type 2, also called Wishart’s form of NF2 or the Wishart-Lee-Abbott form, is a more severe form characterized by early onset and the presence of multiple tumors, including schwannomas, meningiomas, ependymomas, and sometimes astrocytomas. Patients with type 2 NF2 have a higher incidence of cataracts and skin tumors, as well as CNS tumors, than do those with type 1 NF2 (137). These subgroups have proved useful for prognostic purposes; however, the reader should remember that, as with nearly all such groupings, many patients with NF2 have intermediate severity of the disease and may not fall neatly into either form.
 Figure 6-29 NF2 with multiple schwannomas. A. Postcontrast axial T1-weighted image of NF2 patient reveals bilateral trigeminal schwannomas. The left-sided schwannoma is limited to the cisternal portion of the nerve (white arrow), while the right-sided one involves the cisternal portion (small black 5) and the trigeminal ganglion (large black 5). B. Postcontrast axial T1-weighted image shows bilateral eighth nerve schwannomas (white arrows), schwannoma of the left temporal branch of the third division of the fifth cranial nerve (white arrowhead), and the large schwannoma involving the right trigeminal ganglion (black 5). C. Postcontrast axial T1-weighted image at a slightly more inferior level shows, in addition to the fifth nerve tumors (black 5) described in (B), a ninth nerve schwannoma (white arrow) in the cerebellomedullary cistern. D. Postcontrast coronal T1-weighted image shows the large right-sided fifth nerve schwannoma (white arrows) extending through and expanding the right foramen ovale. |
Moreover, it may fall upon the radiologist to make the diagnosis of NF2 in affected patients. The characteristic intracranial abnormalities are schwannomas of the vestibular (Figs. 6-27, 6-28, 6-30) and other cranial nerves (most commonly the oculomotor and the trigeminal nerves, Fig. 6-29) and meningiomas (often multiple, Fig. 6-30).
 Figure 6-30 NF2 with bilateral acoustic neuromas and multiple meningiomas. Postcontrast coronal T1-weighted image shows bilateral enlargement of the cranial nerve VIII within the internal auditory canal and the cerebellopontine angles, compressing the brainstem (*). Meningiomas are demonstrated above the left petrous bone (short arrow), within the lateral ventricles (long arrow), and over the right cerebral convexity, with associated blistering of the parietal bone (double arrows). |
Table 6-5 Criteria for Diagnosis of Neurofibromatosis Type 2 | |||
|---|---|---|---|
|
schwannomas can be seen (148). Ependymomas and astrocytomas of the spinal cord are sometimes difficult to distinguish by CT and MR; the presence of a centrally located, contrast-enhancing tumor with sharply marginated borders favors a diagnosis of ependymoma over astrocytoma. Ependymomas can be solitary (most often involving the conus medullaris and filum terminale), or multiple, occurring at all levels of the neural axis. Contrast-enhanced MR is the imaging modality of choice. Without the administration of contrast, ependymomas of the spinal cord may be difficult to differentiate from multiloculated syringohydromyelia. Further characteristics of intramedullary neoplasms are described in Chapter 10.
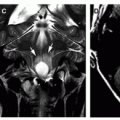
 Figure 6-31 Multiple spinal schwannomas in a patient with the schwannomatosis variant of NF2. A and B. Sagittal postcontrast T1-weighted images show multiple enhancing intra- and extramedullary masses, mostly intramedullary (black arrows) in A and mostly extramedullary (white arrows) in B. C. Coronal T2-weighted image shows multiple enlarged nerves (small white arrows) exiting bilateral neural foramina in the cervical spine. On T2-weighted images, it is difficult to separate schwannomas from lymph nodes (large white arrow) of the neck when away from the neural foramina, so contrast administration is essential. D. Contrast-enhanced axial T1-weighted image in the midlumbar region shows a large enhancing mass (long arrow) occupying the lateral aspect of the spinal canal in the left, enlarging the neural foramen, and extending deep to the psoas muscle. Normal enhancing nerve ganglion is evident on the right side (short arrow). |
be caused by fluid secreted into the spinal cord and central canal by the tumor (175). If syringohydromyelia is seen in neurofibromatosis (either NF1 or NF2) and no extramedullary mass can be seen, a thin section, contrast-enhanced MR of the spinal cord should be performed to rule out an intramedullary lesion. Syringohydromyelia is discussed in more detail in Chapter 9.
 Tuberous Sclerosis Complex
infants presenting with infantile spasms have tuberous sclerosis (210). The infantile spasms evolve into other seizure types, most commonly symptomatic generalized epilepsy (˜60%), partial epilepsy (˜20%), or a mixture of partial and generalized epilepsy (˜20%) (211). The seizures often decrease in frequency with increasing age (212), particularly when the epilepsy is partial (213). Patients with TSC can have nearly any type of seizure; therefore, the diagnosis of tuberous sclerosis should be considered in any child with epilepsy. The incidence of intellectual disability is about 50% (214); approximately two-thirds will be moderately to severely disabled, and one-third only mildly to moderately affected. Cognitive impairment in TSC is a multifactorial condition; a link exists between cognitive disabilities and lesion load (based on the proportion of brain volume occupied by tubers and on the number of RML (215)), age at seizure onset, and history of infantile spasms (216); however, these factors explain only part of the intelligence quotient variability (186).
Table 6-6 Diagnostic Criteria for Tuberous Sclerosis Complex (Revised 1998) | |||||||
|---|---|---|---|---|---|---|---|
|
 Figure 6-32 In utero MRI of a fetus with tuberous sclerosis. A. Coronal single-shot half-Fourier RARE image through the fetal brain shows a cortical tuber (black arrowheads) extending from the right frontal cortex through the cerebral mantle to the superolateral surface of the right lateral ventricle. A subependymal hamartoma (black arrow) is also present. B. Coronal image through the parietal lobe and chest shows a large cardiac rhabdomyoma (R) in addition to a parietal tuber (black arrow). |
present at birth and are frequently the cutaneous lesions that lead to a diagnosis of tuberous sclerosis in children with seizures (222). In lightskinned children, the depigmented nevi may be demonstrable only under an ultraviolet light. Café au lait spots are occasionally seen in patients with tuberous sclerosis, but their incidence is similar to that in the general population; their presence in isolation should not suggest a diagnosis of phakomatosis (223). Rarely, patients may develop lesions of the scalp that induce hyperostosis of the underlying calvarium; histologically, these seem to be epidermal inclusion cysts. The other common cutaneous lesions of tuberous sclerosis, shagreen patches and subungual fibromas, do not usually appear until after puberty and will not be discussed here.
 Figure 6-33 Retinal hamartoma. A. Axial noncontrast CT image shows a subretinal exudate with a focal nodule (arrow). B. Axial T1-weighted image shows a nodule (arrow) in the right globe that is isointense to the subretinal exudate. C. Postcontrast axial T1-weighted image shows that the nodule enhances moderately. |
CT and MR changes with the age of the patient. They are rarely calcified in the first year of life; the number of calcifications typically increases with the age of the patient (217). Thus, they may be difficult to detect on CT scans of infants (Fig. 6-36C) but become progressively easier to identify as they calcify (Fig. 6-37, also Fig. 6-40B). On MR scans, subependymal hamartomas appear as irregular SENs that protrude into the adjacent ventricle. Their appearance changes as the signal of the surrounding white matter changes (209,230). In fetuses and infants, who have unmyelinated white matter, the hamartomas are relatively hyperintense on T1-weighted images and hypointense on T2-weighted images (Figs. 6-35 and 6-36) (231); in fetuses and newborn (especially premature) infants, these may be mistaken for subependymal hemorrhages unless other lesions of tuberous sclerosis are identified. As the brain myelinates, the SENs gradually become isointense with the white matter. They are most easily visualized on T1-weighted images where they contrast with low signal intensity of the CSF. Small nodules may not be apparent on T2-weighted images. Larger SENs manifest variably low signal intensity on the T2-weighted images, depending upon the extent of calcification (209,232,233). T2*-weighted gradient echo or susceptibility-weighted images are optimal for showing the calcification because of the magnetic susceptibility differences of calcium and brain (see Fig. 6-41). After intravenous administration of paramagnetic contrast, SENs show variable enhancement; some will enhance markedly, some mildly, and some not at all (209,234,235). The presence or absence of enhancement has no clinical significance. SENs have increased diffusivity and reduced FA compared to surrounding white matter (236).
Related posts:


Stay updated, free articles. Join our Telegram channel

Full access? Get Clinical Tree


