New Dose Reduction Strategies in CT Myocardial Perfusion Imaging
Ting-Yim Lee, PhD
Aaron So, PhD
Esmaeil Enjilela, PhD
Jiang Hsieh, PhD
▪ Introduction
With the advent of fast scanning capability through the development of slip-ring technology, CT has become the imaging modality of choice in the assessment of coronary artery disease (CAD), particularly in the emergent situation of acute chest pain. Coronary computed tomography angiography (CCTA) is now widely used to image the morphology of coronary vessels to detect severe stenosis that requires revascularization.1,2 and 3 Even with its prevalence in the diagnostic armamentarium, CCTA remains an anatomical technique rather than a functional/physiologic technique for the sensitive detection of functional myocardial ischemia downstream to a stenosis.4,5 and 6 To address this shortcoming of CCTA, myocardial perfusion imaging (MPI) lately has become a focus of research for cardiac CT. In the triage of acute chest pain, the combination of CCTA and MPI promises to be the ideal one-stop shop for the comprehensive anatomical and physiologic evaluation of CAD6 before directing the appropriate patient to revascularization.
However, one main limitation of MPI with CT is the high radiation dose (approximately 20 mSv) from the necessity of repeatedly scanning the heart following injection of contrast (see next section). As such, recently a variety of methods have been developed to reduce the radiation dose of CT MPI. This chapter discusses these methods and illustrates them with examples.
▪ CT Myocardial Perfusion Imaging
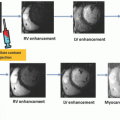
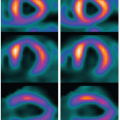
To understand better how the new radiation dose reduction methods work, it is useful to describe the three different scanning protocols/methods for CT MPI. First, perfusion in ischemic myocardium is visually assessed from source CCTA images as the relative contrast enhancement with respect to normal myocardium7,8 (Fig. 3-1). Hypoattenuation relative to other parts of the myocardium is taken as ischemia. It is a qualitative assessment and depends on the time of arrival of contrast in the ischemic relative to that in the normal myocardium as well as the timing of the CCTA acquisition relative to the arterial (aorta) concentration. Second, the initial phase of time-density curves (TDCs) is acquired by scanning the heart with prospective ECG gating9,10 (Fig. 3-2). Myocardial perfusion is calculated as the front slope of the myocardial TDC normalized by the maximum value of the aortic TDC.10 Figure 3-2A-C shows an example of MPI in a dog model of acute heart attack. As shown, the method is able to detect stress- (adenosine) induced ischemia. One fundamental assumption of the upslope method is that during the time interval (10 seconds in Fig. 3-2) of its measurement, there is no outflow of contrast from the myocardium—no venous outflow. This is a rather stringent condition, and in general, it is not known whether it will be satisfied in all ischemic conditions. Third, entire TDCs are acquired by either cine-retrospective11 or prospective ECG gating,10,12 and kinetics modeling is applied to derive myocardial perfusion as shown in Figure 3-3. The application of kinetics modeling obviates the need of the no venous outflow assumption, and myocardial perfusion measurements obtained with this last method are the most accurate resulting in one-to-one correspondence with the gold standard microsphere measurements.13 The main disadvantage is the high radiation dose imparted.
As a comparison, the effective dose for a prospectively gated CCTA is about 3.7 mSv,14 while the effective dose of the kinetics modeling method for MPI of the whole heart using either cine-retrospective gating11 or prospective gating10 is 19.4 and 6 to 17.7 mSv, respectively. The upslope method, because of its shorter acquisition window compared to the kinetics modeling method (Fig. 3-2 vs. Fig. 3-3), has an effective dose that is 40% to 50% less. Given the clinical utility of accurate MPI,6 there is an impetus to develop methods to reduce the higher effective dose required by the kinetics modeling. In the following sections, a number of recently developed methods for reduction of radiation dose are presented.
▪ Current Methods for Reducing Radiation Dose in Myocardial Perfusion Imaging
Besides prospective gating that can reduce the radiation dose of MPI by two to three times relative to retrospective gating, and currently, there are three methods under investigation: (a) iterative image reconstruction; (b) principal component analysis (PCA) of TDCs; and (c) compressed sensing (CS) image reconstruction.
Iterative Image Reconstruction
The concept of iterative reconstruction (IR) as embodied in the algebraic reconstruction technique (ART)15 predates filtered back projection (FBP) for the reconstruction of CT images.16 However,
because of the limited computing power of image reconstruction computer workstations and the slow convergence of ART for noisy data, until recently FBP has replaced ART for image reconstruction in all commercial CT scanners. The current resurgence of interest in IR not only stems from the increased computing speed of reconstruction workstations but, more importantly, allows CT scanning at lower radiation dose with similar noise levels and image quality as routine dose FBP.17,18,19 and 20
because of the limited computing power of image reconstruction computer workstations and the slow convergence of ART for noisy data, until recently FBP has replaced ART for image reconstruction in all commercial CT scanners. The current resurgence of interest in IR not only stems from the increased computing speed of reconstruction workstations but, more importantly, allows CT scanning at lower radiation dose with similar noise levels and image quality as routine dose FBP.17,18,19 and 20
 Figure 3-1. A: Time-density curves measured in the aorta and myocardium following intravenous contrast injection. Coronary CTA (CCTA) acquires images of the heart (vessels and myocardium) at the maximum of arterial contrast concentration. B: SPECT myocardial perfusion imaging shows ischemia in the left anterior descending (LAD) and right coronary artery (RCA) territories. C, D: Source CCTA images show corresponding hypoattenuation in the same territories. E: Catheter-based coronary angiogram shows stenosis in both LAD and RCA arteries. F: Myocardial perfusion map of a pig obtained 3 days after its LAD had been occluded for 1 hour and then reperfused. Two small regions of interest (ROIs) one in the ischemic apical region and one in the distant lateral wall of the LV are shown. G: Time-density curves of the normal and ischemic myocardium from the two ROIs in (F) as well as that of the aorta. The relative enhancements of normal versus ischemic ROI at peak (red dashed line) and after peak (pink dashed line) aortic enhancement are shown. (Courtesy of Dr. Jonathan Leipsic, St. Paul’s Hospital, Vancouver, British Columbia, Canada.) |
 Figure 3-2. A: Time-density curves measured in the aorta and myocardium following intravenous contrast injection. For the implementation of the upslope method for the calculation of myocardial perfusion, the image acquisition window (pink box) centers around the peak of the aortic (arterial) curve. B: Aortic (AIF), normal, and ischemic myocardium time-density curves (TDCs) obtained in a dog 15 minutes after occluding 80% diameter of a distal segment of LAD. As shown, the upslope of the ischemic TDC is significantly less than that of the normal TDC. C, D: Myocardial perfusion map of the same dog as (B) in a sagittal reformat before (C) and after (D) adenosine stress. The numbers in (C) and (D) are the perfusion in the anterior and posterior wall of the LV. Under stress, perfusion in the anterior wall within the LAD territory decreased from 106 to 67 mL/min/100 g, while perfusion in the remaining unaffected (normal) myocardium increased from 97 to 172 mL/min/100 g. (Modified from Mahnken AH, Klotz E, Pietsch H, et al. Quantitative whole heart stress perfusion CT imaging as noninvasive assessment of hemodynamics in coronary artery stenosis: preliminary animal experience. Invest Radiol 2010;45:298-305.) |
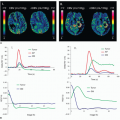
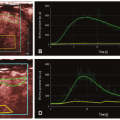
 Figure 3-3. A: Time-density curves measured in the aorta and myocardium following intravenous contrast injection. For the implementation of kinetics modeling for the calculation of myocardial perfusion, the image acquisition window (dark and light pink box) has to cover both the first pass and recirculation phases of the TDC at different image frequencies being higher for the first-pass phase. B: Four chamber view of a patient’s heart when all chambers were filled with contrast. Aortic (red) and basal septal wall (green) ROIs to generate TDCs are shown. C: Aorta and basal septal wall TDCs. D: Rest myocardial perfusion map of the same patient as (B). Perfusion values are displayed in a rainbow color scale from 0 to 200 mL/min/100 g. |
The core of IR consists of a loop of backward and forward projection steps that can be iterated a number of times to improve image quality as shown in Figure 3-4. To start the IR, the first step is a normal FBP of the measured (raw) projection data to reconstruct
a CT image of the object. Then, the CT image is forward-projected while simulating CT acquisition by using a priori knowledge of the characteristics of the CT system (e.g., machine geometry, size of detector, and voxel) to obtain synthesized projections. These projections are further modified by the statistics model, which accounts for photon noise, efficiency of individual detector elements, and electronic noise, before they are compared with the measured projections. The differences between the synthesized and measured projections are backward projected to generate an object update candidate (image), which is used to correct the current object estimate (image). Forward and backward projection steps are repeated a fixed number of times or until corrections become very small. GE Healthcare has implemented the full IR algorithm as described above in their Modeled Based Iterative Reconstruction (MBIR) algorithm.21 However, even with current computing speed of a multiprocessor computer (Veo), the reconstruction time for each heart volume is about 10 minutes. For now, this long reconstruction time will limit the use of MBIR for dose reduction in MPI since multiple (approximately 20 to 25) volumes of the heart following contrast injection have to be reconstructed.
a CT image of the object. Then, the CT image is forward-projected while simulating CT acquisition by using a priori knowledge of the characteristics of the CT system (e.g., machine geometry, size of detector, and voxel) to obtain synthesized projections. These projections are further modified by the statistics model, which accounts for photon noise, efficiency of individual detector elements, and electronic noise, before they are compared with the measured projections. The differences between the synthesized and measured projections are backward projected to generate an object update candidate (image), which is used to correct the current object estimate (image). Forward and backward projection steps are repeated a fixed number of times or until corrections become very small. GE Healthcare has implemented the full IR algorithm as described above in their Modeled Based Iterative Reconstruction (MBIR) algorithm.21 However, even with current computing speed of a multiprocessor computer (Veo), the reconstruction time for each heart volume is about 10 minutes. For now, this long reconstruction time will limit the use of MBIR for dose reduction in MPI since multiple (approximately 20 to 25) volumes of the heart following contrast injection have to be reconstructed.
Related posts:
 Vascular Anatomy and Microanatomy
 Dynamic Susceptibility Contrast MRI: Technical Considerations and Practical Issues
 Myocardial Perfusion Imaging: MR Techniques
 Myocardial Perfusion Imaging with PET/SPECT: Techniques and Clinical Applications
 Ultrasound Perfusion Imaging: Techniques and Analytical Methods
 Contrast-Enhanced Ultrasound: Clinical Applications
Stay updated, free articles. Join our Telegram channel

Full access? Get Clinical Tree


