chapter 8 Non-Small Cell Lung Cancer
INTRODUCTION
In the United States, lung cancer is the number one cause of cancer death for both men and women. Its incidence is approximately 174,470 new cases with 162,460 deaths annually.1 There are two major histologic subtypes of lung cancer: small cell lung cancer (SCLC) and non-small cell lung cancer (NSCLC). Approximately 80% of lung cancers diagnosed are NSCLC, which includes adenocarcinoma, squamous cell carcinoma, and many other histologies.
The primary treatment of SCLC is systemic chemotherapy with or without concurrent thoracic radiation therapy. The treatment of inoperable NSCLC is variable. For early-stage disease, surgery is the standard of care with consideration for postoperative chemotherapy.2 For locally advanced cancers (stage IIIA and IIIB), surgery, radiation therapy, and chemotherapy all have a role. For patients whose tumors are inoperable, either because their tumors are too extensive to allow for safe resection or because they are medically unfit for surgery, primary radiation therapy with concurrent chemotherapy is used.3
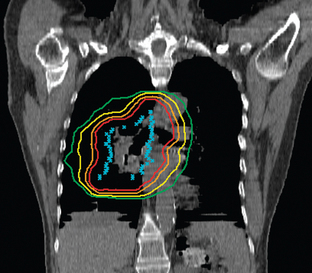
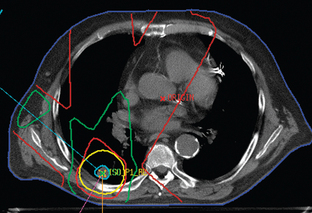
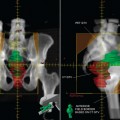
The treatment of inoperable lung cancer with radiation therapy remains a challenge. When conventional doses (60–65 Gy) are used, local control is poor. One study that used stringent follow-up reported a local control rate of 15% at 1 year.4 Dose escalation to doses as high as over 100 Gy has been attempted to improve local control.5–8 Increasing doses this high is not feasible using conventional radiation therapy methods. The technique of three-dimensional conformal radiation therapy (3D-CRT) was developed to safely treat tumors at these higher doses. 3D-CRT uses high-resolution CT scans to accumulate precise anatomic data and build a computerized 3D image of the patient’s normal structures and tumor. The optimal radiation beam parameters and orientation are selected by objectively comparing candidate plans using calculations and visual displays. This approach has the potential to maximize the delivery of the prescribed dose to target volumes while reducing exposure to normal structures.9 Figures 8-1 and 8-2 show examples of 3D-CRT plans.
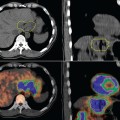
One limitation of 3D-CRT is that it uses only CT data to delineate the target volume. CT has limited sensitivity and specificity in accurately determining tumor.10,11 Fluorine-18 (18F)-fluoro-deoxy-D-glucose positron emission tomography (FDG-PET) has been shown to be an invaluable tool in the initial staging of NSCLC, assessment of response to treatment, and surveillance of tumor recurrence. Recently, the development of integrated PET-CT scanning, which provides co-registered FDG-PET and CT images, has made it possible to acquire both anatomic and functional images of the whole patient in one single procedure.
The role of PET-CT in the setting of radiotherapy for NSCLC starts with disease staging and patient selection. PET-CT has been shown to have a higher diagnostic accuracy than either CT or PET alone, with a reported sensitivity of 89%, specificity of 94% and overall diagnostic accuracy of 93%.12 Patients who are candidates for definitive therapy, with either surgery or chemoradiotherapy may be found to have metastatic disease and may therefore be managed with palliative intent.13–17
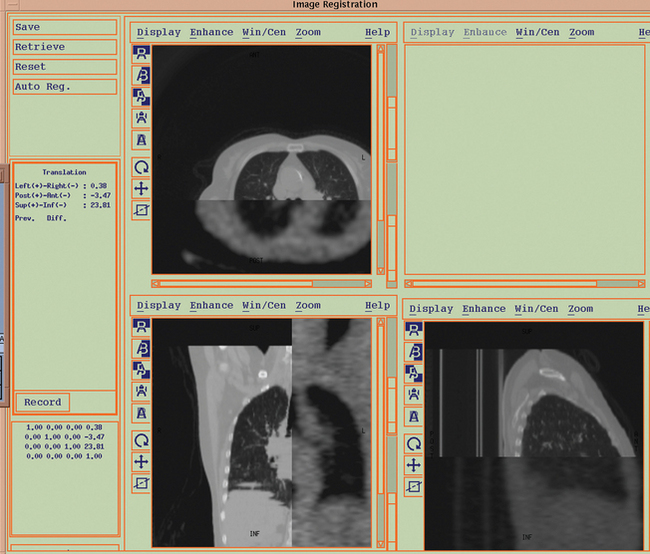
The advent of PET-CT has opened new exciting possibilities for target volume definition in patients with NSCLC, since PET scans can be registered with radiation therapy treatment planning scans to create a fused image set (Figure 8-3). While PET-CT imaging is rapidly being embraced by the radiation oncology community as a means to accurately define the target volume for treatment optimization in NSCLC, there are still a number of technical and clinical issues to be addressed. These include tumor edge definition, spatial resolution of PET, and misregistration due to target motion. From a clinical standpoint, the open questions are essentially the following: to what extent does PET-CT change the target volume for both primary and nodal areas and is PET-CT able to reduce interobserver variability in target volume delineation?
Tumor Edge Definition
An area of controversy surrounding PET-CT planning pertains to the modality with which the PET-defined contours should be obtained. Reliable use of PET information in gross tumor volume (GTV) delineation requires a clearly established methodology. Tumor edge has been primarily based on the standardized uptake value (SUV), either in the form of a threshold value (a percentage of SUVmax) or as an absolute SUV. Ideally, criteria for defining SUV thresholds or absolute SUV for contouring require correlation between PET data and pathologic specimens, which is likely not feasible in NSCLC, where accurate spatial correlation of excised surgical specimens with imaging is difficult to achieve. The proof of an SUV-based magic line where viable tumor burden ceases to exist and normal tissue begins may be impossible to obtain.
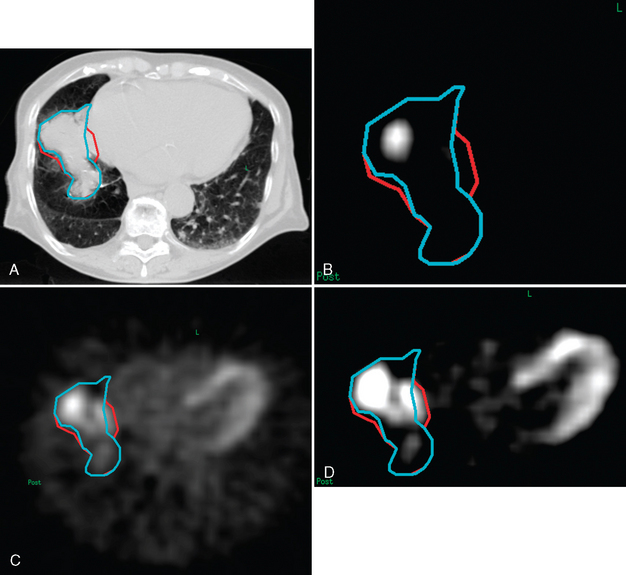
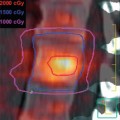
In the published literature, the mainstream trend is to define the tumor boundary as the region encompassed by an arbitrary threshold value relative to the maximum intensity within the FDG-avid area (e.g., 40%,15 42%,18 or 50%13,19). Figure 8-4 shows an example of how the window level of the FDG-PET scan can vastly affect the volume of the GTV. It is not clear whether this widespread use of an arbitrarily set value would give a more accurate outcome than other methods. For instance, the 40% intensity level has been considered inappropriate by one study.20 Undoubtedly, its use may give an impression of objectivity. In practice, however, the final outcome will be overruled by physician interpretation of the PET images, when other factors, other than the presence of tumor itself, are considered to be causing the uptake. Additionally, motion may be another cause of uncertainty. Gating or breath-hold techniques may overcome this problem at the expense of treatment time. It is also important to note that these techniques do not account for target motion due to cardiac activity, which may be relevant in some centrally located primaries. Clearly, a class solution may be particularly difficult to find.
In an effort to define the most appropriate method for target delineation using PET information, Nestle and colleagues compared four different methods of determining GTV in 25 patients with NSCLC. The four methods were: (1) visual (GTVvis); (2) using 40% of the maximum SUV (GTV40); (3) using an isocontour of SUV = 2.5 around the tumor (GTV2.5); and (4) using a best fit algorithm comparing PET with CT volumes using tumor and background intensities on the treatment planning system (GTVbg). All these methods were compared to a clearly defined GTV seen on CT (GTVCT). All four methods yielded substantially different tumor volumes, with GTV40 having a mean volume of 53.6 mL, GTVbg 94.7 mL, GTVvis 157.7 mL, and GTV2.5 164.6 mL. These authors reported that in inhomogeneous lesions, GTV40 led to visually inadequate tumor coverage in 3 of 8 patients, whereas GTVbg led to intermediate, more satisfactory volumes. Visual definition and the application of an isocontour of SUV 2.5 produced similar results. Overall, GTVvis, GTV2.5, and GTVbg correlated well with the GTVCT, whereas the GTV40 did not, likely due to blurring consequent to motion.21
The unique relationship between the threshold and the mean target SUV to define the primary tumor edge is difficult to standardize because of the often highly heterogeneous distribution of FDG-uptake within the tumor mass. Based on phantom studies, Black and colleagues described the feasibility of a regressive function and tes-ted it on real NSCLC cases. According to the results of this study, a PET-based GTV may be systematically defined using the regressive function, yielding a unique result that eliminates inter- and intraobser-ver variability.22
In a recent editorial, Paulino and Johnstone have suggested using an SUV value of 2.5 to autocontour the PET-derived GTV. Using a predefined SUV value, however, may result in the exclusion of small positive nodes from the target volume because of a low SUV due to partial volume effect. Additionally, some well-differentiated lung tumors have low intrinsic SUV whereas some inflammatory processes may have SUV levels in excess of 2.5.23
In an effort to find a consistent method for treatment volume delineation using PET-CT, Ahsamalla and colleagues have recommended using an anatomic biologic contour (ABC), instead of traditional GTV contouring methods. A prospective study of 19 patients with stage II-IIIB disease was done using this method. The patients were simulated for 3D-CRT using CT vs. PET-CT fusion and the degree of correlation between CT-based planning vs. PET-CT planning was assessed. The study assessed the magnitude of interobserver variability in volume definition with the use of PET-CT images. The GTV-CT and PTV-CT were compared with GTV and PTV found by using ABC directly from the PET-CT images. PTV was defined as GTV plus a 1.5-cm margin. The results of this study found that the GTV was modified > 25% in 52% (10/19) of the patients, half of whom had an increase in GTV and the other half a decrease in GTV. This GTV change resulted in a > 20% change in PTV in 42% (8/19) of the patients. The study also found that tumor volume definition on PET-CT images could be delineated by a “halo” that corresponded to an area of maximal SUV correlating to about an SUV of 2 ± 0.4. Interobserver concordance improved with the use of PET-CT from 37% concordance with CT alone vs. 84% concordance with use of PET-CT images for treatment planning.24
Spatial Resolution
The current spatial resolution of the CT component (in the order of 1 mm) is far superior to that of the PET component (approximately 6 mm), so that extra gain in target delineation accuracy may not be so large. In fact, the limited spatial resolution of PET contributes to image blur and is closely linked to the issue of tumor edge definition. Although technical advances in PET detector design are likely to improve image resolution to about 3 mm, the influence of inherent tissue factors such as cell density, may not be overcome by technical advances.25
Another issue to be accounted for with regard to PET spatial resolution is the range of positron in different tissue types.26 Investigations performed with Monte Carlo simulation have shown that the typical range for an 18F positron would be approximately 1.5 mm in lung and 0.5 mm in soft tissue. This value, of course, does not degrade spatial resolution of PET in the current setting but may become a problem when higher resolution PET detectors are developed. It is of interest to note that one isotope of potential interest in PET for NSCLC is 15-oxygen, which has a higher positron energy and an estimated range in lung of 5.3 mm.
Misregistration Due to Target Motion
As PET acquisition takes several minutes, it is performed during free breathing. Tumor motion due to respiratory movements and cardiac action, therefore, may result in significant image blur. As such, PET scans correlate best with slow CT acquisition procedures that incorporate all patient mobility. This approach would result in a larger GTV, and makes the use of PET-CT simulation lose some of its appeal. However, feasible methods to correct for respiratory motion, such as respiratory gated image acquisition or image reconstruction in a specific phase of the breathing cycle motion, have been developed and are currently being clinically tested.27
PET-CT Changes in Target Volume Delineation
Despite several technological advances that have led to more conformal 3D-treatment plans and the ability to dose escalate, there still remains a major unresolved clinical issue in the treatment of NSCLC with radiation: the uncertainty of the target volume.28,29
There are three ways to combine PET and CT imaging for diagnostic and treatment planning purposes: visual fusion, software fusion (usually of two separate studies), and hardware fusion.30
Stay updated, free articles. Join our Telegram channel

Full access? Get Clinical Tree


