Nontraumatic Intracranial Emergencies
Benjamin Y. Huang
Mauricio Castillo
GENERAL CONSIDERATIONS
The list of nontraumatic intracranial processes that commonly present on an emergent basis encompasses a wide range of pathologies, which, although disparate etiologically, often present with very similar symptoms and signs that include headaches, seizures, dizziness, alterations in mental status, or focal neurologic deficits. For these reasons, accurate diagnosis of specific intracranial abnormalities on purely clinical grounds is frequently impossible. Imaging therefore plays a crucial role in the workup and triage of patients with suspected central nervous system (CNS) pathology. In most cases, unenhanced head computed tomography (CT) is the initial imaging test of choice because of its widespread availability and its ability to reliably rule out most gross pathology such as hemorrhage or large mass lesions. Additional studies such as contrast-enhanced CT, CT angiography (CTA), or magnetic resonance imaging (MRI) largely play an ancillary role in the emergency room setting and are generally reserved for cases in which (1) an abnormality is identified on unenhanced CT that requires further characterization, or (2) intracranial pathology is still suspected despite a negative head CT.
In this chapter, we review the radiologic evaluation of nontraumatic intracranial processes that commonly present as neurologic emergencies. From an organizational standpoint, these entities are grouped in this chapter into general categories, including (1) vascular emergencies, (2) hydrocephalus and associated conditions, (3) CNS infections, and (4) miscellaneous processes including toxic exposures and pituitary apoplexy.
VASCULAR EMERGENCIES
Vascular emergencies affecting the brain can be divided into those caused by aberrations in brain perfusion, which primarily result in edema (e.g., ischemic infarctions, spontaneous arterial dissections, venous thrombosis, posterior reversible encephalopathy) and those manifesting primarily with intracranial hemorrhage (ICH) (e.g., hypertensive bleeds, ruptured aneurysms, or vascular malformations). In some cases, such as in hemorrhagic venous infarcts or hemorrhagic transformation of ischemic infarctions, both processes occur, but in these instances the primary pathologic mechanism is vessel occlusion; therefore, these entities are discussed in the category of primarily nonhemorrhagic vascular diseases.
Predominantly Nonhemorrhagic Vascular Disorders
Ischemic Infarctions
After ischemic heart disease and cancer, stroke is the third leading cause of death in the United States. Roughly 80% to 87% of clinically evident acute strokes are caused by cerebral ischemia, with the remainder being caused by ICHs. Acute strokes
typically manifest with sudden onset of a focal neurologic deficit, although some patients may experience a more gradual or stepwise progression of symptoms. Specific neurologic deficits caused by stroke depend on the vascular territory affected. Anterior circulation strokes commonly present with symptoms such as unilateral weakness or sensory loss, aphasia, dysarthria, and neglect. Patients with anterior circulation infarcts usually demonstrate normal or only slightly impaired consciousness. Posterior circulation infarcts, which account for approximately 20% of ischemic events, may cause dizziness, vertigo, headache, vomiting, ataxia, bilateral weakness, or hemianopia.
typically manifest with sudden onset of a focal neurologic deficit, although some patients may experience a more gradual or stepwise progression of symptoms. Specific neurologic deficits caused by stroke depend on the vascular territory affected. Anterior circulation strokes commonly present with symptoms such as unilateral weakness or sensory loss, aphasia, dysarthria, and neglect. Patients with anterior circulation infarcts usually demonstrate normal or only slightly impaired consciousness. Posterior circulation infarcts, which account for approximately 20% of ischemic events, may cause dizziness, vertigo, headache, vomiting, ataxia, bilateral weakness, or hemianopia.
With the widespread availability of intravenous (IV) thrombolytics, rapid diagnosis is now critical to optimize outcomes in patients with acute ischemic stroke. The landmark 1995 National Institute of Neurological Disorders and Stroke tissue plasminogen activator (NINDS-tPA) trial demonstrated that patients receiving IV tPA within 3 hours of stroke onset were 30% more likely to have little or no disability at 3 months than patients receiving placebo. The subsequent European Cooperative Acute Stroke Study III (ECASS III) trial showed that clinical outcomes are also improved in patients receiving IV tPA up to 4.5 hours after stroke onset, but, generally speaking, there is a gradually diminishing benefit with increasing time from ictus. Intra-arterial recanalization techniques, including direct intra-arterial thrombolysis and use of mechanical clot retrieval devices, are also becoming more widely available and are generally considered for patients presenting outside of the effective window for IV thrombolysis up to 6 hours from the onset of stroke symptoms and in some cases beyond.
All patients with suspected acute ischemic cerebral infarctions in whom recanalization therapy is being considered should undergo emergent cross-sectional brain imaging. The primary goals of imaging in the acute setting are (1) to identify the presence of hemorrhage, (2) to identify a large vessel occlusion, and (3) to assess the volume of irreversibly injured brain tissue. Secondarily, imaging may also be performed to estimate the presence of a clinically relevant ischemic penumbra.
Computed Tomography in Acute Stroke
In clinical practice, unenhanced CT is usually the first imaging study performed in patients presenting with acute stroke symptoms given its speed and widespread availability. Within the first 6 hours of an ischemic stroke (the hyperacute stage), CT will demonstrate an abnormality in approximately 50% to 80% of patients. Early CT findings of ischemic infarctions include a hyperdense artery, parenchymal hypodensity, local brain swelling, or loss of gray-white differentiation. Because these findings can be extremely subtle when viewed with traditional brain CT windows, viewing the CT images with narrow “stroke windows” (W = 30, L = 30) often increases the conspicuity of these findings (Fig. 3.1). Although the sensitivity of CT is relatively low, its primary utility in the acute setting is to identify findings that would preclude initiation of thrombolytic therapy—specifically, acute hemorrhage (for which CT is quite sensitive) or significant parenchymal hypodensity indicating irreversible tissue injury (usually defined as hypodensity involving >1/3 of the middle cerebral territory).
Magnetic Resonance Imaging in Acute Stroke
Magnetic resonance (MR) diffusion weighted imaging (DWI) is the most sensitive imaging technique for diagnosing ischemic infarcts, identifying 88% to 100% of infarcts in the hyperacute setting. DWI signal alterations usually become apparent in infarcting tissue within 30 minutes of arterial occlusion. This is in contradistinction to conventional MR sequences (T1-weighted, T2-weighted, and fluid attenuation inversion recovery [FLAIR]), which, like CT, may miss a substantial proportion of hyperacute infarcts. Ischemic infarcts demonstrate high-signal intensity on DWI, reflecting restriction of the random motion or diffusion of extracellular water molecules caused by cell swelling and subsequent reduction in the volume of the extracellular space. When one is interpreting DWI, it is important to keep in mind that the signal characteristics displayed on the trace image reflect a combination of both T2 and diffusion effects. Therefore, DWI image sets should always be viewed in conjunction with their corresponding apparent diffusion coefficient (ADC) maps to exclude the phenomenon of “T2 shine through,” which refers to the phenomenon in which tissues with a long T2 but normal or increased diffusion appear hyperintense on DWI. Infarcted tissues with truly decreased diffusion will demonstrate decreased signal intensity on the ADC map in addition to high-signal intensity on
the DWI sequence (Fig. 3.2), whereas tissues demonstrating T2 shine through will appear isointense or hyperintense on the ADC map.
the DWI sequence (Fig. 3.2), whereas tissues demonstrating T2 shine through will appear isointense or hyperintense on the ADC map.
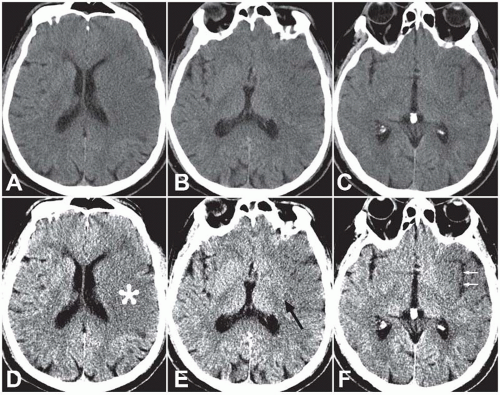 Figure 3.1. Comparison of different CT windows in acute stroke. A to C: Multiple CT images through the head displayed in standard brain windows (W = 80, L = 40) in a patient with an acute left MCA territory infarct. D to F: The same levels displayed using narrow “stroke” windows (W = 30, L = 30). The infarcted region (asterisk in D) is more easily seen with stroke windows and demonstrates hypodensity, sulcal effacement, and loss of normal gray-white differentiation. Effacement of the basal ganglia (black arrow in E) and loss of the normally dense insular ribbon (small white arrows in F) are also more conspicuous using the narrower window settings. |
Conventional MR images usually become abnormal around 3 to 6 hours after stroke onset. On FLAIR and T2-weighted images (T2WIs), infarcts demonstrate increased tissue swelling and high-signal intensity edema (Fig. 3.2). Replacement of normal arterial flow voids with high-signal intensity in the occluded vessels is another early sign. Unenhanced T1-weighted images (T1WIs) are usually normal in early ischemic strokes but may demonstrate subtle blurring of gray-white interfaces. Contrast-enhanced T1WI may demonstrate arterial enhancement within 2 to 4 hours (Fig. 3.3) secondary to slow flow, collateral flow, or hyperperfusion following early recanalization.
Computed Tomography Angiography and Magnetic Resonance Angiography
Noninvasive angiographic imaging with CTA or MR angiography (MRA) is frequently undertaken in patients with acute ischemic strokes to identify and characterize large vessel occlusions and to assess the degree of collateral flow to at risk territories. This information is helpful for prognosis and may be useful in acute treatment planning, as recent studies have suggested that patients presenting with
large vessel occlusions on CTA have poorer overall outcomes and may benefit more from intra-arterial thrombolysis than IV thrombolysis. The choice of technique (CT vs MR) primarily depends on institutional preference. With both modalities, images are frequently displayed as three-dimensional surface shaded or maximum intensity projection (MIP) reconstructions, which are similar to traditional digital subtraction angiographic (DSA) images (Fig. 3.4).
large vessel occlusions on CTA have poorer overall outcomes and may benefit more from intra-arterial thrombolysis than IV thrombolysis. The choice of technique (CT vs MR) primarily depends on institutional preference. With both modalities, images are frequently displayed as three-dimensional surface shaded or maximum intensity projection (MIP) reconstructions, which are similar to traditional digital subtraction angiographic (DSA) images (Fig. 3.4).
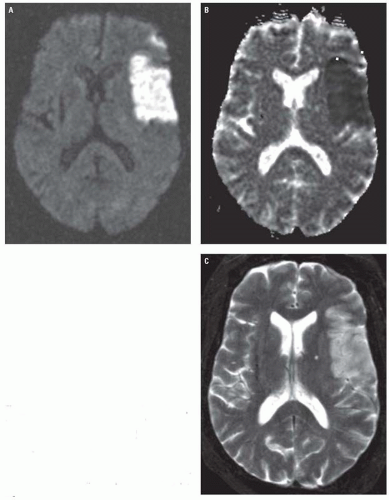 Figure 3.2. Acute stroke on MRI. A: Axial DWI image in a patient with an acute stroke demonstrates a confluent region of high-signal intensity in the right frontal lobe, corresponding to a portion of the right MCA territory. B: This region shows low-signal intensity on the corresponding ADC reflecting restricted diffusion. C: T2WI at the same level demonstrates tissue swelling and high-signal intensity in the infarcted region. |
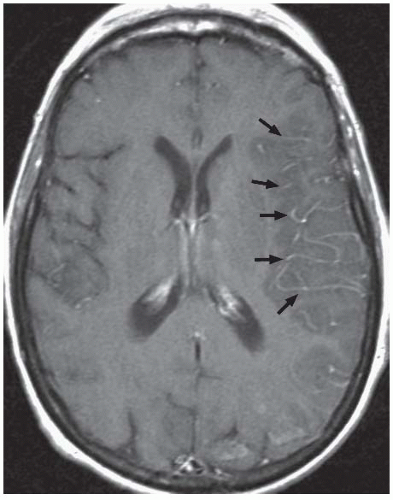 Figure 3.3. Acute stroke on MRI. Axial post-contrast T1WI shows abnormal intravascular enhancement in the left Sylvian region (arrows) in a patient with an acute left MCA infarction. |
Extracranial imaging is also commonly performed to identify potentially thrombotic or embolic causes of stroke, including atherosclerotic plaques and arterial dissections. Overall, the diagnostic performance for CTA and MRA for detecting cervical arterial stenoses and dissections is probably comparable. MRA and MRI are particularly useful for identifying acute carotid dissections, which can present with strokes or ipsilateral Horner’s syndrome. Fat-suppressed, unenhanced axial T1WI or T2WI through the neck should be obtained in cases of suspected dissection and classically demonstrate an eccentric crescent of high-signal intensity thrombus along the wall of the dissected vessel (the so-called crescent sign) (Fig. 3.5). MRA is useful for depicting length of vessel involvement. Although the sensitivity of the MR crescent sign for carotid dissections is quite high (>90%), its sensitivity is considerably lower for vertebral artery dissections (<60%). In the latter setting, CTA may be the better noninvasive option. CTA findings of arterial dissection include vessel wall irregularity, presence of an intimal flap or pseudoaneurysms, and vessel wall thickening.
 Figure 3.4. Acute MCA occlusion on CTA. Three-dimensional surface shaded reconstruction of a CTA of the head demonstrates abrupt cutoff of the left MCA (arrow) in a patient with an acute infarct. |
Computed Tomography and Magnetic Resonance Perfusion Imaging
There has been increasing interest recently in the use of CT and/or MR perfusion imaging to better select stroke patients for potential revascularization therapy, particularly in instances in which the time from ictus to presentation is unknown or falls outside of the currently accepted windows for attempted reperfusion. Ischemic strokes are the result of severe reductions in blood flow to the brain, with areas severely deprived of blood flow (lower than 12 mL/100 g tissue) undergoing cell death within minutes. This infarct core is what is represented as the area of reduced diffusion on DWI and to a lesser degree as the area of visible hypoattenuation on CT. In the acute stage of ischemic infarctions, there may be a peripheral zone of impaired but viable tissue that is supported by collateral circulation referred to as the “ischemic penumbra,” which contains cells that theoretically may be salvaged with prompt reperfusion. The penumbra can be estimated using physiologic perfusion maps that can be obtained either with CT or MR perfusion imaging. The penumbra is represented by the area of mismatch observed between the volume of hypoperfused tissue on perfusion maps (typically the cerebral blood flow or time-to-peak maps) and the volume of the infarct core (as assessed on DWI or unenhanced CT) (Fig. 3.6).
Existing data on outcomes for stroke patients triaged to delayed thrombolysis on the basis of CT or
MR perfusion mismatches are conflicting because some studies suggest a potential benefit, whereas others report no benefit. Delayed thrombolysis appears to be associated with increased rates of recanalization, but has not been shown definitively to be associated with improved patient outcomes. Therefore, perfusion weighted imaging currently remains an investigational tool in acute stroke patients.
MR perfusion mismatches are conflicting because some studies suggest a potential benefit, whereas others report no benefit. Delayed thrombolysis appears to be associated with increased rates of recanalization, but has not been shown definitively to be associated with improved patient outcomes. Therefore, perfusion weighted imaging currently remains an investigational tool in acute stroke patients.
 Figure 3.5. Carotid dissection. A: Axial fat-suppressed T2WI in a patient with right-sided Horner’s syndrome demonstrates an eccentric crescent of high signal along the medial wall of the right ICA (arrowhead), consistent with intramural thrombus. B: The corresponding MRA of the circle of Willis demonstrates narrowing and irregularity of the distal petrous segment of the ICA (arrows). |
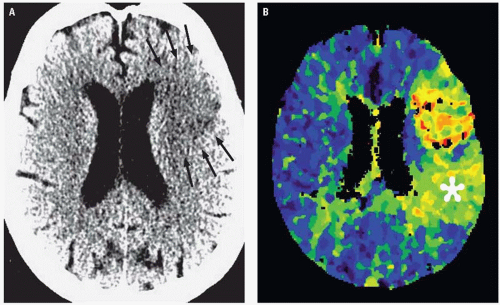 Figure 3.6. Perfusion mismatch in acute stroke. A: Unenhanced CT image demonstrates hypodensity in the left MCA territory (arrows) compatible with an acute infarct. The hypodense region represents the infarct core. B: Time-to-peak map from a CT perfusion study demonstrates a perfusion mismatch with viable but hypoperfused tissue, primarily displayed in green (asterisk), posterior to the infarct core. |
Specific Ischemic Stroke Patterns
Middle Cerebral Artery Infarctions
More than half of ischemic cerebral infarctions involve the middle cerebral artery (MCA) territory. Early CT findings of an MCA infarction include hyperdensity of the MCA trunk or its branches (Fig. 3.7) and parenchymal hypodensity, local brain swelling, or loss of gray-white differentiation in the territory supplied by the MCA. Effacement of the normally slightly hyperdense basal ganglia (the “disappearing basal ganglia” sign) or insular cortex (the “insular ribbon” sign) are subtle findings suggestive of an acute MCA infarction (Fig. 3.1).
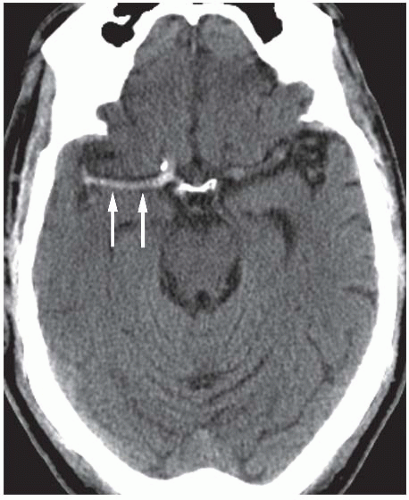 Figure 3.7. The dense MCA sign. Axial unenhanced CT demonstrates an asymmetric hyperdense right MCA, reflecting the presence of acute intravascular clot. |
Anterior Cerebral Artery Infarctions
Infarctions of the anterior cerebral artery (ACA) territory account for up to 5% of ischemic strokes. They are often seen in combination with MCA infarctions, and isolated ACA infarctions are uncommon. Unlike MCA infarctions, most ACA strokes result from primary vessel disease (e.g., atherosclerosis, vasculitis, or vasospasm related to aneurysmal subarachnoid hemorrhage [SAH]) rather than an emboli. ACA infarcts may also occur as a result of subfalcine herniation as the ACA becomes compressed under the falx cerebri. On unenhanced CT, ACA infarctions appear as hypodensities involving the medial aspect of the superior frontal and parietal lobes adjacent to the falx, whereas MRI will demonstrate restricted diffusion and T2 shortening in these regions (Fig. 3.8). A hyperdense ACA may also be observed in some cases, indicating acute thrombus within the vessel (Fig. 3.9).
Posterior Circulation Infarctions
Posterior circulation strokes are caused by obstruction of the vertebral, basilar, or posterior cerebral arteries (PCAs) and their branches and may involve the brainstem, the cerebellum, or the posterior portions of the cerebrum. They account for roughly 20% of ischemic infarctions. Of these, PCA infarctions account for roughly 30%. On imaging, isolated PCA infarctions classically involve the ipsilateral occipital lobe, medial and posterior temporal lobe, or the thalamus (Fig. 3.10).
Thrombosis of the basilar artery is a potentially catastrophic occurrence that carries a mortality rate of 80% to 90% if left untreated. Even with thrombolytic therapy, the survival rate of patients with basilar thrombosis only increases to approximately 50%. The clinical and imaging manifestations of basilar artery thrombosis can be quite variable and depend on the location and extent of thrombus and on the degree of collateral flow. In addition to feeding the PCAs and the anterior-inferior and superior cerebellar arteries, the basilar artery also gives off multiple perforators directly supplying the pons and midbrain. Complete thrombosis of the basilar artery therefore results in infarcts to all of the structures supplied by these vessels including the pons and midbrain, mid and upper cerebellum, thalami, and the posterior limbs of the internal capsules. Infarcts of the portions of the cerebrum supplied by the PCAs may also be present. Complete basilar occlusion is generally rapidly fatal and rarely goes on to imaging.
 Figure 3.8. Anterior cerebral artery infarctions. A: Axial unenhanced CT demonstrates a large right ACA infarct and a smaller left ACA infarct, which appear as hypodensities in medial aspects of the frontal and parietal lobes. B: An axial DWI image in a different patient demonstrates high-signal intensity in the right ACA territory. |
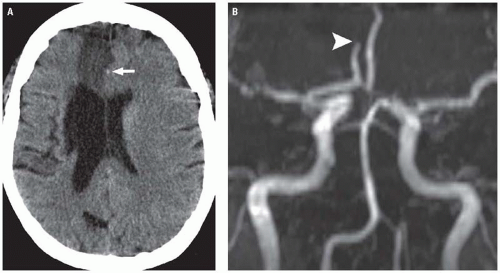 Figure 3.9. Anterior cerebral artery infarction. A: Axial unenhanced CT image demonstrates hypodensity in the right ACA territory compatible with an acute infarct. The right ACA is hyperdense (arrow) indicating the presence of thrombus. B: TOF-MRA demonstrates abrupt cutoff of the A2 segment of the right ACA (arrowhead). |
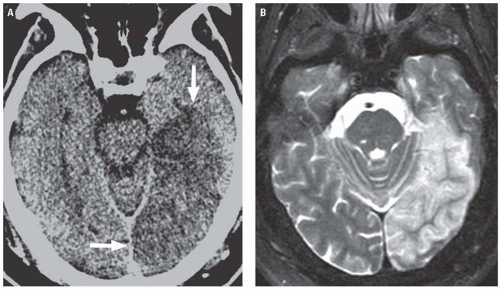 Figure 3.10. Posterior cerebral artery infarction. A: Unenhanced axial CT image demonstrates hypodensity within the left occipital lobe and medial left temporal lobe (arrows) in the territory of the left PCA. B: Axial T2WI in the same patient demonstrates gyral swelling and hyperintensity in the infarcted region. |
Patients with less extensive thromboses may present acutely or with a gradual or stuttering course. Imaging in these patients shows a more limited distribution of infarctions. Occlusion of the proximal and midportions of the basilar artery may result in a “locked in” state caused by infarction of the upper ventral pons. This syndrome is characterized by complete loss of voluntary movement, with the exception of vertical eye movement, and preserved consciousness (caused by sparing of the pontine tegmentum). Thrombosis involving only the distal basilar artery produces the “top-of-the-basilar” syndrome, with infarcts of the midbrain, thalami, and temporal and occipital lobes classically causing visual, oculomotor, and behavioral abnormalities, usually without significant motor dysfunction. Unlike more proximal basilar thromboses, which are usually the result of atherosclerotic disease, distal basilar thrombosis is usually caused by embolism.
On unenhanced CT, thrombus within the basilar artery may appear hyperdense (Fig. 3.11), and the appearance of a dense artery may precede the development of parenchymal hypodensity. As with infarcts of the anterior circulation, DWI is more sensitive
and better delineates the extent of infarction in the acute setting (Fig. 3.12). CTA and MRA both effectively demonstrate the location and extent of occlusion and may document potentially predisposing atherosclerotic changes.
and better delineates the extent of infarction in the acute setting (Fig. 3.12). CTA and MRA both effectively demonstrate the location and extent of occlusion and may document potentially predisposing atherosclerotic changes.
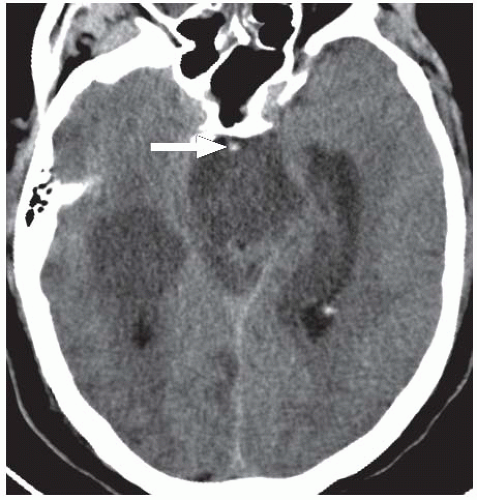 Figure 3.11. Basilar artery thrombosis. Unenhanced axial CT image demonstrates multiple hypodensities in the pons, cerebellum, medial temporal lobes, and right occipital lobe compatible with posterior circulation infarcts. The basilar artery is hyperdense, indicating intraluminal thrombus (arrow). |
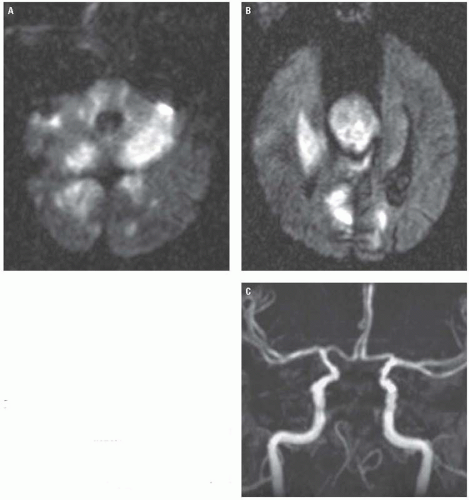 Figure 3.12. Basilar artery thrombosis. A and B: Axial DWI images at the level of the middle cerebellar peduncles (A) and hippocampi (B) demonstrate multiple foci of high-signal intensity in the brainstem, cerebellum, and bilateral temporal and occipital lobes, reflecting acute posterior circulation infarctions. C: TOF-MRA demonstrates absent flow within the basilar artery and its branches. |
Watershed Infarcts
“Watershed” infarctions occur in the boundary zones between major arterial territories and account for approximately 10% of ischemic strokes. The pathogenesis of these infarcts is debated, but it is likely that they involve multiple factors including systemic hypotension, arterial stenosis or occlusion, and microembolization. Hypoperfusion in combination with severe occlusive disease of the internal carotid arteries (ICA) can cause both embolization and decreased brain perfusion, which is most pronounced at the arterial border zones. Decreased perfusion may, in turn, alter blood flow currents, encouraging microemboli to lodge in these watershed areas.
Like other ischemic infarcts, acute watershed infarcts are hypodense on CT and demonstrate high-signal intensity on DWI, T2-weighted, and FLAIR sequences. Anterior watershed infarctions between the ACA and MCA territories manifest as multiple ischemic lesions involving a linear strip of frontal
cortex on the superior convexity close to the interhemispheric fissure ( referred to as the external or cortical watershed region) as well as the white matter along and slightly above the lateral ventricle, including portions of the corona radiata between the territories of the deep and superficial perforators of the MCA and the centrum semiovale between the superficial perforators of the ACA and MCA (known as the internal watershed region) (Fig. 3.13). Posterior watershed infarcts develop between the ACA, MCA, and PCA territories and affect a parieto-temporo-occipital wedge of tissue extending from the occipital horn of the lateral ventricle to the parieto-occipital cortex (Fig. 3.13). The infarcts may be unilateral or bilateral.
cortex on the superior convexity close to the interhemispheric fissure ( referred to as the external or cortical watershed region) as well as the white matter along and slightly above the lateral ventricle, including portions of the corona radiata between the territories of the deep and superficial perforators of the MCA and the centrum semiovale between the superficial perforators of the ACA and MCA (known as the internal watershed region) (Fig. 3.13). Posterior watershed infarcts develop between the ACA, MCA, and PCA territories and affect a parieto-temporo-occipital wedge of tissue extending from the occipital horn of the lateral ventricle to the parieto-occipital cortex (Fig. 3.13). The infarcts may be unilateral or bilateral.
 Figure 3.13. Watershed infarctions. A: Axial FLAIR image demonstrates wedge-shaped areas of cortical hyperintensity in the left frontal and parietal lobes (arrowheads) and foci of deep white hyperintensity in a parasagittal distribution (arrows), corresponding to the external and internal watershed regions. B: These areas show restricted diffusion on the DWI image indicating they represent acute infarcts. |
Identification of a watershed pattern of infarctions by imaging should prompt one to perform vascular imaging of the intracranial and extracranial vascular imaging with Doppler ultrasound, CTA, or MRA to rule out the presence of contributory arterial occlusions or flow limiting stenoses.
Lacunar Infarcts
Lacunar infarcts account for 20% to 25% of all strokes and most often occur in patients with a long-standing history of diabetes mellitus or hypertension. They are usually caused by occlusion of small penetrating arteries and, as a result, are typically small (≤1.5 cm) and associated with little or no mass effect or edema. They most frequently occur in the basal ganglia, thalami, internal capsule, pons, and centrum semiovale. Symptoms related to lacunar infarcts can be quite variable depending on their location, and most are clinically silent. Despite the prevailing belief that most lacunar infarcts are caused by small vessel thrombosis, the NINDS-tPA trial showed that patients with lacunar infarcts are just as likely to benefit within the 3-hour IV thrombolysis window as patients with other ischemic stroke subtypes. Therefore, identification of a lacunar infarct on imaging does not preclude the initiation of IV tPA.
Acute lacunar infarcts are often difficult to appreciate on unenhanced CT. They frequently occur in the background of more extensive white matter disease or may be difficult to distinguish from enlarged perivascular spaces. When visible on CT, they appear as small, round or ovoid hypodensities within one of the characteristic locations listed earlier (Fig. 3.14). As with other ischemic infarcts, acute lacunar infarcts are most easily detected on DWI, which has a reported accuracy of approximately
95% and will demonstrate a small, isolated focus of restricted diffusion in a characteristic location (Fig. 3.14). Acute lacunar infarcts may be difficult to distinguish from chronic lacunes on conventional MR sequences, particularly in patients with underlying chronic small vessel disease.
95% and will demonstrate a small, isolated focus of restricted diffusion in a characteristic location (Fig. 3.14). Acute lacunar infarcts may be difficult to distinguish from chronic lacunes on conventional MR sequences, particularly in patients with underlying chronic small vessel disease.
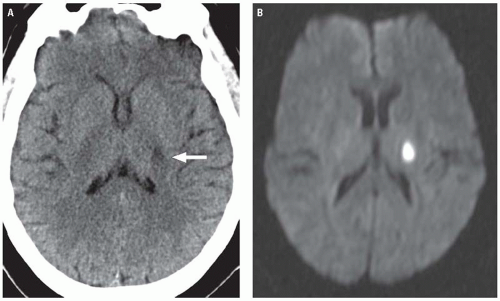 Figure 3.14. Acute lacunar infarct. A: Axial unenhanced CT image demonstrates an ovoid area of hypodensity centered in the posterior limb of the left internal capsule. B: A corresponding DWI image demonstrates high-signal intensity, reflecting restricted diffusion in an acute lacunar infarct. |
Hypoxic-Ischemic Brain Injury
Hypoxic-ischemic encephalopathy (HIE) is characterized by diffuse ischemic brain injury caused by global hypoperfusion or a severe disturbance in blood oxygenation. In children, HIE is commonly the result of drowning, choking, accidental asphyxiation, or non-accidental trauma, whereas in adults, HIE is usually a consequence of cardiac arrest or cerebrovascular disease in combination with severe or prolonged hypotension. Two basic and often overlapping patterns of brain injury are seen in patients with HIE: (1) hemodynamic (watershed) infarcts at the confluences of the MCA, PCA, and ACA territories, which are usually the result of mild to moderate hypoxic-ischemic events; and (2) generalized cortical and deep gray matter injury, which is generally caused by severe anoxic insults. Because imaging of watershed infarcts was discussed earlier, here we shall focus primarily on the latter pattern of injury.
Gray matter structures preferentially involved in severe cases of HIE include the basal ganglia, thalami, cerebral cortex (with a predilection for the sensorimotor and visual cortices), cerebellum, and hippocampi. Although MRI is better for evaluating the extent of injury in patients with HIE, CT is usually the first study ordered in the emergency department setting. Findings of severe HIE on CT include diffuse cerebral edema causing effacement of the cerebrospinal fluid (CSF)-containing spaces, decreased cortical gray matter density with loss of normal gray-white differentiation, and decreased density in the bilateral basal ganglia (Fig. 3.15). A minority of patients may demonstrate the so-called reversal sign in which there is reversal in the normal CT densities of gray and white matter with white matter being of higher density than the cortical gray matter. Another well-described but relatively insensitive CT sign of severe HIE is the “white cerebellum” sign, in which the cerebellum and brainstem demonstrate apparent high attenuation because of the development of diffuse cerebral edema (Fig. 3.16).
DWI is extremely sensitive for HIE and demonstrates restricted diffusion in injured structures, usually evident within minutes of the anoxic event and lasting for approximately 1 week (Fig. 3.17).
Conventional T1WI and T2WI are usually normal or show only subtle changes in the first 24 hours. After 24 hours, cortical swelling and blurring of gray-white interfaces become apparent on conventional MR sequences.
Conventional T1WI and T2WI are usually normal or show only subtle changes in the first 24 hours. After 24 hours, cortical swelling and blurring of gray-white interfaces become apparent on conventional MR sequences.
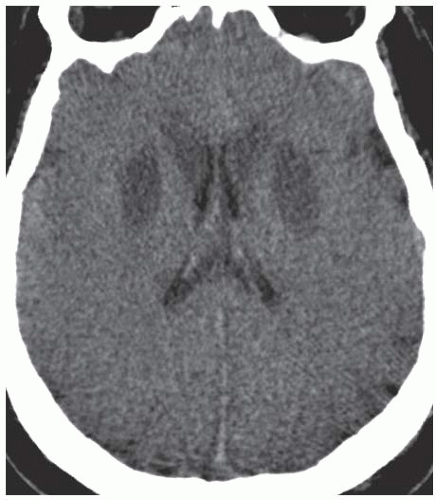 Figure 3.15. Hypoxic ischemic encephalopathy. Unenhanced axial CT image demonstrates symmetric basal ganglia hypodensity and diffuse cerebral edema with complete loss of gray-white differentiation. |
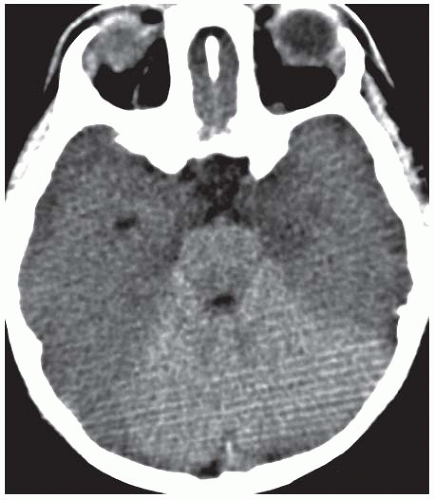 Figure 3.16. The “white cerebellum” sign. Unenhanced axial head CT in a child who suffered a severe hypoxic-ischemic insult demonstrates higher attenuation in the brainstem and cerebellum relative the cerebral hemispheres. |
 Figure 3.17. Hypoxic-ischemic encephalopathy. A: Axial DWI image demonstrates diffusely increased signal intensity in the basal ganglia, thalami, and cerebral cortex, reflecting diffusely reduced gray matter diffusion. B: The corresponding T2WI demonstrates diffusely increased gray matter signal intensity and swelling. |
In approximately 2% to 3% of cases, patients with a global hypoxic-ischemic insult may experience a syndrome of delayed white matter injury. This syndrome, termed postanoxic leukoencephalopathy, is characterized by a period of relative clinical stability or even improvement followed by an acute neurologic decline, usually 2 to 3 weeks after the initial insult. Patients may demonstrate delirium, personality changes, intellectual impairment, movement disorders, or, rarely, seizures. In typical cases of postanoxic encephalopathy, conventional MR and DWI immediately following the causative insult fail to demonstrate significant cerebral white matter abnormalities, but MR performed during the period of delayed neurologic decline classically demonstrates symmetric, confluent cerebral white matter hyperintensity on T2-weighted and FLAIR sequences with corresponding restricted diffusion on DWI (Fig. 3.18). Approximately 75% of patients with postanoxic leukoencephalopathy go on to complete or near complete recovery over the next 6 to 12 months. In the remainder of patients, there may be residual dementia. Rarely, the condition may progress to paresis, a vegetative state, or death.
 Figure 3.18. Postanoxic leukoencephalopathy. Axial DWI image in a patient who presented with an acute neurologic decline weeks after a hypoxic event demonstrates symmetric confluent cerebral white matter hyperintensity, indicating reduced white matter diffusion. |
Posterior Reversible Encephalopathy Syndrome
Posterior reversible encephalopathy syndrome (PRES) is a clinicoradiologic entity characterized by a distinct pattern of typically reversible brain edema that primarily affects the parietal and occipital lobes. It frequently occurs in the setting of moderate-to-severe hypertension (seen 70% to 80% of patients with PRES) and was therefore previously referred to as hypertensive encephalopathy. Additional risk factors for PRES include eclampsia, renal disease, treatment with immunosuppressant therapies (especially cyclosporine A and tacrolimus) or high-dose multi-drug antineoplastic chemotherapies, solid organ or bone marrow transplantation, and certain autoimmune diseases including lupus. PRES can also occur in the setting of infection, sepsis, or shock. Women are affected more commonly than men.
Although the pathophysiology of PRES is not well understood, the prevailing theory is that severe hypertension overwhelms compensatory mechanisms regulating cerebral blood flow, ultimately resulting in vasodilatation and edema. More recently, it has been suggested that PRES may be caused by circulating toxic substances that induce endothelial injury, blood-brain barrier breakdown, and edema. Why PRES predominantly involves the posterior portions of the brain is also uncertain, but it has been hypothesized that the relatively limited sympathetic innervation of the posterior circulation reduces its ability to protect against marked increases in blood pressure compared to the anterior circulation.
Symptoms of PRES may develop acutely or over several days. Patients commonly present with headaches, visual disturbances, seizures, and/or alterations in mental status. Focal neurologic deficits such as paresis can also occasionally occur. With appropriate therapy, the prognosis for PRES is usually excellent, with most patients experiencing complete resolution of clinical and radiographic findings. Rarely, however, PRES may progress to irreversible ischemia and infarction.
The characteristic CT findings of PRES are bilateral—often symmetric—cortical and subcortical areas of low attenuation on CT, predominantly affecting the parietal and occipital lobes.
MR is much more sensitive for detecting PRES and shows high-signal intensity in these regions on T2-weighted and FLAIR images (Fig. 3.19). The affected areas usually do not demonstrate significant reductions in ADC on DWI. Diffusion abnormalities, when present, usually appear as small, patchy, or punctate areas within much larger areas of vasogenic edema. Although PRES classically affects the parietal and occipital lobes, involvement of other locations is not uncommon. Frontal lobe involvement is seen in roughly two-thirds of patients with PRES, and the basal ganglia, brainstem, cerebellum, and deep white matter may also be affected (Fig. 3.19).
MR is much more sensitive for detecting PRES and shows high-signal intensity in these regions on T2-weighted and FLAIR images (Fig. 3.19). The affected areas usually do not demonstrate significant reductions in ADC on DWI. Diffusion abnormalities, when present, usually appear as small, patchy, or punctate areas within much larger areas of vasogenic edema. Although PRES classically affects the parietal and occipital lobes, involvement of other locations is not uncommon. Frontal lobe involvement is seen in roughly two-thirds of patients with PRES, and the basal ganglia, brainstem, cerebellum, and deep white matter may also be affected (Fig. 3.19).
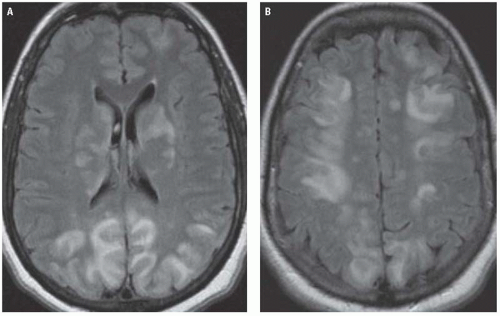 Figure 3.19. Posterior reversible encephalopathy syndrome. A: Axial FLAIR image through the lateral ventricles demonstrates symmetric cortical and subcortical high-signal intensity predominantly affecting the occipital lobes. Patchy signal abnormalities are also present in the basal ganglia. B: Axial FLAIR image superior to (A) demonstrates additional areas of involvement in the parietal and frontal lobes. |
MRA in cases of PRES frequently shows evidence of vasculopathy, demonstrated as vessel irregularity with alternating areas of vasoconstriction and vasodilatation. Like the areas of edema in PRES, these angiographic findings are usually reversible.
Venous Thrombosis and Venous Infarction
Cerebral venous thrombosis (CVT) accounts for up to 2% of adult strokes and an even higher proportion of strokes in younger patients. The diagnosis of CVT is often overlooked or delayed because the disorder can present with a wide range of complaints that often mimic other processes. Common signs and symptoms include headache, seizures, focal neurologic deficits, altered consciousness, and papilledema, which can present in isolation or in association with other symptoms. Predisposing conditions to the development of CVT include dehydration, genetic or acquired prothrombotic disorders, cancer, inflammatory bowel diseases, collagen vascular diseases, pregnancy and puerperium, and oral contraceptive use.
CVT is generally classified as involving the deep or superficial venous systems, and often both are simultaneously involved. The deep cerebral veins include the thalamic veins, thalamostriate veins, internal cerebral veins, basal veins of Rosenthal, vein of Galen, and the straight sinus. These veins are responsible for drainage of the thalami, basal ganglia, and deep white matter. Venous return from the small thalamic and thalamostriate veins is collected by the internal cerebral veins and basal veins of Rosenthal, which in turn drain into the vein of Galen. The vein of Galen then joins with the inferior
sagittal sinus to form the straight sinus, which communicates with the dural venous sinuses at the torcular Herophili. Occlusion of the deep venous system is seen in roughly 16% of patients with CVT.
sagittal sinus to form the straight sinus, which communicates with the dural venous sinuses at the torcular Herophili. Occlusion of the deep venous system is seen in roughly 16% of patients with CVT.
The superficial venous system is made up of the cortical veins of the cerebrum and the more superficially located dural venous sinuses, which include the superior sagittal sinus, transverse sinuses, and sigmoid sinuses. The superficial veins drain blood from the superficial surfaces of the cerebral hemispheres into the dural sinuses.
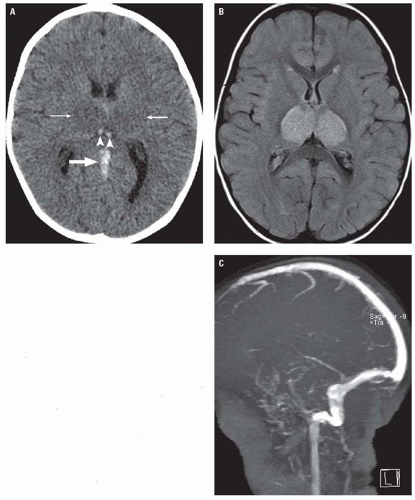 Figure 3.20. Deep cerebral venous thrombosis. A: Unenhanced axial CT image demonstrates symmetric thalamic hypodensity (small arrows). The straight sinus (large arrow) and internal cerebral veins (arrowheads) are hyperdense due to intraluminal thrombus. B: Axial FLAIR image in the same patient demonstrates swollen, hyperintense thalami. C: Lateral projection MIP image from a 2D TOF-MRV demonstrates absent flow-related enhancement in the deep venous system as well as in the right transverse and sigmoid sinuses, reflecting both deep and superficial venous thrombosis. |
Diagnosis of CVT relies on neuroimaging. CVT causes venous congestion and vasogenic edema, which varies in extent and distribution depending on the veins involved. Most patients demonstrate parenchymal abnormalities on imaging, manifesting as focal areas of edema with or without hemorrhage (often referred to as “venous infarctions”). Roughly, a third of patients with CVT will demonstrate hemorrhagic lesions. In cases of deep CVT, the characteristic finding is symmetric bilateral thalamic involvement (Fig. 3.20), which
may extend into the basal ganglia, midbrain, and adjacent deep white matter. Parenchymal lesions related to superficial CVT are usually cortical and subcortical, and their location depends on the specific veins that are occluded. Thrombosis of the superior sagittal sinus or veins normally draining into it typically causes lesions in the parasagittal frontal and parietal lobes. Transverse sinus thrombosis typically gives temporal or occipital lobe lesions (Fig. 3.21). Contrast-enhanced CT and MRI may also demonstrate parenchymal or leptomeningeal enhancement.
may extend into the basal ganglia, midbrain, and adjacent deep white matter. Parenchymal lesions related to superficial CVT are usually cortical and subcortical, and their location depends on the specific veins that are occluded. Thrombosis of the superior sagittal sinus or veins normally draining into it typically causes lesions in the parasagittal frontal and parietal lobes. Transverse sinus thrombosis typically gives temporal or occipital lobe lesions (Fig. 3.21). Contrast-enhanced CT and MRI may also demonstrate parenchymal or leptomeningeal enhancement.
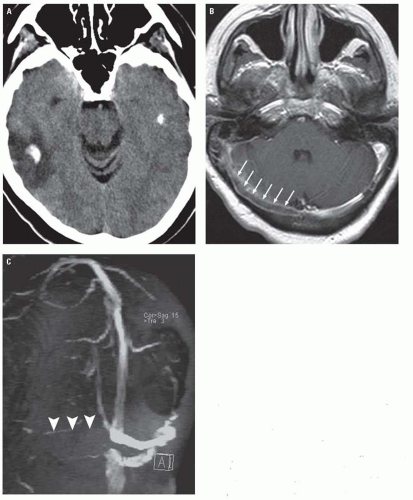 Figure 3.21. Hemorrhagic venous infarction caused by superficial sinus thrombosis. A: Unenhanced axial CT image demonstrates a hyperdense hemorrhage with substantial surrounding edema in the right temporal lobe. B: An axial post-contrast T1WI demonstrates a filling defect in the right transverse sinus (small arrows). C: Right posterior oblique projection MIP image from a 2D TOF-MRA demonstrates lack of flow in the right transverse (arrowheads) and sigmoid sinuses. |
Restricted diffusion can be seen in the edematous regions on DWI, presumably representing areas of cytotoxic edema; however, the diffusion weighted signal abnormality in venous infarctions is often much less impressive than changes seen in cases of arterial infarction, usually involves a relatively small portion of the edematous tissue, and is frequently reversible.
Thrombus within a cortical vein or venous sinus is evident on unenhanced CT in roughly 25% of cases of CVT, appearing as high-density material within the occluded vein (the so-called cord sign) (Figs. 3.20 and 3.22). On contrast-enhanced CT or MR, an intraluminal filling defect can often be seen within an occluded sinus (Fig. 3.21). One well-described finding on contrast-enhanced studies is the “empty delta” sign that appears as a central filling defect in the triangular superior sagittal sinus surrounded by enhancing collateral venous channels in the dural envelope (Fig. 3.22).
On MRI, thrombus is suggested by the absence of a normal flow void in the occluded venous structure. Acute thrombus (0 to 5 days) is predominantly isointense on T1WI and hypointense on T2WI, whereas subacute thrombus (6 to 15 days) becomes increasingly hyperintense on both T1WI and T2WI. Sequences susceptible to blood may also be useful for detecting thrombosed veins, which will appear markedly hypointense on susceptibility weighted imaging (SWI) and T2* images.
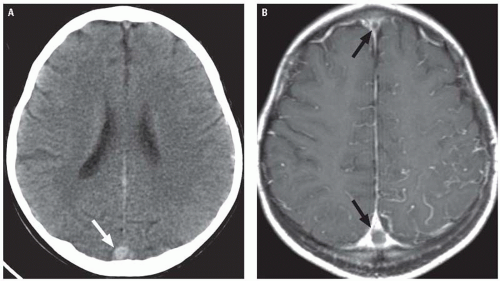 Figure 3.22. Superior sagittal sinus thrombosis. A: Unenhanced axial CT demonstrates high-density thrombus (the so-called cord sign) in the superior sagittal sinus (white arrow). B: Axial post-contrast T1WI in the same patient demonstrates central filling defects in the sagittal sinus (black arrows) surrounded by enhancing collateral venous channels in the dural envelope. There is also prominent leptomeningeal enhancement, likely reflecting venous congestion. |
Phase contrast or time-of-flight MR venography (MRV) in patients with CVT demonstrate absence of normal venous flow-related signal (Figs. 3.20 and 3.21). In some cases, however, time-of-flight MRV may appear falsely negative because of high signal from thrombus being mistaken as normal flow. In these cases, contrast-enhanced CT or MRV usually clearly depicts the filling defect.
Outcomes in patients with CVT are usually favorable with mortality rates falling far lower than 10%. CVT of the deep venous system is associated with a poorer prognosis than purely superficial thromboses, largely because of the fact that the deep system lacks a substantial collateral anastomotic drainage pathway, unlike the superficial system. Anticoagulation is the mainstay of treatment even in cases of hemorrhagic venous infarction. In patients with severe neurologic deterioration, catheter-directed
thrombolytic therapy or open surgical thrombectomy may be warranted.
thrombolytic therapy or open surgical thrombectomy may be warranted.
Cavernous Sinus Thrombosis
Cavernous sinus thrombosis (CST) warrants its own mention. CST is a septic thrombophlebitis, which is most commonly a complication of sinusitis and other infections of the middle third of the face. The cavernous sinuses are paired collections of thinwalled veins on either side of the sella turcica that receive venous return from the superior and inferior orbital veins and drain into the superior and inferior petrosal sinuses. They contain the ICAs and are intimately related with several cranial nerves (CN), including the oculomotor nerve (CN III), the trochlear nerve (CN IV), the abducens nerve (CN VI), and divisions of the trigeminal nerve (CN V). The freely anastomosing valveless venous system of the paranasal sinuses allows spread of infection to the cavernous sinus in a retrograde fashion via the superior and inferior ophthalmic veins.
Most patients with CST develop fever, ptosis, proptosis, chemosis, and external ophthalmoplegia (because of dysfunction of CNs III, IV, and VI). Obstruction of venous drainage from the retina can also result in papilledema, retinal hemorrhages, and visual loss. In addition, thrombophlebitis can propagate into other dural venous sinuses resulting in CVT or may incite thrombosis of the cavernous ICA—resulting in ischemia.
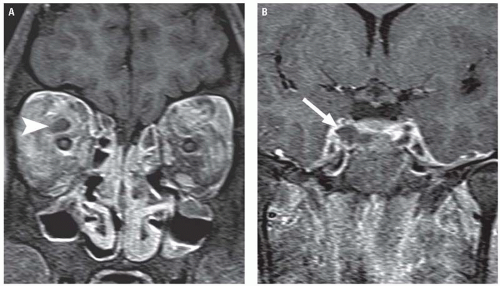 Figure 3.23. Cavernous sinus thrombosis. A: Fat-suppressed coronal post-contrast T1WI through the orbits demonstrates a thrombosed right superior ophthalmic vein (arrowhead), which is enlarged and nonenhancing. There is diffuse sinonasal inflammatory disease and diffusely abnormal enhancement of the orbital soft tissues bilaterally, reflecting postseptal orbital cellulitis. B: Post-contrast coronal T1WI through the cavernous sinuses demonstrates a right cavernous sinus filling defect (arrow). |
CST can be diagnosed with contrast-enhanced CT or MR, which will typically demonstrate a dilated, thrombosed superior ophthalmic vein and filling defects in an enlarged cavernous sinus (Fig. 3.23). The contralateral cavernous sinus may also be involved because of propagation of thrombus across intercavernous sinuses located anterior and posterior to the sella, and images should also be scrutinized for evidence of extension into other dural sinuses or involvement of the ICA. A primary source of infection, usually the adjacent paranasal sinuses, will often be evident.
Staphylococcus aureus is the most common organism identified in CST, accounting for 60% to 70% of cases. Less common pathogens include streptococcal species, gram-negative bacilli, anaerobes, and fungi such as Aspergillus (discussed subsequently) or Mucor. Prior to the widespread availability of
antibiotics, CST was almost universally fatal, but mortality rates in the modern antibiotic era have dropped significantly to less than 20%.
antibiotics, CST was almost universally fatal, but mortality rates in the modern antibiotic era have dropped significantly to less than 20%.
Nontraumatic Hemorrhagic Disorders
Like traumatic hemorrhages, nontraumatic ICH can be classified as intra-axial (or intraparenchymal) or extra-axial. Primary intra-axial hemorrhages usually originate from the spontaneous rupture of small vessels damaged by long-standing hypertension or amyloid angiopathy and account for 78% to 88% of nontraumatic parenchymal hemorrhages. Secondary hemorrhages, which make up the minority of cases, may be caused by vascular anomalies (malformations or aneurysms), tumors, coagulopathies, or vasculitis.
Nontraumatic extra-axial hemorrhages are usually localized to the subarachnoid space or subdural space. Atraumatic SAH is usually caused by a ruptured aneurysm. Subdural hematomas (SDH) can occur spontaneously or as a result of trivial trauma. Causes of spontaneous SDH include intracranial hypotension, hemorrhagic dural metastases, anticoagulation, and bleeding diatheses. These SDHs can present in the subacute or chronic stages and may therefore demonstrate mixed densities (suggesting multiple repeated hemorrhages) on unenhanced CT or density lower than expected for acute hemorrhage, at times isodense to adjacent brain parenchyma. Nevertheless, they are otherwise identical in location and configuration to SDH occurring in the setting of acute trauma and are, therefore, not discussed in detail here.
Hypertensive Hemorrhage
Chronic hypertension is the leading cause of spontaneous intraparenchymal hemorrhage in adults. Hypertensive hemorrhages occur most frequently in the sixth and seventh decades of life and more commonly in men than women. Long-standing hypertension induces proliferation and eventual death of the smooth muscle cells in the walls of small penetrating arteries with eventual collagenous replacement. Depending on the rate of collagen deposition, vascular occlusion or ectasia may result. In the latter case, focal arteriolar dilatations are referred to as Charcot-Bouchard aneurysms, and it has long been theorized that hypertensive hemorrhages are caused by rupture of these aneurysms. However, more recent evidence suggests that hemorrhage may be the result of ischemic damage to the arterial wall, which usually occurs in areas of previous ischemic damage. Mortality associated with spontaneous intracerebral hemorrhage is between 23% and 58%, and large hematoma size and intraventricular extension are associated with a higher likelihood of mortality.
Acute hypertensive hemorrhages are characteristically ovoid or mildly lobulated and homogeneously hyperdense on unenhanced CT. Common sites of hypertensive hemorrhage include the basal ganglia, the thalami, the brainstem, and the dentate nuclei of the cerebellum (Figs. 3.24 and 3.25


Related posts:
Stay updated, free articles. Join our Telegram channel
Full access? Get Clinical Tree
