Normal and Abnormal Physiology of Cerebral Blood Flow
Andrew Bivard
Mark Parsons
Average cerebral blood flow (CBF) in a healthy human is approximately 50 mL/100 g/min, with a large difference between gray matter CBF (80 mL/100 g/min) and white matter CBF (20 mL/100 g/min).1 The brain is highly metabolically active and consumes 20% of the body’s oxygen and 25% of its glucose, yet makes up only 2% of the body’s mass. The high rate of resting CBF allows the brain to receive 15% of the body’s cardiac output.
Apart from delivering metabolic products such as oxygen, glucose, and hydrogen ions, blood flowing to the brain also plays a vital role in thermoregulation by maintaining the brain at a temperature of 37.5°C and removing carbon dioxide by-products from cellular respiration. Cellular death in the brain occurs rapidly (within minutes) after complete blood flow cessation. This is chiefly because the brain cannot produce or store its own energy and constantly requires replenishment.
Arterial pH, Arterial Carbon Dioxide Tension, and Cerebral Blood Flow
Blood flow plays an important role in regulating pH (a measure of the activity of dissolved hydrogen ions and acid-base balance). Changes in pH could result from a change in the concentration of carbonic acid in the blood, which is a result of increased carbon dioxide levels (arterial carbon dioxide tension, PaCO2) that build up as a by-product of neuronal activation or metabolism. A low pH (<7.35) results in acidosis and occurs where carbon dioxide is dissolved in the blood as carbonic acid. Acidosis could result from poor pulmonary ventilation, low levels of pH plasma buffers (i.e., substances that accept hydrogen ions) such as plasma proteins, or low blood flow. High pH (>7.45, PaCO2 <35 mm Hg) results in alkalosis that is caused by low concentrations of carbonic acid in the blood, typically due to hyperventilation (excessive breaths). The respiratory pathway tries to compensate for changes in pH by regulating the respiratory rate and takes 2 to 4 hours before changes in pH can be effective. If changes in respiration are not effective, a metabolic compensation takes place after 2 to 4 hours and may result in an increase in blood bicarbonate to absorb excess carbon dioxide. The body’s normal reaction to a decrease in pH is to increase the respiratory rate (tachypnoea) in order to promote carbon dioxide release through the lungs, which lowers the level of arterial carbonic acid and as a result the arterial pH.
It is important to understand the role of arterial pH and PaCO2 because PaCO2 has a large influence on CBF.2 Sympathetic activity, respiration, and cardiac output also play a role in CBF regulation. An increase in PaCO2 results from local neuronal activation and metabolism to maintain local ionic gradients. An increase in PaCO2 then results in local vessel dilatation that increases the volume of blood flowing to this region to maintain pH.
In normal tissue, blood vessel smooth muscle tone is controlled by a balance of endothelial-released prostacyclin and nitric oxide relaxation versus platelet-stimulated thromboxane-A2 and serotonin 5-hydroxytryptamine contraction. Prostacyclin is released by healthy endothelial and involves signaling with G protein–coupled receptors on nearby platelets and endothelial cells to stimulate cyclic adenosine monophosphate (cAMP) receptors to activate protein kinase A to relax smooth muscle. Nitric oxide is a compound produced by many cells of the body and it relaxes vascular smooth muscle by binding to the heme moiety of cytosolic guanylate cyclase, activating guanylate cyclase and increasing intracellular levels of cyclic guanosine 3′,5′-monophosphate, which then leads to vasodilatation. Thromboxane-A2 is produced by activated platelets to stimulate activation of new platelets and increase local platelet aggregation. Lastly, the serotonin receptor family, 5-hydroxytryptamine, comprise G protein–coupled receptors and ligand-gated ion channels that increase intracellular cAMP levels. The cAMP is derived from adenosine triphosphate (ATP) and is used for intracellular signal transduction as a secondary messenger by smooth muscle to detect low concentrations of ATP and stimulate increased blood flow for ATP synthesis as part of flow metabolism coupling.
Astrocytes are increasingly being shown to be a regulator of vasodilatation. Neurons in the adult brain depend on metabolic support from surrounding astrocytes, because neurons do not express the mitochondrial enzyme glutamine dehydrogenase and cannot produce the chief excitatory transmitter, glutamate. In the adult central nervous system, glutamate mediates 70% of neurotransmission. Cerebral microvessels are extensively ensheathed by astrocyte processes, and may regulate activity-dependent parenchymal blood flow through astrocytic Ca2+ signaling. Astrocytic activation leads to an
18% increase in arterial cross-sectional area corresponding to an almost 40% increase in local perfusion.3
18% increase in arterial cross-sectional area corresponding to an almost 40% increase in local perfusion.3
Autoregulation and Modulation of Cerebral Blood Flow
Autoregulation of CBF is the intrinsic ability of the brain to maintain a stable CBF despite fluctuations in cerebral perfusion pressure (CPP) brought about, for example, by hypertension or carotid stenosis. Autoregulation involves supplying cerebral arterioles with a stable CBF to maintain a close match between oxygen supply and demand in the brain as well as responding to sustained hypoperfusion by changing their diameter to protect the brain against ischemia, resulting from hypotension, or capillary damage and edema provoked by hypertension. Only the arterioles are able to autoregulate, not the capillaries. Changes in the demand of blood are a result of metabolic activity that depletes local metabolite stores and generates by-products such as PaCO2. By increasing the local CBF, metabolites are delivered and PaCO2 can be removed. Autoregulation maintains CPP by controlling vasodilatation, cerebral vascular resistance, and controlling cerebral blood volume (CBV) to maintain CBF within normal levels. Demand for blood flow is dependent on many mechanisms, such as neuronal activity, oxygen availability, or tissue oxygen extraction.
Disease states can affect the autoregulation of CBF, resulting in dysfunctional autoregulation of blood flow to regions of the brain. Ischemic stroke, severe head injury, neonatal brain asphyxia, infections of the central nervous system, subarachnoid hemorrhage, tumors, or hematoma can all cause dysfunction of autoregulation that exposes the brain to the harmful effect of blood pressure changes that result in CPP being dependent on blood pressure and has been shown to lead to poor clinical prognosis.4 Moreover, high blood pressure (>200 mm Hg) can overcome the protective capacity of autoregulation and cause cerebral hyperperfusion, which manifests as encephalopathy and reversible magnetic resonance changes.
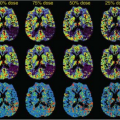
Dysfunction of cerebral autoregulation can cause cerebral hyperperfusion syndrome (CHS).5 CHS represents a spectrum of clinical symptoms ranging from severe unilateral headache, seizures, and focal neurologic defects to its most severe form, intracerebral hemorrhage.6 CHS is associated with significant morbidity and develops in 7% of patients after carotid intervention,7 causing clinical presentations that might be misdiagnosed as transient ischemic attack (TIA) or migraine and can also result in ipsilateral headache, hypertension, seizures, and focal neurologic deficits. The exact mechanism leading to CHS is unknown; however, it seems to be related to increased regional CBF secondary to loss of cerebrovascular autoregulation (Fig. 41.1).8
Cerebral Reserve
It is widely accepted that a large amount of oxygen is released to diffuse into tissue by the arteries rather than
capillaries during normoxia.9 Furthermore, it has been established that chronically diminished oxygen delivery to tissue in response to hypoxia is countered by an increased functional capillary density in the microcirculation.10 Capillary response to reduced CBF or oxygen is referred to as cerebrovascular reserve, which is the ability of the intracranial vessels to dilate in response to vasodilator stimuli. The rate of blood cell arrival to adjacent tissue is very important for oxygen delivery, and if the rate of blood cell arrival is insufficient, the vessels delivering the blood cells need to be widened to maintain or increase the volume of blood cell delivery to tissue. Cerebrovascular reserve is different from autoregulation because cerebrovascular reserve is the reflex vasodilatation that occurs after insult or stimuli, whereas autoregulation is an intrinsic protective mechanism for cerebral circulation that separates CBF from blood pressure. Cerebrovascular reserve can be evaluated by monitoring the blood flow in intracranial vessels in response to the administration of acetazolamide or increased CO2 concentrations. If patients are able to alter their CBF in response to these stimuli, they have intact cerebral reserve capacity. If they are unable to manifest a change in the blood flow in these vessels, their autoregulatory mechanisms are exhausted and they lack cerebral reserve.11
capillaries during normoxia.9 Furthermore, it has been established that chronically diminished oxygen delivery to tissue in response to hypoxia is countered by an increased functional capillary density in the microcirculation.10 Capillary response to reduced CBF or oxygen is referred to as cerebrovascular reserve, which is the ability of the intracranial vessels to dilate in response to vasodilator stimuli. The rate of blood cell arrival to adjacent tissue is very important for oxygen delivery, and if the rate of blood cell arrival is insufficient, the vessels delivering the blood cells need to be widened to maintain or increase the volume of blood cell delivery to tissue. Cerebrovascular reserve is different from autoregulation because cerebrovascular reserve is the reflex vasodilatation that occurs after insult or stimuli, whereas autoregulation is an intrinsic protective mechanism for cerebral circulation that separates CBF from blood pressure. Cerebrovascular reserve can be evaluated by monitoring the blood flow in intracranial vessels in response to the administration of acetazolamide or increased CO2 concentrations. If patients are able to alter their CBF in response to these stimuli, they have intact cerebral reserve capacity. If they are unable to manifest a change in the blood flow in these vessels, their autoregulatory mechanisms are exhausted and they lack cerebral reserve.11
Carotid artery stenosis and chronic ischemia can result in vasculature that is unresponsive to stimuli (acetazolamide and CO2 challenges) and lacks cerebral reserve. By assessing cerebrovascular reserve, it might be possible to identify patients with reduced vascular reserve to identify those who are more at risk of complications or where therapeutic measures are critically needed because any further challenges in blood flow can no longer be compensated via vascular reserve. Impaired reactivity is a risk factor for the occurrence of ischemic events after revascularization from carotid endarterectomy. Reduced cerebral reactivity in patients before carotid endarterectomy is also associated with increased risk of developing CHS postoperatively. In patients challenged preoperatively with acetazolamide, a reactivity of less than 20% or a pretreatment CBF asymmetry of less than 75% between carotid artery flow rates was predictive of development of hyperperfusion postoperatively.12 An advantage of measuring reactivity is that it accounts for variations in collateral circulation rather than just stratifying risk groups based purely on the degree of angiographic stenosis, which has been shown to be inconsistent in predicting postoperative risk of CHS.
Reduced cerebrovascular reserve has also been shown to be a predicative marker for the risk of ischemic stroke; 23% of patients with reduced reserve and 55% with exhausted reserve develop ischemic events within 38 months of monitoring.13 Moreover, patients with chronic symptomatic internal carotid stenosis had a larger difference between hemispheric reserve variations than stenotic patients without symptoms.14 Therefore, measurements of cerebrovascular reserve might have clinical importance, but this has not been studied during the acute phase of ischemic stroke.
Flow Metabolism Coupling and Its Role in Autoregulation
The essential metabolite being delivered to the brain by blood is oxygen, and to a lesser extent glucose. Despite adequate blood flow to the brain, consciousness is lost within 10 seconds when oxygen supply is rapidly stopped as a self-preservation measure, this being the transit period for oxygenated blood from the lung to reach the brain. Glucose is also a major energy source for the brain, manifest when individuals lose consciousness after hypoglycemia. In the brain, energy is used to maintain membrane integrity and transmembrane ion gradients that stabilize cells, with maintenance of ion gradients across cell membranes accounting for about 70% of the energy demands of the human brain.15 Energy is also required for the synthesis, uptake, and release of neurotransmitters. In a healthy brain, the energy demands of the central nervous system are entirely provided by glucose, delivered by the blood. Therefore, an increase in neuronal activity results in an increase in glucose consumption, with a compensatory increase in regional CBF to supply the glucose. The demand for metabolic energy mainly comes from the activation of the sodium-potassium ATPase to restore an ion gradient across a neuron cell membrane after neuronal action potential release. This increase in metabolite demand is then met with a local increase in CBF facilitated by astrocyte-mediated vasodilatation.
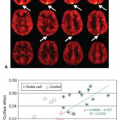
Normal intellectual functioning in a healthy individual uses oxygen at a rate of approximately 35 mL/min/kg brain tissue; so, for a 70-kg man with a 1.5-kg brain, basal whole body oxygen consumption is 280 mL/min with brain oxygen consumption of 50 mL/min. Physical and intellectual activity cause incremental increases in oxygen consumption of up to 20% of blood oxygen. Internal jugular venous sampling reveals that the blood leaving the brain typically has a hemoglobin oxygen saturation of 60% to 75%, which does not change significantly even during strenuous intellectual activity. Therefore, increases in demand are met with an increase in blood flow by local autoregulation. In other words, only more oxygen is delivered arterially via a higher CBF. Consequently, the flow at the venous outlet will also increase (Fig. 41.2).
Sex and Age Dependence of Blood Flow
In addition to the physiologic variables that influence CBF, sex and age influence CBF. Sex corresponds to differences in the luminal diameter (the inner space of a blood vessel) of the common carotid artery,16 the external carotid artery,17 and the internal carotid artery18 with men typically having
larger luminal diameters. Nevertheless, no study has found a sex-related variation in the luminal diameter of the middle cerebral artery or the smaller vessels of the brain, mostly because of the large variation seen in the luminal diameter among the population. Lastly, the CBF in men and women is similar, the exception being that men have a higher external carotid artery flow rate than women.
larger luminal diameters. Nevertheless, no study has found a sex-related variation in the luminal diameter of the middle cerebral artery or the smaller vessels of the brain, mostly because of the large variation seen in the luminal diameter among the population. Lastly, the CBF in men and women is similar, the exception being that men have a higher external carotid artery flow rate than women.
With increasing age, it has been shown that there is a decline in the flow velocity of blood in the common carotid artery, the internal carotid artery, intracranial basal cerebral arteries, and the vertebral arteries.19 With age, there is an increase in the luminal diameter that results in an increase in blood volume passing through the common carotid artery,20 internal carotid artery, intracranial basal cerebral arteries, and the vertebral artery. With the age-dependent decrease in blood flow volume to various arteries in the brain, there is also a corresponding reduction in CBF.21 Studies suggest that CBF declines by 4.8 mL/min/100 g per year and on average whole brain CBF in a 19- to 29-year-old is 748 mL/min, which declines with age; in the age range 50 to 59, CBF is 595 mL/min, while in the age range 60 to 69, CBF is 536 mL/min and in the age range 80 to 89, CBF is 474 mL/min.22
Spectrum of Cerebral Blood Flow
Changes in blood flow to or within the brain can have major effects on tissue function and may cause severe clinical impairment. Stroke is one such disease with two broad categories: ischemic stroke or hemorrhagic stroke. Ischemic stroke accounts for 80% of patients presenting to hospital with a stroke and is caused by a blood clot (thrombus) occluding a blood vessel, leading to hypoperfusion of tissue downstream of the occlusion. The thrombus can occur from many mechanisms including in situ from thrombosis of an intracerebral blood vessel, rupture of an extracranial artery plaque, or a cardioembolic event (originating from the heart, most commonly owing to atrial fibrillation). The reduction in CBF caused by a thrombus results in an area of hypoperfusion, which results in tissue death. Nevertheless, not all areas supplied by the occluded vessel undergo the same degree of hypoperfusion, resulting in differing rates of tissue death across the affected brain tissue.
The variation in the degree of hypoperfusion is a result of collateral blood circulation. Collateral blood flow bypasses the occlusion site and delivers blood to hypoperfused tissue to prevent immediate tissue death. Collateral circulation is provided by several mechanisms: during stroke, arterioles can open and provide greater circulation to capillaries around hypoperfused tissue. Here, either the anterior or posterior communicating arteries of the circle of Willis can provide collateral circulation during internal carotid artery occlusion, or the ophthalmic artery or leptomeningeal vessels during large and small vessel occlusion can provide collateral circulation. Collateral flow to hypoperfused tissue gives rise to the ischemic penumbra (Latin: paene meaning almost; umbra meaning shadow), which is
defined as an area of critically ischemic or hypoperfused tissue that is at risk of death (infarction) if this degree of hypoperfusion persists, and is separate from tissue that will progress to infarct even with immediate restoration of perfusion. The crucial difference between the two tissue categories is that penumbra is potentially salvageable with reperfusion, which likely relates to better collateral flow to this region.23 At the other end of the spectrum, there is an area adjacent to the ischemic penumbra that is hypoperfused but not at risk of infarction (previously termed benign oligemia) and does not result in clinical symptoms, however, it can be seen on acute imaging.24
defined as an area of critically ischemic or hypoperfused tissue that is at risk of death (infarction) if this degree of hypoperfusion persists, and is separate from tissue that will progress to infarct even with immediate restoration of perfusion. The crucial difference between the two tissue categories is that penumbra is potentially salvageable with reperfusion, which likely relates to better collateral flow to this region.23 At the other end of the spectrum, there is an area adjacent to the ischemic penumbra that is hypoperfused but not at risk of infarction (previously termed benign oligemia) and does not result in clinical symptoms, however, it can be seen on acute imaging.24
The experimental concept of the ischemic penumbra led to great enthusiasm to open an occluded blood vessel to reestablish blood flow to the ischemic area (reperfusion) and rescue the ischemic penumbra from death. In the clinical setting, imaging plays a vital role in ischemic stroke, and it is the only reliable way to differentiate ischemic stroke from hemorrhagic stroke. Second, more advanced imaging using perfusion computed tomography (CT) or magnetic resonance imaging (MRI) techniques (perfusion and diffusion-weighted imaging) can estimate the volume of the acute penumbra (or more strictly, tissue potentially salvageable with timely reperfusion), as well as the extent of irreversibly injured tissue destined to infarct even with rapid reperfusion (core). The volume of the acute core is the strongest predictor of poor clinical outcome in patients with a baseline infarct core greater than 50 to 70 mL, generally having poor outcomes regardless of the amount of additional tissue that is salvaged from progression to infarction.25 This means that at the time of scanning and treatment, the volume of already infarcted tissue is probably more clinically important than the volume that can be salvaged. That is, if there is a large established infarct core, reperfusion therapy is unlikely to show major benefit because of the existing extensive damage that cannot be undone. But if there is a small acute infarct core, it is then possible to prevent infarct growth through reperfusion therapy. Advanced imaging is currently used to identify patients with a small core and at least some potentially salvageable tissue and thus could identify patients most likely to respond to acute reperfusion strategies.26
The differences in thresholds to determine the fate of tissue (core vs. critically hypoperfused but potentially salvageable tissue vs. hypoperfused tissue not at significant risk of infarction) present several challenges clinically. First, not all hypoperfusion results in tissue death, as has been described with mildly hypoperfused tissue that has a more effective collateral supply than penumbral tissue and does not reach an ischemic threshold but is still receiving less blood flow than healthy tissue. Mildly hypoperfused tissue can also be asymptomatic in clinical terms, making estimation of the extent of stroke-affected tissue difficult without imaging. Second, because of the topographic distribution of brain function, focal hypoperfusion can result in various clinical symptoms that are disproportionate to the volume of tissue affected by ischemic stroke. For example, the National Institutes of Health Stroke Score (NIHSS)27 scale is a 42-point system widely used to assess the severity of a stroke but is weighted toward motor, sensory, and speech deficits. The NIHSS scale generally underestimates the severity or extent of hypoperfusion in the posterior cerebral artery territory, mostly because brain function in this region is more concerned with visual perception rather than motor activity. Thus, ischemia affecting the motor regions of the brain, such as in the territory of superior middle cerebral artery, can appear worse clinically than ischemia of the visual cortex but affect a similar volume of tissue. Similarly, strokes in the nondominant hemisphere can score very few points on the NIHSS scale or modified Rankin scale28 but can be massive. Thus, brain imaging with perfusion imaging adds to clinical characterization of ischemic stroke. That said, many imaging-based stroke trials still hinge on NIHSS or modified Rankin scale as outcome measures, which often leads to poor correlations. A more comprehensive, unbiased, clinical disability score would therefore be timely.
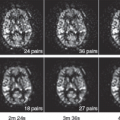
The minimum perfusion threshold for infarction has been found to rise depending on the time since ischemia onset because ATP stockpiles are depleted in an effort to maintain cellular function. Reductions of CBF to 13 mL/100 g/min for 30 minutes, 23 mL/100 g/min for 6 hours, or 32 mL/100 g/min for 12 hours can all cause irreversible cellular death.29 This is a result of the threshold for the loss of cellular function increasing with the duration after stroke onset according to the ischemic cascade. Every ischemic stroke patient on arrival to the emergency room differs in the severity and duration of cerebral hypoperfusion, meaning that a method of assessing tissue pathophysiology that can take into account the severity of hypoperfusion and at what stage in ischemic cascade a patient is would be ideal in determining suitability for penumbral salvage therapy. This is achieved through the use of perfusion or diffusion imaging on MRI30 or CT perfusion imaging31 (see Chapters 43 and 45). Unfortunately, perfusion imaging provides a onetime snapshot image of the tissue perfusion status without further information about how long hypoperfusion persisted prior to imaging. Hence, it is relatively difficult to predict tissue fate from perfusion alone, and this is considered one of the shortcomings of CT. Conversely, diffusion-weighted imaging leverages a different biophysical parameter (diffusion) that is more reflective of the accumulative tissue damage that is much harder or impossible to reverse. This complementary information is the major advantage of (diffusion or perfusion) MRI over CT (Fig. 41.3).
Ischemic Penumbra
The original biologic definition of the ischemic penumbra was derived by direct measures of CBF in a primate model as an area that is electrically silent, but can recover electrophysiologically if CBF is restored to normal levels rapidly.29 Nevertheless, the original definition was expanded to “the penumbra is ischemic tissue which is functionally impaired and is at risk for infarction, but has the potential to be salvaged. If not salvaged this tissue is progressively recruited into the infarct core, and over time, without reperfusion, the infarct will expand into the entire volume of the penumbra.” 32 The expanded definition added information on what would happen to
the critically hypoperfused tissue should CBF not be restored, with subsequent research identifying that the rate of infarct expansion into the penumbra is dependent on the depth of reduction in CBF.
the critically hypoperfused tissue should CBF not be restored, with subsequent research identifying that the rate of infarct expansion into the penumbra is dependent on the depth of reduction in CBF.
The gold standard imaging technique for measuring metabolic parameters in humans and primates is currently positron emission tomography (PET). Using PET studies of the brain, the cerebral metabolic rate for oxygen (CMRO2), regional cerebral metabolic rate of glucose, and the oxygen extraction fraction (OEF) can be measured. The amount of oxygen that a cell extracts from flowing blood for consumption by the surrounding tissue (OEF) is a critical determinant of the cell’s health and activity as it directly measures the amount of oxygen delivered to the tissue, regardless of the CBF supply. In the healthy brain, OEF is inversely proportional to CBF, in that if CBF decreases, OEF increases to counter the change in supply but constant demand of oxygen. If CBF reduces beyond the point where increases in OEF can compensate, ischemia will occur. The latter is caused by an insufficient delivery of oxygen to meet metabolic demands. The reduced delivery of oxygen to tissue results in energy failure and permanent tissue injury, depending on the duration and degree of the ischemia. Infarction occurs when CBF is below a rate of 12 mL/100 g/min and CMRO2 is below 65 μm/100 g/min, while the penumbra has a less severe decrease in CBF to between 12 to 22 mL/100 g/min, a CMRO2 above 65 μm/100 g/min, and an OEF increase from 50% to 90%.33 The brain’s mean baseline CBF is around 50 mL/100 g/min, which means that there is a range of hypoperfusion that tissue can undergo, which will not lead to infarction but may be electrically impaired (22 to 50 mL/100 g/min) and is termed benign oligemia (Greek: oligos meaning little; haima meaning blood) in the clinical setting. Nevertheless, the CBF for irreversible damage and for functional impairment from experimental models of ischemia in cats is different from those observed in humans (damage below 4.8 to 17.3 mL/100 g/min, penumbra below 14.1 to 35.4 mL/100 g/min),34 which limits possible translation of animal research.
The reasons for the variation between species likely relate to the difference in cerebral architecture, because human brains are larger but have a more intricate capillary network to provide collateral circulation during ischemia. Moreover, the baseline CBF of cats is much different from that of humans because of the variation in cardiac output, total blood volume, and cerebral volume. This variation between species affects the thresholds for ischemia in each species, of which the baseline CBF of a cat is 65 mL/100 g/min whereas the human baseline CBF is 50 mL/100 g/min.
During ischemia, there is less free-flowing blood carrying oxygen as well as an increase in cerebral oxygen demand. The penumbra experiences a decrease in CBF and can be operationally defined in humans as blood taking more than 4 to 6 seconds to reach tissue from a major artery on acute imaging. Therefore, if oxygen consumption in the brain is increased and blood is taking longer to reach the penumbra, there is very little oxygen reaching the penumbra because it has been absorbed by the tissue on its way to penumbra primarily because mildly hypoperfused tissue also sees an increase in oxygen extraction. CBF and oxygen consumption thresholds identified for ischemic and irreversible injuries are 18 mL/100 g/min and 1 mL/100 g/min, respectively. The CBF is influenced by mean arterial pressure (MAP), intracranial pressure (ICP), PaCO2, partial pressure of oxygen, and CMRO2. Additionally, cerebral perfusion pressure is equal to the mean arterial pressure minus intracranial pressure (CPP = MAP − ICP), meaning that MAP can be regulated to maintain a constant CPP if ICP changes. Increases in CMRO2, whether globally or regionally, are matched with an increase in CBF. Where there is a limitation in supply (unmatched CBF), there is a compensatory increase in oxygen extraction. Nevertheless, during and after cerebral hypoperfusion, arterial hypotension, hypoxemia, and flow–metabolism uncoupling, as well as the metabolic, immunologic, and biochemical changes, can all result in metabolic disruption of brain tissue.
PET imaging studies of cats following middle cerebral artery occlusion suggest three phases of injury progression; at a CBF of 20% to 30% compared with contralateral hemisphere, an infarct core of irreversibly injured tissue will evolve within minutes.35 Tissue surrounding the infarct core with a CBF of 25% to 50% compared with contralateral hemisphere would infarct progressively (with the infarct core expanding). This process can take 4 to 6 hours, with some limited reports of penumbra out to 48 hours in humans and 24 hours in chimpanzees.36 Peri-infarct spreading depressions are also initiated in the second phase at the border of the infarct core and spread over the ipsilateral hemisphere. Spreading depression is characterized as a wave of cellular depolarization that spreads across the cortex as a result of increased extracellular potassium and glutamate concentration, which results in cellular electrical dysfunction. During spreading depression, the metabolic rate of the tissue markedly increases in response to the activated ion exchange pumps,37 but this cannot be accompanied by a compensatory increase in relative CBF in ischemic regions. Thus, the increased metabolic workload coupled with limited O2 supply leads to transient episodes of more severe hypoxia and stepwise increases in lactate with each depolarization as cells turn to anaerobic metabolism for energy production in an attempt to maintain ionic gradients and other molecular processes that prevent cell death. The last, “delayed” phase of injury, apoptosis, is said to take place several days after stroke onset. In this phase, there are considerable metabolic disturbances, resulting in continued cellular death that cannot be halted by reperfusion.
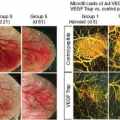
The National Institute of Neurological Disorders and Stroke’s (NINDS) recombinant tissue plasminogen activator trial38 heralded the onset of a new era of interventional stroke treatment aimed at salvaging penumbral tissue. This trial showed that early treatment (within 3 hours) of an ischemic stroke with the clot-dissolving (thrombolytic) drug alteplase substantially improved clinical outcomes. Thrombolytics aim to dissolve a thrombus to reestablish blood flow to the penumbra and salvage the tissue. Although the NINDS study was not able to visualize penumbra at the time, the benefits of thrombolysis almost certainly occurred owing to early salvage of penumbral tissue. Since then, many have suggested that direct visualization of the penumbra is not necessary, and, indeed, all current treatment guidelines only recommend a noncontrast CT (to exclude hemorrhage) prior to thrombolysis with the goal to treat patients within 3 hours of symptom onset. Phase 2 studies have demonstrated that using penumbra imaging during the acute phase of stroke to preferentially treat patients with a large penumbra and small infarct core is highly effective (Fig. 41.4).26
Stay updated, free articles. Join our Telegram channel

Full access? Get Clinical Tree


