Normal Development of the Fetal, Neonatal, and Infant Brain, Skull, and Spine


Normal Development of the Fetal, Neonatal, and Infant Brain, Skull, and Spine


Matthew J. Barkovich

A. James Barkovich


Introduction

The brain matures in an organized, predetermined pattern that correlates with the functions as the newborn or infant performs at various stages of development. Prior to the development of modern neuroimaging techniques, it was not possible to analyze normal brain maturation in vivo. Neuroimaging allows analysis of many aspects of brain maturation, including development of sulci, myelination, maturation of brain chemistry, changes in free water diffusion, changes in blood velocity, and changes in location of specific brain activities. Although transfontanelle ultrasonography, x-ray computed tomography (CT), and magnetic resonance imaging (MRI) all show gross morphologic changes in the maturing brain, MR supplies the most information. MR permits highly sensitive assessment of the maturation of gray and white matter, in addition to assessment of microstructural changes including those secondary to myelination. Myelination is an important component of brain maturation because it facilitates the transmission of neural impulses through the central nervous system; myelination can be studied by the changes in the T1 and T2 relaxivity of the brain tissue, by assessing changes in magnetization transfer or, indirectly, by assessing changes in the degree and direction of microscopic motion (diffusion) of water in the brain. Magnetic resonance spectroscopy (MRS) allows us to assess some of the chemical changes that occur as the brain develops. Finally, changes in regions of brain activity may be determined by looking at changes in local cerebral blood oxygenation resulting from the activity through the use of blood oxidation level-dependent (BOLD) imaging (sometimes called functional MRI or fMRI). Imaging correlations of these changes that occur during normal brain maturation will be described in this chapter.


Normal Prenatal Brain Development


Embryology

The bilateral cerebral vesicles that will form the cerebral hemispheres first appear at about 35 days of gestation as outpouchings of the telencephalon from the regions of the foramina of Monro. At the time of these outpouchings, the walls of the vesicles are uniformly thin and are connected in the midline by the lamina terminalis, a midline area derived from the roof plate that has shrunken due to apoptosis. The lamina terminalis does not grow as development proceeds; however, the cerebral vesicles exhibit marked expansion laterally, rostrally, ventrally, and caudally. As the vesicles expand, cellular layers develop within their walls, forming the germinal matrices from which the cells that form the cerebrum will eventually develop. The germinal matrices are initially composed only of a single region of proliferating cells (the ventricular zone), but as development proceeds, a more peripheral subventricular germinal zone develops, separated from the ventricular zone by a periventricular fiber-rich zone. These germinal zones are divided based upon their location, the type of neurons generated, and the ultimate destination of the neurons: (a) medial ganglionic eminence (located near the developing third ventricle, GABAergic neurons generated, including cortical interneurons, hippocampal interneurons, and globus pallidus interneurons); (b) lateral ganglionic eminence (located near the developing third ventricle, GABAergic neurons generated, mainly striatal projection neurons and olfactory interneurons, also some thalamic interneurons); (c) preoptic area (located near the
bottom of the developing third ventricle, GABAergic neurons generated, including cells to the preoptic area, amygdala, posterior globus pallidus, and cortex); (d) dorsal neocortical germinal zone (located in walls of developing lateral ventricles, glutamatergic neurons destined for the neocortex) (1,2,3,4,5,6,7). Neurons migrate from these germinal zones through the developing hemispheres to form the cerebral cortex, initially in an incomplete form that is often called the preplate. As the neurons migrate, they develop axonal connections with other cortical and subcortical (subplate) neurons. The axons form a prospective zone of white matter that is called the intermediate zone because it is in the region intermediate between the ventricular zone and the developing cortex. In addition to afferent and efferent axons, the intermediate zone contains migrating neurons and oligodendrocyte progenitor cells (8). Between the preplate and the intermediate zone is a transient area of loosely packed and loosely organized neurons that form temporary neuronal circuits, particularly with the thalamus (9); this zone is known as the subplate. The subplate is largest at the 30th postconceptional week (10). At that time, it is about four times thicker than the cortex, occupying up to 45% of the telencephalon, and is easily seen on fetal MRI as an area of T1 hypointensity and T2 hyperintensity between the intermediate zone and cortex (10,11,12). It gradually disappears after the 30th gestational week, as definitive cortical connections are established (10,11) but remains functional, in part, possibly for as much as the first half of the first postnatal year (10). Details of the development of the hemispheres are described in more detail in Chapter 5. For the purposes of the discussion to follow, it is sufficient to understand that the occipital pole begins to develop at about the 43rd gestational day and the temporal pole at approximately the 50th gestational day. During the early weeks of gestation, the surfaces of the cerebral hemispheres are smooth. The fetal sulci appear in an orderly sequence; the phylogenetically older sulci appear first, and the more recently acquired sulci appear later. The principal sulci and gyri form the characteristic pattern of the human cortex that can be identified in the full-term infant (Table 2-1). The primitive sylvian fissure, the earliest fetal sulcus, is usually present when the fetus is imaged in the fourth gestational month. The next sulci to appear are the calcarine, parieto-occipital, and cingulate sulci during the fifth month (by 20-22 weeks); the Rolandic (central), interparietal, and superior temporal sulci that appear toward the end of the sixth month (by 25 weeks); and the precentral, postcentral, superior frontal, and middle temporal sulci that appear during the seventh gestational month (24-28 weeks) (13) (Fig. 2-1 and Table 2-1). In the medial temporal lobe, the hippocampal sulci are variable and often asymmetrical; asymmetry is also often seen in the formation of the collateral sulcus (14). Because sulcal formation occurs so late in gestation, imaging studies of premature infants show sulci that are shallow and few in number. It is, therefore, important to know the postconceptional age of a child before assessing the sulcal pattern. Otherwise, a false diagnosis of lissencephaly may be made. In addition, as will be discussed in more detail later in the chapter, sulcation, myelination, and corpus callosum development are often delayed in prematurely born neonates compared to fetuses of the same postconceptual age.

van der Knaap et al. (20) have devised a method by which gyral development can be divided into five stages: (a) before 32 weeks, (b) 33 to 34 weeks, (c) 35 to 37 weeks, (d) 38 to 41 weeks, and (e) beyond 41 weeks. The gyral maturity is determined by measurements of the width of the gyri and depth of the sulci. The stage of gyral development is then assigned based upon the degree of gyral maturity in seven different regions of the brain. Battin et al. (21) and Ruoss et al. (22) have also developed systems of assessing sulcal development based on ratios of the width and depth of the sulci and gyri. Gyral development proceeds most rapidly in the area of the sensorimotor and visual pathways. These are also the areas in which myelination occurs earliest ((23) and following section), in which glucose uptake increases earliest (24), in which relative cerebral perfusion increases earliest (25), in which cortical microstructure matures most rapidly (26), and in which brain chemistry matures most rapidly (27). Gyral development takes place most slowly in the frontobasal, frontopolar, and anterior temporal regions, which are also the slowest regions to myelinate and to mature metabolically (24,25,27). It is important to evaluate the sulcal pattern of neonates and infants, as abnormal sulcation predicts abnormal functional development (28).


Table 2-1 Chronology of Sulcation of the Brain (15,16,17,18,19)


Location


Age of Sulcation


Medial Surface


Callosal sulcus


14-23 wk


Parieto-occipital sulcus


16-23 wk


Calcarine sulcus


16-25 wk


Cingulate sulcus


18-24 wk


Marginal sulcus


22-27 wk


Secondary cingulate sulci


32-33 wk


Secondary occipital sulci


34 wk


Ventral Surface


Hippocampal sulcus


16-23 wk


Collateral sulcus


23-26 wk


Occipitotemporal sulcus


30-33 wk


Lateral Surface


Superior frontal sulcus


25-29 wk


Inferior frontal sulcus


28-29 wk


Superior temporal sulcus (posterior part)


23-27 wk


Superior temporal sulcus (anterior part)


28-32 wk


Inferior temporal sulcus


30-33 wk


Interparietal sulcus


26-28 wk


Insular sulci


34 wk


Central sulcus


20-26 wk


Precentral sulcus


24-27 wk


Postcentral sulcus


25-28 wk


Cerebellum


Primary fissure


25-28 wk


In general, the earlier numbers are from pathology studies and the later ones from radiology studies. Imaging numbers (later numbers) indicate when the sulcus is seen in more than 75% of studies.


Imaging of the Preterm Brain (Premature Infant and Fetus)

As mentioned earlier, the imaging modality being used determines which features of brain development can be evaluated. If the anterior fontanelle is large enough, ultrasound shows development of the gyri and sulci nearly as well as CT and MR but does not give information
about brain myelination. CT allows fairly good information about sulcal development but gives a poor assessment of myelin development and it exposes the baby to ionizing radiation; it is not recommended for brain imaging in the fetus, neonate, or infant unless other methods are unavailable. MR allows excellent assessment of myelination, sulcation, and chemical maturation and is the imaging technique of choice for evaluation of normal development in the neonate and infant.


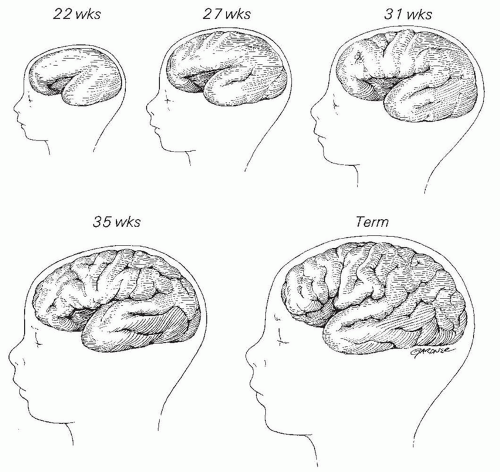
Figure 2-1 Schematic demonstrating normal development of the fetal brain. During the early weeks of gestation, the cerebral hemispheres are smooth. The earliest fetal sulcus is the sylvian fissure, which first appears during the fifth gestational month. By about 27 weeks, the Rolandic, interparietal, and superior temporal sulci have appeared. Secondary and tertiary sulci develop during the last 2 months of gestation. Because of the different appearance of the brain in premature infants as compared with term infants, it is important to know the gestational age of a child at the time of delivery before assessing the structure of the brain.


Figure 2-2 MR images of a fetus at 16 postconceptional weeks. A. Sagittal SSFSE image shows the small size of the cerebellar vermis (large black arrow) and the corpus callosum (small black arrow) at this age compared with the quadrigeminal plate (large white arrow). B. Axial SSFSE image shows the relatively small size of the cerebellum (white arrows) at this age compared with the pons (black arrow).

Fetal MR imaging has been successfully utilized in a large number of centers for the past two decades (12,29,30,31,32,33,34,35). Studies have shown that the cerebral cortex and deep gray structures are relatively large before 20 weeks (Fig. 2-2) but that the cerebellum and cerebral white matter grow disproportionately during the last 20 weeks (36). Improvements in coil technology (particularly the use of multiarray-phased array coils), improved pulse sequences, and development of higher-field strength MRIs have allowed progressive improvement in the quality of the images. Studies (19,33,37,38,39) indicate that brain development follows a similar progression of sulcation in fetuses as in prematurely born infants; sulci are increasingly identified with increasing postconceptional age. However, it appears that sulcal development occurs earlier in utero than ex utero. In other words, sulci are seen slightly earlier in fetuses still in the uterus than in neonates of similar postconceptional ages that have been born prematurely (40). This may result from the fact that the subarachnoid spaces are considerably bigger in fetuses than in newborns of the same postconceptual age (40), allowing the sulci to be more easily seen. The reasons for this are not yet clear, nor are the precise differences in timing. Studies also show that the cerebrum and its components grow largely proportionally. For example, the volume of cortical gray matter, basal ganglia volumes, and ventricular volume parallel that of supratentorial volume, while supratentorial white matter volume grows more rapidly than overall supratentorial volume (41).

Prior to 20 weeks of gestation, the cerebral mantle is quite thin and the ventricles are relatively large (Fig. 2-2). Supratentorially, the T2 hypointensity of the germinal matrices lining the walls of the lateral ventricles is thicker than that of the cortex at 16 weeks (Fig. 2-2D); it is roughly equivalent in thickness to the cerebral white matter layer. The germinal matrix is thickest at the region of the caudate heads and should not be mistaken for a germinal matrix hemorrhage at this location. The more central ventricular zone and adjacent subventricular zone cannot be distinguished by in vivo imaging. Between the germinal zones and the cortex, MR also shows a layer of intermediate signal intensity, separated from the more peripheral cerebral cortex and more
central germinal matrix (Fig. 2-2C-E). Although previously believed to represent migrating glial cells, this layer has recently been identified as the intermediate zone or the developing fetal white matter (11). Projection and commissural axons are present, as are some late migrating neurons and many migrating astrocyte and oligodendrocyte precursors (42). Immediately peripheral to the intermediate zone and deep to the cerebral cortex is a region of T1 hypointensity/T2 hyperintensity (Fig. 2-2F), known as the subplate, a region composed of loosely spaced neurons where thalamocortical afferent axons, basal forebrain cholinergic afferent axons, and callosal and ipsilateral corticocortical axons accumulate for a variable period before entering the cortical plate to establish definitive thalamocortical and corticocortical synapses (10,43,44,45). These zones are most prominent in younger fetuses (<20 gestational weeks). Before 20 weeks, the sylvian fissures are
extremely shallow and no operculization can be identified. The basal ganglia can be identified and are intermediate in signal between the darker cortex and germinal zone and the lighter white matter (Fig. 2-2D). The cerebellum remains quite small at this age, barely bigger than the pons on axial images and smaller than the mesencephalic tectum on the midline sagittal image (Fig. 2-2A and B).


Figure 2-2 (Continued) C. Axial image at the level of the diencephalon shows a very small fourth ventricle (black arrow) between developing thalami and developing temporal horns. D-F. Axial images at the level of the basal ganglia (D) and above show the large hypointense germinal zones of the ganglionic eminences (black arrows in D) and in the walls of the frontal horns and trigones at all levels. Note the thin layer of hyperintense white matter (the white w in F) at this age between the hypointense germinal zones and cortex.


Figure 2-3 Fetal MR at 20 postconceptional weeks. A-D. Axial images show that the germinal zones (low-intensity rims around the ventricles, small black arrows) and lateral ventricles (V) are rather large at this age. The intermediate zones (large white arrows) are best seen at higher levels (C and D). E. Coronal image nicely shows the germinal zone (very low intensity, small white arrows), intermediate zone (intermediate intensity, large white arrow), subplate (higher intensity, large black arrow), and cerebral cortex (similar low intensity to germinal zone, small black arrows).


Figure 2-4 Fetal MR at 23 postconceptional weeks. A. Sagittal SSFSE image shows a thin corpus callosum (black arrows) and an enlarging cerebellar vermis (compare with Fig. 2-2A).

At 20 (Fig. 2-3) to 24 (Fig. 2-4) weeks of gestation, the cerebrum has grown considerably (especially the white matter; Fig. 2-3B-D), but it remains essentially agyric with the exception of the wide, vertically oriented sylvian fissures. The size of the brain is very small and the cerebral cortex is extremely thin, so thin imaging sections (≤3 mm) must be used for optimal evaluation. MR images show the cortex to be very hyperintense with respect to the underlying white matter on T1-weighted images and very hypointense compared to white matter on T2-weighted images (Figs. 2-3 and 2-4). The germinal matrix has not yet involuted and can still be seen as a stripe in the walls of the lateral ventricles that is isointense to the gray matter of the cortex on T1- and T2-weighted images (Fig. 2-2) and very hypointense on echo-planar T2 imaging; it is, however, thinner than in younger fetuses (18-20 weeks) and becomes thinner and discontinuous with further maturation (Fig. 2-4). At this age (23-24 weeks), the germinal matrices remain large and conspicuous as areas of relative
hyperintensity between the cerebral cortex and the white matter on T2-weighted imaging studies (12,46), but they seem to begin to disappear rapidly after 25 weeks. The lateral ventricles and the cisterns around the brain stem and cerebellum are visible and more prominent at this age than in the mature infant; they are relatively smaller at 23 to 24 weeks (Fig. 2-4) than at 18 to 20 weeks (Fig. 2-3). When imaging at 3T, the third and fourth ventricles are easily visualized at this age unless a lot of motion artifact is present; if difficulty is encountered, waiting a few minutes for the fetus to calm down usually results in good images. The globi pallidi typically appear hyperintense on T1-weighted images starting at about 20 weeks. This likely represents premyelination changes, such as the appearance of proteolipid protein in oligodendrocyte processes (47).


Figure 2-4 (Continued) B-E. Axial T2 FSE images through the cerebrum. Note the complete absence of myelination in the white matter at this age and the smaller germinal zones compared with the 20-week fetus illustrated in Figure 2-3. Note also that the subplate and intermediate zones, although still visible, are less conspicuous at this age than at 20 weeks.

Between 24 and 30 weeks, the cerebral cortex shows development of shallow Rolandic (central), calcarine, pericallosal/callosomarginal, interparietal, and superior temporal sulci (Figs. 2-5 and 2-6); in some patients, the precentral, postcentral, superior frontal, and middle temporal sulci may be visualized. The subplate is still seen in the subcortical white matter as a layer of T1 hypointensity/T2 hyperintensity; it becomes difficult to see on imaging in the posterior frontal and


parietal lobes at about 28 weeks but remains visible in less mature areas such as the anterior frontal and temporal lobes for some time thereafter (12,46). Myelination is seen in some brain stem structures during this period, including the median longitudinal fasciculus (MLF; bright at 25 weeks on T1-weighted images, dark at 29 weeks on T2-weighted images), the lateral lemnisci (bright at 26 weeks on T1-weighted images, dark at 28 weeks on T2-weighted images), the medial lemnisci (bright at 27 weeks on T1-weighted images, dark at 30 weeks on T2-weighted images), and the superior and inferior cerebellar peduncles (bright at 28 weeks on T1-weighted images, dark at 29 weeks on T2-weighted images) (48). The basal ganglia and thalami are better seen at this age on MR imaging and have intensity similar to the cerebral cortex on both T1-and T2-weighted images, although not as hyperintense on T1-weighted images or as hypointense on T2-weighted images (Fig. 2-5I-L). The ventrolateral nucleus of the thalamus becomes hypointense compared with the remainder of the thalamus on T2-weighted images by about 25 weeks and hyperintense on T1-weighted images by 27 to 28 weeks, mostly due to its high cellularity and, possibly, to early myelination. The lateral ventricles, particularly the trigones and occipital horns, are less prominent at this age than at 22 to 23 weeks, probably secondary to both growth of the cerebral white matter and development of the calcarine sulci.


Figure 2-5 MR of 28-week fetus (A-D) and of 28-week postconceptional age prematurely born neonate (E-H). A-D are FSE, E-H are SE T1 MR images, and I-L are SE T2 images. Note that sulcation is more advanced in the fetus than in the prematurely born neonate of a similar gestational age. By this age, gyri and sulci other than the sylvian fissure become detectable. The development of shallow Rolandic (central), calcarine, pericallosal/callosomarginal, interparietal, and superior temporal sulci can be visualized. In addition, the germinal matrix is less prominent. The basal ganglia and thalami are better seen at this age and have intensity similar to the cerebral cortex on both T1- and T2-weighted images, although not as hyperintense on T1-weighted images or as hypointense on T2-weighted images. The lateral ventricles, particularly the trigones and occipital horns, are less prominent at this age than at 22 to 23 weeks, probably secondary to both growth of the cerebral white matter and development of the calcarine sulci.


Figure 2-5 (Continued)


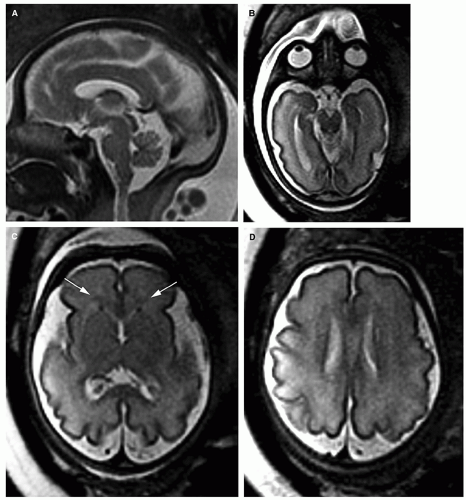
Figure 2-6 MR of normal 31-week fetus (images A-D) and a 31-week postconceptional age premature infant (images E-H are T1 weighted and I-L are T2 weighted). Note that there is not much difference in brain development between the postnatal and prenatal images. More sulci have developed by this age, although they are still rather shallow. The myelinated dorsal brain stem is contrasted by the unmyelinated ventral pons (E and I) and the thalami and globi pallidi are contrasted by the completely unmyelinated internal capsule (F, G, J, and K). The germinal matrix has involuted considerably, but some gray matter signal remains present along the lateral walls of the lateral ventricles, most prominently seen at the tips of the frontal horns (arrows in C, G, and K); this can persist until the end of the 44th gestational week. The cisterns in the occipital region remain prominent (C, G, and H). The signal intensity of the entire cerebral cortex is uniform at this age on both T1- and T2-weighted images. Foci of gray matter intensity are seen just anterior to the tips of the frontal horns of the lateral ventricles (arrows in C), representing foci of residual germinal matrix. Hyperintensity on T1-weighted images and hypointensity on T2-weighted images is present in the dorsal brain stem, superior and inferior cerebellar peduncles, far lateral putamen, and ventrolateral thalamic nucleus. The cerebral white matter still appears completely unmyelinated.


Figure 2-6 (Continued)

By 31 to 32 weeks, an increased number of gyri and shallow sulci become visible in the cerebral cortex of prematurely born neonates (Fig. 2-6). The sylvian fissures retain their immature appearance, although some development of the opercula can be detected. The cisterns around the brain stem and cerebellum remain large at this age, and the cerebrospinal fluid (CSF) spaces in the occipital region and in the interhemispheric fissure remain prominent, although the interhemispheric fissure is more variable in size. The cavum septi pellucidi and cavum vergae are prominent and will remain so throughout the first 40 postconceptual weeks (29,32). The dorsal brain stem (relatively hyperintense on T1-weighted images and hypointense on T2-weighted images) is contrasted by the unmyelinated ventral pons (Fig. 2-6E and I). The thalami and globi pallidi are contrasted by the unmyelinated (relatively hypointense on T1-weighted images and hyperintense on T2-weighted images) internal capsule (Fig. 2-6F and J). The signal intensity of the entire cerebral cortex is uniform at this age on both T1- and T2-weighted images. The subplate is poorly seen on T1-weighted images and is best identified in the anterior temporal lobes on T2-weighted images. The germinal matrix has involuted to a large degree. However, some curvilinear T2 hypointensity is seen extending along the lateral walls of the frontal horns of the lateral ventricles to the medial tip of the frontal lobes and into the olfactory sulci at this age (Fig. 2-6G and K); previously thought to be regions of residual germinal matrix (49), these areas turn out to be migrating GABAergic neurons that are present until about 6 postnatal months (50). The dorsal brain stem and superior and inferior cerebellar peduncles remain bright on T1-weighted images, but the middle cerebellar peduncles remain unmyelinated, isointense to the cerebral white matter. T2-weighted MR shows hypointensity in the dorsal brain stem (predominantly due to the MLF, medial and lateral lemnisci), superior and inferior cerebellar peduncles, nuclei of the inferior colliculi, far lateral putamen, and ventrolateral thalamic nucleus (51) (Fig. 2-6). The white matter of the centrum semiovale still appears completely unmyelinated.


Figure 2-7 Normal 34/35 week premature infant. Images A-F are T1 MR images, and G-L are T2 MR images. More sulci are forming, as can be seen along the interhemispheric fissure and over the convexities. Sulcal development varies considerably at this age. The sylvian fissures have markedly diminished in prominence due to opercular development. Notice that the dorsal brain stem and globi pallidi have increased in signal intensity on the axial T1-weighted MR (A-F). The posterior limb of the internal capsule remains completely unmyelinated at this age. On T2-weighted images, the brain stem nuclei, the periphery of the cerebellar dentate nuclei, and the cerebellar vermis are relatively hypointense structures in the posterior fossa (G and H). The subthalamic nuclei (arrows in I) have become hypointense.

At 34 to 36 weeks, the cerebral cortex has further thickened and more sulci have developed. Little change occurs in the signal intensity of the white matter between 32 and 36 postconceptional weeks (51). On T1-weighted MR, the posterior limb of the internal capsule remains hypointense as compared to the lentiform nucleus (Fig. 2-7C and D); some patients will show a small dot of hyperintensity in the posterior aspect of the posterior limb at 39 weeks (48). On T2-weighted images, the posterior limb of the internal capsule remains entirely hyperintense compared with surrounding structures (Fig. 2-7J). The sylvian fissures and, to a lesser extent, the CSF spaces in the posterior parietal area remain prominent (Fig. 2-7C-E, J, and K). Considerable variation in brain maturity can be seen at this age, some infants having a gyral pattern that resembles a term infant and others still appearing quite immature (29,32).


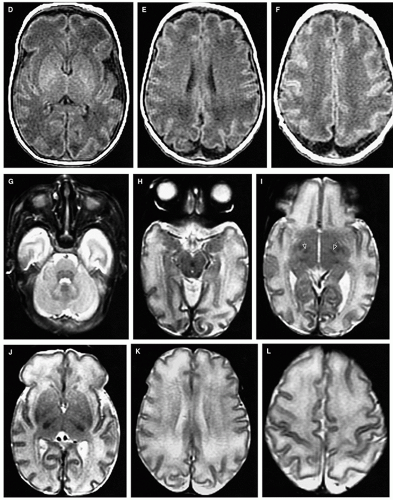
Figure 2-7 (Continued)


By 38 to 40 weeks, the brain has a nearly normal adult sulcal pattern (Fig. 2-8); the sulci are largely formed but are not as deep as they will become in the next several weeks. On T1-weighted MR studies, the dorsal brain stem, posterior portion of the posterior limb of the internal capsule, and the central portion of the corona radiata (the corticospinal tracts) are hyperintense compared to the rest of the brain. On T2-weighted images, the dorsal brain stem is hypointense and, at 39 to 40 weeks, a characteristic spot of hypointensity is present in the posterior limb of the internal capsule, lateral to the hypointense lateral thalamic nuclei. There are few differences between the CT images of a newborn term infant and those of older infants. The frontal white matter and parieto-occipital white matter remain relatively low in attenuation compared to the gray matter (Fig. 2-8A-E). This probably results from the known high water content of the newborn brain, related to the lack of myelination. The MR appearance of the newborn brain, on the other hand, is considerably different from that in older children, as discussed in the following section. The sylvian fissures may remain prominent in the immediate newborn period; the occipital CSF spaces may also remain somewhat large for several months. The cavum vergae and cavum septi pellucidi are usually present at birth; they disappear rapidly in the first few months after birth as the septal leaves fuse from back to front.

The cisterna magna and basilar cisterns are relatively large throughout infancy, as the cerebellum continues to grow considerably (compared to the cerebrum) during the first postnatal year. This enlargement is quite apparent on MR scans but less so on CT where only the axial plane is available and beam hardening artifact frequently obscures details in the basilar cistern area.


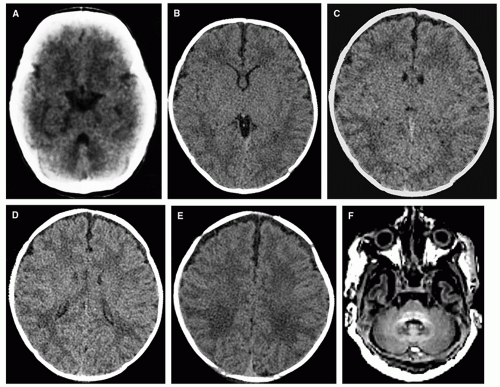
Figure 2-8 CT/MR of normal 38- to 40-week infant. A-E. With the exception of increased lucency of the frontal and temporoparietooccipital white matter, the CT scan of this infant resembles any normal infant during the first year of life. The sulcal pattern is nearly mature. A cavum septi pellucidi is frequently prominent at this age.


Grading of Brain Maturation in Premature Infants

Childs et al. have proposed a scoring system for assessment of brain maturation in premature infants (52). The scoring system takes into account the degree of myelination, extent of sulcation, amount of involution of the germinal matrix of the lateral ventricles, and the character of the band of migrating cells (if present) in the white matter of the brain. This method shows considerable potential for determining whether the brains of neonates are developing properly. However, norms and standard deviations will need to be established for each weekly postconceptional age, and it must be determined whether these scores are sensitive and specific for predicting developmental abnormality.

Another way to assess brain maturation is size. Several authors have performed the service of measuring many structures of the developing fetal brain. A summary of these measurements is listed in Table 2-2. For more extensive lists of measurement, the book by Garel (29) and the paper by Parrazzini (31) are recommended.


Figure 2-8 (Continued) F-J. T1 images show high signal intensity in the dorsal brain stem, the decussation of the superior cerebellar peduncles, the optic tracts, the posterior limbs of the internal capsules, the lateral thalamus, the optic radiations, and the central corona radiata. There is also increased signal intensity in the Rolandic and perirolandic gyri, corresponding to known myelination of the white matter within these gyri shortly after birth. Note that the anteroposterior dimension of the pons is approximately one and a half times that of the midbrain and medulla, this ratio will increase as the corticopontocerebellar tracts continue to develop.


Figure 2-8 (Continued) K-O. T2 images show low signal intensity in the cerebellar vermis, dorsal brain stem, posterior aspect of the posterior limb of the internal capsule, the ventrolateral thalamus, and the perirolandic gyri of the cortex. The T2-weighted images correspond more closely to the temporal sequence of brain myelination as demonstrated with histochemical staining techniques.


Figure 2-8 (Continued) P-T. T2 axial images (P-R) show the arc of migrating neurons (black arrows) extending from lateral to the frontal horns of the lateral ventricles inferomedially into the anteroinferomedial frontal lobes. Coronal image (S) shows the stream of neurons (arrows) migrating toward the top of the olfactory sulcus. Sagittal image (T) shows the arc of migrating neurons coursing parallel to the frontal horn of the lateral ventricle.


Table 2-2 Normal Fetal Brain Measurements (31)


Measurement


20 wk


21 wk


22 wk


23 wk


24 wk


Anteroposterior vermis


Minimum


Median


Maximum


5 mm


6 mm


7 mm


5 mm


7 mm


9 mm


6 mm


7 mm


9 mm


7 mm


8 mm


10 mm


7 mm


8 mm


11 mm


Superoinferior vermis


Minimum


Median


Maximum


8 mm


9 mm


10 mm


8 mm


10 mm


12 mm


8 mm


11 mm


12 mm


9 mm


11 mm


13 mm


10 mm


12 mm


14 mm


Transverse cerebellum


Minimum


Median


Maximum


18 mm


19 mm


21 mm


19 mm


21 mm


23 mm


20 mm


22 mm


24 mm


21 mm


24 mm


27 mm


23 mm


25 mm


28 mm


Length corpus callosum


Minimum


Median


Maximum


16 mm


18 mm


18 mm


16 mm


18 mm


23 mm


17 mm


21 mm


24 mm


17 mm


22 mm


27 mm


23 mm


24 mm


28 mm


Fronto-occipital diameter


Minimum


Median


Maximum


49 mm


52 mm


55 mm


50 mm


56 mm


60 mm


54 mm


58 mm


62 mm


57 mm


63 mm


67 mm


65 mm


67 mm


74 mm


Cerebral biparietal diameter


Minimum


Median


Maximum


37 mm


39 mm


40 mm


36 mm


40 mm


45 mm


40 mm


43 mm


45 mm


41 mm


46 mm


49 mm


47 mm


49 mm


52 mm


Normal Postnatal Brain Development


Maturation

From the perspective of T1 and T2 relaxation times, postnatal brain development consists primarily of changes in signal intensity associated with the process of myelination. A multiparametric imaging approach to assessing brain maturation showed that it correlated well with postmortem studies (53). Postmortem studies showed that myelination of the brain begins during the fifth fetal month with the myelination of the cranial nerves and continues throughout life. Perhaps the best way to think about the maturation of the brain is that myelination progresses more rapidly in functional systems that are utilized in early life than in those that are not utilized until the child is older. In the brain stem, the medial longitudinal fasciculus, lateral and medial lemnisci, and inferior and superior cerebellar peduncles, which transmit vestibular, acoustic, tactile, and proprioceptive sense, are myelinated at birth, whereas the middle cerebellar peduncles, which transmit motor impulses into the cerebellum, acquire myelin later and more slowly. Similarly, in the cerebrum, the geniculate and calcarine (optic), postcentral (somesthetic), and precentral (propriokinesthetic) regions acquire myelin early, whereas the posterior parietal, temporal, and frontal areas, which are association areas that integrate the sensory experience, acquire myelin later (23,54,55,56). On MRI, the sensory and motor pathways mature before association bundles. The spinothalamic tract is the most advanced in maturation, followed by the optic radiations, the middle portion of the corticospinal tract, and the fornix. Most projection bundles (except the anterior limb of the internal capsule) thus mature earlier than limbic, commissural, and association bundles. Within the limbic and commissural bundles, the fornix tends to mature earlier than the cingulum, while the splenium and genu of the corpus callosum seem to mature before the callosal body. The arcuate and superior longitudinal fasciculi, the anterior limb of the internal capsule, and the external capsule all mature late (53). Yakovlev and Lecours (56), staining the brain with the Weigert stain for myelin, showed that myelination proceeds rapidly within the brain up to about of 2 years of age. The process slows markedly after 2 years, although fibers to and from the association areas of the brain in the anterior frontal and anterior temporal lobes continue to myelinate well into the third and fourth decades of life.


Anatomic MRI of Postnatal Brain Development

In general, changes in white matter maturation are seen best on T1-weighted images during the first 6 to 8 months of life and on T2-weighted images between the ages of 6 and 18 months. This generalization mostly holds true as our imaging protocols evolve and our protocols become less purely based on relaxation times. Maturation of both the brain stem and cerebellum seem to be more sensitively assessed on T2-weighted images (57,58,59). We obtain both T1- and T2-weighted axial sequences for imaging patients in these age groups, using parameters described in Chapter 1 (3D spoiled gradient echo sequence for T1-weighted images and fairly heavily T2-weighted images with long repetition and echo times). Other imaging sequences that give heavily T1-weighted and T2-weighted images will work, as well. For example, fast spin-echo T2-weighted sequences will show changes of myelination, although myelination appears slightly more advanced on fast spin-echo than on conventional spin-echo images (60). Although visually apparent signal changes of the white matter seem to be largely complete by about the age of 2 years, measurements of relaxivity have shown that T1 shortening of white matter and gray matter continues into adolescence, probably secondary to continued myelination and consequent diminution of brain water (61). The inability to qualitatively detect this continuing change by conventional MR imaging probably reflects the fact that the relaxation rates of gray and white matter change proportionately; thus, no relative change is appreciated.


T1-Weighted Images

Although many different sequences have been developed to obtain images of the brain using MRI, the changes of white matter maturation are most easily assessed qualitatively, at different rates and at different times, on T1-weighted images than on T2-weighted images. On T1-weighted images, the appearance of the newborn brain is grossly
similar to that of T2-weighted images in adults in that white matter has lower signal intensity than gray matter. As white matter matures, its signal intensity increases relative to gray matter.

Posterior fossa structures that exhibit high signal intensity at birth include the medial lemniscus, lateral lemniscus, MLF, brachium of the inferior colliculus, and the inferior and superior cerebellar peduncles (Fig. 2-8) (59). An increase in signal intensity of the deep cerebellar white matter appears near the end of the first month of life and steadily increases, with high signal intensity developing in the subcortical white matter of the cerebellar folia by the thrid month. At 3 months of age, the cerebellum has an appearance similar to that seen in the adult on both axial and sagittal images. Signal intensity in the basis pontis (ventral pons) increases less rapidly, occurring during the thrid through the sixth months.

In the supratentorial region, the decussation of the superior cerebellar peduncles, the ventral lateral thalamus, the globus pallidus, the posterior portion of the posterior limb of the internal capsule, and the central portion of the corona radiata (the corticospinal tracts) exhibit high signal intensity at birth (Fig. 2-8) (59). In addition, small foci of gray matter intensity are seen just anterior to the tips of the frontal horns of the lateral ventricles in term neonates and premature infants. Formerly thought to represent persistent germinal matrix (49,62), these areas have recently been shown to represent part of a large arc of migrating inhibitory neurons (Fig. 2-8P-T) (50). The development of high signal intensity proceeds rostrally from the pons along the corticospinal tracts into the cerebral peduncles, posterior limb of the internal capsule, and the central portion of the centrum semiovale. The white matter of the pre- and postcentral gyri is of high signal intensity compared with surrounding cortex by about 1 month of age (Fig. 2-9). The change to high signal intensity in the subcortical motor tracts is essentially complete by age 3 months (Fig. 2-10). In infants less than 1 month old, high signal intensity is present in the optic chiasm and optic tracts; by age 3 months, the occipital white matter surrounding the calcarine fissure is of high signal intensity. The posterior aspect of the posterior limb of the internal capsule is of high signal intensity at birth; high signal intensity does not develop in the anterior limb until 2 to 3 months of age. The splenium of the corpus callosum shows high signal intensity in all infants by age 4 months (Fig. 2-10). The increase
in signal intensity proceeds anteriorly; the genu is always of high signal intensity by age 6 months (Fig. 2-11). Typically, at 4 to 5 months of age, the splenium is high in signal intensity, while the genu is low in signal intensity. Maturation of the subcortical white matter, other than the visual and motor regions, begins at 3 months. The deep white matter matures in a posterior-to-anterior direction, with the deep occipital white matter maturing first and the anterior frontal and temporal white matter last. Peripheral extension of increasing hyperintensity of the subcortical white matter continues until approximately age 7 months in the occipital white matter and 8 to 11 months in the anterior frontal and temporal white matter (Fig. 2-12). Only minimal changes are seen on the T1-weighted images after 11 months, consisting of increasing signal intensity in the most peripheral (subcortical) regions of the anterior frontal, anterior temporal, and parietal white matter (23).


Figure 2-9 MR of the brain of a normal 6-week-old. A-E. Axial reformats of 3D T1 MR images show rostral progression of the maturation of the internal capsule. The posterior limbs are usually completely myelinated at this age. F-J. Axial FSE T2 images are relatively unchanged from the neonate. The anteroposterior dimension of the pons has increased relative to the midbrain and medulla as the corticopontocerebellar tracts continue to develop.


Figure 2-9 (Continued)


T2-Weighted Images

The overall appearance of the newborn brain on T2-weighted images is grossly similar to that of adult T1-weighted images in that the white matter has higher signal intensity than the gray matter. On T2-weighted sequences, white matter maturation is seen as a reduction in signal intensity. As stated earlier, T2-weighted images are probably superior to T1-weighted images for assessment of maturation of the cerebellum (63) and brain stem (57).

At birth, low signal intensity is present in the inferior and superior cerebellar peduncles and the cranial nerve nuclei (particularly cranial nerves VI, VII, and VIII) (59). As discussed above, the small foci of gray matter intensity seen just anterior and lateral to the tips of the frontal horns and extending downward to the base of the anterior frontal lobe in premature and term neonates (Fig. 2-8P-T) represent migrating inhibitory neurons that originate in the ganglionic eminences (50); they are a normal finding during the first 2 to 3 months after term birth. The cerebellar vermis (Fig. 2-8K) and the flocculi cerebellum are also of low signal intensity. The ventral brain stem becomes of similar low intensity to the dorsal brain stem at about the fifth postnatal month. The middle cerebellar peduncles begin to decrease in signal intensity during the second month of life and are of uniform low intensity by age 3 months (64). The cerebral peduncles become low in intensity by 4 months and the red nuclei by 5 months (64).
Low signal intensity is seen in the subcortical white matter of the cerebellar folia during the fifth to eighth month and the cerebellum reaches an adult appearance at approximately 18 months.


Figure 2-10 MR of the brain of a normal 4-month-old. A-E. T1 images show rostral progression of the maturation of the internal capsule; the anterior limbs of the anterior capsule are now well myelinated. The splenium of the corpus callosum should always have high signal intensity by this age. Notice the isointensity of the cortical gray matter and subcortical white matter, resulting in difficulty in the identification of structural abnormalities at this age on T1-weighted images. F and G. Note the relative lack of change on the T2-weighted image from the neonate (Fig. 2-8).

Supratentorial structures that show low signal intensity at birth include the decussation of the superior cerebellar peduncles, the medial and lateral geniculate bodies, the subthalamic nuclei, the ventral lateral regions of the thalami, a small patch of the posterior portion of the posterior limbs of the internal capsules, and a small linear region in the lateral putamina (59). By less than 1 month of age, the cortex in the pre- and postcentral gyri has lower intensity than the surrounding cortex (Fig. 2-8). By age 2
months, patches of low signal intensity are seen in the central centrum semiovale; this makes it difficult to distinguish white matter from the surrounding cortex because both have low signal intensity. By age 4 months, the intensity of the pre- and postcentral gyri is indistinguishable from that of adjacent gyri, which have also diminished in signal intensity (Fig. 2-10). Low signal intensity is seen in the optic tracts at birth in some patients and at age 1 month in most; the decrease in signal intensity extends posteriorly along the optic radiations during the subsequent 2 months; by 4 months of age, the calcarine fissure shows some low signal intensity. By age 4 months, the globi pallidi are slightly hyperintense compared to the putamina; they will remain hyperintense until 8 to 10 months, when the globi pallidi and putamina become isointense again.

Most deep white matter tracts of the cerebrum decrease in signal intensity between 6 and 12 months of age (Figs. 2-11 and 2-13). The internal capsule matures in a posterior-to-anterior fashion. The more anterior portion of the posterior limb contains a thin strip of hypointensity by approximately 7 months; progressive thickening of the hypointense area continues up to 10 months of age. The anterior limb of the internal capsule is completely hypointense by 11 months in normal patients; hypointensity can be detected as early as 7 months in some patients but is always preceded by the presence of low signal intensity in the posterior limb. The corpus callosum matures grossly from posterior to anterior; the inferior portion of the splenium (most of which is actually the hippocampal commissure) may change earlier, but most of the splenium shows low signal intensity by age 6 months and the genu by age 8 months (Figs. 2-11 and 2-12). The basal ganglia begin to diminish in signal intensity relative to the subcortical white matter at 5 to 7 months of age. This appearance gradually fades as the surrounding brain decreases in signal intensity as a result of myelination. The basal ganglia appear essentially isointense with the subcortical white matter by the age of approximately 10 months. The globus pallidus will become hypointense with respect to white matter again around the end of the first decade of life; this decrease in intensity results from iron deposition, which will be described later in this chapter.


Figure 2-11 MR of the brain of a normal 6-month-old. A-E. T1 images show further progression of brain maturation. Both the splenium and the genu of the corpus callosum are of high signal intensity at this age. There has been progression of the maturation of the centrum semiovale with increasing hyperintensity of subcortical white matter, most notably in the occipital and paracentral regions.


Figure 2-11 (Continued) F-J. T2 images reveal a diminution of signal intensity within the centrum semiovale. Additionally, there is a relative decrease in the signal intensity of the basal ganglia with respect to the surrounding brain. The splenium of the corpus callosum is of low signal intensity at this age and there are patches of low signal intensity within the callosal genu.

The subcortical white matter (other than in the calcarine and Rolandic areas) matures last, proceeding from the occipital region anteriorly to the anterior frontal and temporal lobes. In the past, subcortical white matter maturation was described as being complete by about 24 months (23). With improved signal-to-noise and thinner imaging sections on modern MR scanners, some unmyelinated subcortical white matter can still be detected a bit later, but it is still essentially complete by 30 months. Myelination of deep white matter begins at 9 to 12 months of age in the occipital lobe and at 11 to 14 months frontally (Figs. 2-13 and 2-14); deep white matter in the anterior temporal lobe matures last. Extension of the low signal intensity into the subcortical white matter begins at about 1 year in


the perirolandic region and gradually extends into the subcortical white matter in the subfrontal and anterior temporal regions; the process is essentially complete, even on modern images, by 24 to 28 months (Figs. 2-15 and 2-16). Thus, with the exception of the so-called terminal zones (see following section), white matter maturation, as assessed by visual inspection of MR imaging (quantified parameters, such as relaxation times and diffusion metrics, continue to evolve), is complete in the middle of the third year of life. During the progress of the peripheral extension of the low signal intensity within the white matter, the mantle of gray matter gives the appearance of progressive thinning, and the subcortical white matter often has a heterogeneous appearance.


Figure 2-12 MR of the brain of a normal 8-month-old. A-E. T1 images at this age show essentially an adult appearance at first inspection. Hyperintensity of the subcortical white matter tracts is seen in the paracentral and occipital regions but is not yet present in the frontal or parietal regions. F-J. On T2-weighted images, the anterior limbs of the internal capsule are starting to show diminished signal intensity. Both the splenium and the genu of the corpus callosum are of low signal intensity at this age. The white matter in the occipital and paracentral regions is now isointense with the overlying cortex.


Figure 2-12 (Continued)


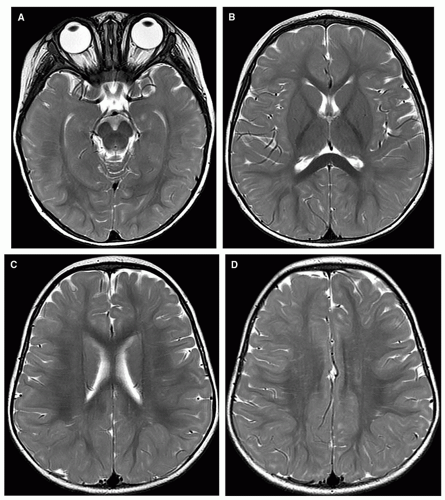
Figure 2-13 T2-weighted MR of the brain of a normal 12-month-old. A-D. There is increasing low signal intensity of the white matter in the paracentral and occipital regions. The images are otherwise very similar to the 10-month-old infant.


Terminal Zones

As maturation in the centrum semiovale progresses, nearly all subjects have persistent areas of high signal intensity in the white matter lateral to the bodies of the lateral ventricles and, more prominently, dorsal and superior to the ventricular trigones on T2-weighted images (Fig. 2-17A-C). The areas may be homogeneous or they may be patchy (and made more so by dilated perivascular spaces that are common in this region [Fig. 2-17D-F]). They are more difficult to identify on the first echo of the long TR sequence than on the second and usually appear isointense to surrounding white matter on a proton density image; they may be visible on FLAIR images, depending upon the exact imaging parameters and machine. The primary cause of this high signal intensity is probably the known delayed myelination of the fiber tracts involving the association areas of the posterior and inferior parietal and posterior temporal cortex. As noted above, large perivascular spaces probably contribute to the high signal intensity, particularly in the peritrigonal area (see subsequent paragraph in this section). Yakovlev and Lecours called these regions the “terminal zones” because some of the axons in these regions do not stain for myelin until the fourth decade (56). These areas of persistent high signal intensity are seen throughout the first decade and, in some patients, into the second decade of life.


Figure 2-14 T2-weighted MR of the brain of a normal 15-month-old. A-D. The maturation of the deep white matter has progressed significantly since the 12-month-old stage. Although somewhat patchy, the subcortical white matter is now hypointense in a great deal of the cerebrum. The maturation of the white matter is slowest in the frontal and temporal lobes.


Figure 2-15 T2-weighted MR of the brain of a normal 22-month-old. A-D. The appearance of the brain is essentially identical to that of an adult. Notice, however, that there is still some patchy high signal intensity in the anterior frontal white matter and in the white matter parallel to the lateral ventricles. This is most prominent dorsal to the bodies and trigones of the lateral ventricles.


Figure 2-15 (Continued)


Figure 2-16 T2-weighted MR of the brain of a normal 24-month-old. A-D. The brain has a near adult appearance with minimal patchy high signal in the anterior frontal white matter, diminished from the 20-month-old.


Figure 2-17 Terminal zones and large perivascular spaces. A-C. Axial (A), coronal (B), and FLAIR (C) images show persistent increased signal intensity lateral, superior, and posterior to the lateral ventricles (arrows), particularly in the region of the trigones. These regions probably represent areas of known slow myelination within the brain (sometimes called “terminal zones”) and should not be mistaken for areas of ischemia or brain damage. They are seen from about age 16 months until age 10 years. D-F. T1 (C) and mildly and more strongly T2-weighted (D and E) images show curvilinear periventricular areas that are isointense to CSF on all imaging sequences. This is the classic appearance for perivascular spaces. G and H. Axial T2-weighted 4-mm thick image (G) shows hyperintensity (white arrow) in the white matter of the superior frontal gyrus. On this image, it is difficult to differentiate from a mass or injury. Higher-resolution imaging using a steady-state sequence with 1-mm imaging shows clearly the presence of multiple small perivascular spaces (large white arrow). Note a similar, smaller area in the parietal lobe (smaller white arrow).


It is important to differentiate the terminal zones from white matter injury resulting from prematurity (see Chapter 4), hydrocephalus (see Chapter 8), and metabolic disorders (see Chapter 3); all can be associated with areas of T2 hyperintensity in the peritrigonal region. In general, the white matter injury of prematurity is more sharply defined and is situated more inferiorly, lateral to the trigones and near the optic radiations. Injured white matter is of very high intensity and is typically bright on FLAIR images and on “proton density” (long TR [>2 seconds] short echo time [TE] [<60 ms]) sequences. More importantly, white matter injury is commonly associated with loss of brain tissue, typically resulting in irregularity of the ventricular wall; abnormally deep cortical sulci, with the cortex sometimes extending down to the ventricular surface; and thinning of the posterior body or splenium of the corpus callosum (see examples of white matter injury of prematurity in Chapter 4). The difficult differentiation between normal areas of peritrigonal high signal intensity and white matter injury of prematurity is aided by identification of a layer of myelinated white matter between the trigone of the ventricle and the terminal zones in normal patients (Fig. 2-17C) (65). When the peritrigonal high signal is due to periventricular leukomalacia, this layer of normally myelinated white matter is absent. Differentiation from hydrocephalus is made easier when a shunt or third ventriculostomy (see Chapter 8) can be detected on the MR study (or when ventricles are still enlarged from unshunted hydrocephalus). White matter disease due to metabolic disorders is typically much more extensive than peritrigonal; details are described in Chapter 3.


Large Perivascular Spaces

Another condition that can mimic both the terminal zones and periventricular leukomalacia on MR is enlargement of perivascular spaces; these may be seen in the periventricular white matter (sometimes within the terminal zones), in the deep white matter (Fig. 2-17D-F), or in the subcortical white matter (Fig. 2-17G and H); the high signal of the perivascular spaces may contribute to the T2 hyperintensity of the terminal zones, which are commonly seen with modern, high-quality MR studies. With thin section volumetric T1-weighted images, Groeschel et al. (66) were able to identify them in 125 out of 125 normal volunteers below the age of 30 years; with routine 5- to 6-mm sections, they were identified in 80% of a group of pediatric clinical scans. Focally expanded or “dilated” perivascular spaces, as defined by Groeschel et al. (66), are seen in 1.5% to 3% of normal subjects. Although most patients with dilated perivascular spaces, and even those with “giant” perivascular spaces (66), are neurologically normal, evidence has been presented that affected patients have a higher incidence of neuropsychiatric disorders than the general pediatric population (67).


Milestones

Just as sulcation develops in an orderly manner, white matter signal changes associated with maturation and myelination of axons appear as shortening of T1 and T2 relaxation times in an orderly and predictable manner (23). These should be assessed on all brain MRIs of infants and young children (Table 2-3). As the white matter matures, T1 shortening occurs, resulting in increasing hyperintensity of the white matter on T1 images, and is followed by T2 shortening, which results in decreasing signal intensity (23,68); these changes vary little with field strength or specifics of the sequence (conventional spin echo, fast spin echo, inversion recovery, spoiled gradient echo, etc.) as long as the sequence is related to T1 and T2 relaxation. During the first 6 months of life, T1-weighted images are most useful for assessing normal brain maturation. On T1-weighted images, high signal intensity should appear in the anterior limbs of the internal capsules and should extend distally from deep cerebellar white matter into the cerebellar folia, by 3 months of age. The splenium of the corpus callosum should be of moderately high signal intensity by the fourth month, and the genu of the corpus callosum should be of high signal intensity by age 6 months. An essentially adult pattern is seen by approximately 8 months of age with the exception that some of the most subcortical white matter fibers (particularly in the anterior frontal and anterior temporal lobes) have not acquired high signal intensity. After age 6 months, T2-weighted images are more useful in the assessment of normal brain maturation. On T2-weighted images, the splenium of the corpus callosum should be of low signal intensity by 6 months of age, the genu of the corpus callosum by 8 months of age, and the anterior limb of the internal capsule by 11 months of age. The deep frontal white matter should be of low signal intensity by age 14 months. With the exception of the subcortical white matter, the entire brain should have an adult appearance by 18 months, and the subcortical white matter should be mature by about 30 months.


Table 2-3 Ages When Changes of Myelination Appear


Anatomic Region


T1-Weighted Images


T2-Weighted Images


Superior cerebellar peduncle


28 gest wk


37 gest wk


Median longitudinal fasciculus


25 gest wk


29 gest wk


Medial lemnisci


27 gest wk


30 gest wk


Lateral lemnisci


26 gest wk


27 gest wk


Middle cerebellar peduncle


Birth


Birth to 2 mo


Cerebral white matter


Birth to 4 mo


3-5 mo


Posterior limb internal capsule


Anterior portion


First month


4-7 mo


Posterior portion


36 gest wk


40 gest wk


Anterior limb internal capsule


2-3 mo


7-11 mo


Genu corpus callosum


4-6 mo


5-8 mo


Splenium corpus callosum


3-4 mo


4-6 mo


Occipital white matter


Deep


3-5 mo


9-14 mo


Subcortical


4-7 mo


11-15 mo


Midfrontal white matter


Deep


3-6 mo


11-16 mo


Subcortical


7-11 mo


14-18 mo


Anterior frontal white matter


Deep


5-8 mo


12-18 mo


Subcortical


10-15 mo


24-30 mo


Centrum semiovale


2-4 mo


7-11 mo


Gest wk, gestational weeks; mo, month.


Other Approaches to Brain Maturation by MR

Many different approaches have been used to grade brain maturation according to the changes in T1 and T2 relaxation. Some authors (68,69,70,71) have been largely descriptive. Others (23,72) have tried to quantify myelination and create milestones of normal myelination by which delayed myelination can be identified using quantitative diffusion techniques (73,74,75,76) or magnetization transfer (77), but these techniques, which are valuable for research, are not practical in everyday practice. Dietrich et al. (78) approached the subject of normal brain maturation
by dividing the appearance of the brain on T2-weighted spin-echo images into three patterns: (a) infantile (birth to 6 months), (b) isointense (8-12 months), and (c) early adult (10 months onward). In the infantile pattern, the cerebral white matter is hyperintense relative to gray matter, whereas the adult pattern shows hypointense white matter. The appearance of the isointense and early adult patterns is delayed in patients with developmental delay. A similar, but more complex, staging system, dividing brain maturation into five stages, has been proposed by Staudt et al. (79,80) Bird et al. (81) determined that the gray and white matter should be isointense by age 4 months on T1-weighted images and by 9 to 10 months on T2-weighted images. They considered the age at which gray and white matter are isointense as a critical factor in evaluating patients for developmental delay. Some authors have analyzed the images in terms of patterns and attempted to assess degree of, and delay in, maturation on the basis of the pattern (57,58,82,83,84). We choose to assess maturation through the use of the normal milestones described above, as it is a rapid and reliable method that does not require any postprocessing of the imaging data. Indeed, any of the methods described above are easy to use and reliable.

A number of studies (85,86) have postulated the existence of a window of time during which delayed myelination can be detected by MR. This window seems to be between the ages of 4 months and 2 years. Delayed myelination can be detected in children older than 24 months only when it is severe.


Normal Postnatal MR Development of the Corpus Callosum

The embryological development of the corpus callosum is discussed in Chapter 5. Briefly, the corpus callosum is composed of axons from the developing cerebral hemispheres that cross the midline after the interhemispheric fissure has been degraded and remodeled by astroglia from both sides of the interhemispheric fissure (87). These axons initially cross the midline in two areas, one near the foramina of Monro, at a point that will eventually be the junction of the callosal genu and body, and the other in the hippocampal commissure, the axons of which act as guides that are followed by axons forming the callosal splenium (87,88). Specialized groups of midline glial cells form a bed for ingrowth and midline crossing of the callosal fibers (87); axons will not cross if the proper substrates are not present in the interhemispheric fissure (88,89,90,91). The earliest pioneer axons cross at approximately 12 weeks; the last axons cross the midline at 18 to 20 weeks of gestation. Although all the components of the corpus callosum are present by 20 weeks, growth of the structure is far from complete. From 20 weeks to term, the length increases by 25%; the thickness of the body increases by 30% and the genu by 270% (92). The length of the corpus can be measured postnatally by cranial ultrasound and has been found to grow an average of 0.11 mm/d (range 0.05-0.29), with the rate being similar for infants born at all gestational ages (93). As all of the callosal axons are presumed to be present at the time of birth, the postnatal callosal growth presumably directly reflects the myelination of the axons. Because the corpus callosum is easily evaluated by magnetic resonance imaging and transfontanelle sonography, an understanding of the normal appearance of the developing corpus is essential to the proper interpretation of imaging studies of neonates and infants.

The appearance of corpus callosum is quite different in the fetus and preterm infant than the term neonate and different in the term neonate and infant than in the adult. An adult appearance evolves slowly over the first 10 to 12 months of life. In the fetus and preterm neonate, the corpus callosum is hypointense compared with cortical gray matter on T1-weighted images and isointense with surrounding brain on T2-weighted images; it may be extremely thin and is of nearly uniform size and, therefore, may be difficult to see on routine sagittal images, particularly in fetuses of gestational age less than 20 weeks (Fig. 2-18A-C). In the near-term and term infant, the corpus is always visible on good images and the signal intensity approaches that of cortical gray matter on T1-weighted images. The callosal shape at this age is thin and relatively flat; the bulbous enlargements seen at the adult genu and splenium are not yet present (94) (Fig. 2-18D and E). The first postnatal change is a substantial, albeit variable in time, thickening of the posterior genu, which frequently occurs as early as the second and third months of life. It has been shown that, in the normal brain, the axons crossing through the posterior genu come from the posterior-inferior frontal and anterior-inferior parietal regions (95,96). The enlargement of the genu, therefore, presumably relates to the myelination of the interhemispheric connections of the inferior portions of the precentral and postcentral gyri; these areas, which are involved with basic motor and sensory function, develop early in life.

The splenium, as seen on sagittal images, contains both components of the corpus callosum (the true splenium, located dorsal and posterior) and of the hippocampal commissure (the psalterium, located ventral and rostral). At birth, the splenium is intermediate in size between the body and the genu of the corpus callosum. It enlarges slowly until the fourth or fifth postnatal month and then rapidly increases in size (Fig. 2-18F and G). Note that the caudal tip of the splenium at this month is slightly hyperintense (Fig. 2-18F and G, white arrows); this is actually the hippocampal commissure, connecting the fornices, which is located caudal and a little rostral compared with the transhemispheric axons of the splenium. By the end of the seventh month, the splenium is equal in size to the genu; it then gradually enlarges in proportion with the genu and the rest of the brain through the remainder of the first year (94) (Fig. 2-18H and I). By about 9 to 10 months, the appearance of the corpus callosum becomes similar to that in the adult (Fig. 2-18J). The splenium enlarges (mainly from myelination of the axons) and the axons within it, arising from the visual and visual association areas of the cortex, turn hyperintense on T1 images (Fig. 2-18H and I) (95,97). Not surprisingly, the rapid development of the splenium corresponds temporally with increasing visual awareness at 4 to 6 months of age. It is during this period that the infant develops binocular vision and visual accommodation and begins to identify objects (98). Both binocular vision and object identification are dependent on interhemispheric connection. Thus, both the enlargement and the T1 shortening of the splenium relate to the myelination of axonal connections between the visual cortex and the association areas of the brain in the increasingly visually aware child.

Only gold members can continue reading. Log In or Register to continue

Stay updated, free articles. Join our Telegram channel

Nov 11, 2018 | Posted by in NEUROLOGICAL IMAGING | Comments Off on Normal Development of the Fetal, Neonatal, and Infant Brain, Skull, and Spine

Full access? Get Clinical Tree

Get Clinical Tree app for offline access