Fig. 2.1
Homogeneous appearance of femoral head cartilage in a 6-month-old. (a) Coronal T1-weighted (T1-W) image shows the epiphysis (asterisk) is of homogeneous intermediate signal intensity. (b) Coronal gradient echo (GRE), fast field echo (FFE) image shows moderately hyperintense cartilage signal, along with a small amount of very hyperintense joint fluid (white arrow) on the left. Note cartilaginous triradiate cartilage (black arrowheads), which has similar signal intensity to the femoral head
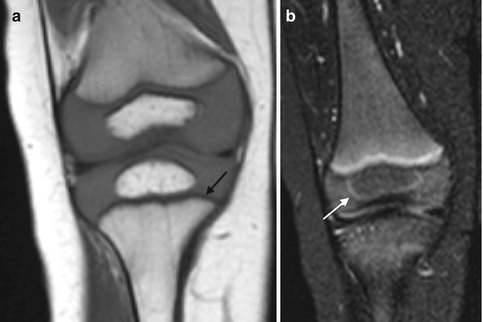
Fig. 2.2
Normal infant knee. (a) Coronal T1-W image shows the growth plate and epiphyseal cartilage have homogeneous intermediate signal. The zone of provisional calcification (ZPC) is hypointense (arrow) adjacent to the hyperintense metaphysis. (b) Coronal STIR image shows the primary physis is hyperintense, compared to the intermediate signal epiphyseal cartilage. The secondary physis, surrounding the epiphyseal ossification center, is also hyperintense (arrow) but much thinner than the primary physis (Courtesy of Marilyn Ranson)
Fluid-sensitive sequences, such as short tau inversion recovery (STIR) and T2-weighted (T2-W) (especially fat-suppressed (FS) sequences), characterize cartilage architecture better than T1-W sequences (Fig. 2.3). On these fluid-sensitive sequences, signal intensity of physeal and articular cartilage is higher than that of epiphyseal cartilage, probably due to increased cellularity and free water in the growth plate cartilage compared with epiphyseal cartilage. Because the physeal cartilage has longer T2 values, increasing the echo time (TE) enhances the contrast between epiphyseal and physeal cartilage. 3D dual-echo steady-state imaging (3D-DESS) is also useful for imaging cartilage, improving the accuracy of cartilage thickness assessment (Fig. 2.4). Regardless of the sequence employed, adequate spatial resolution is essential for satisfactory imaging of cartilage.
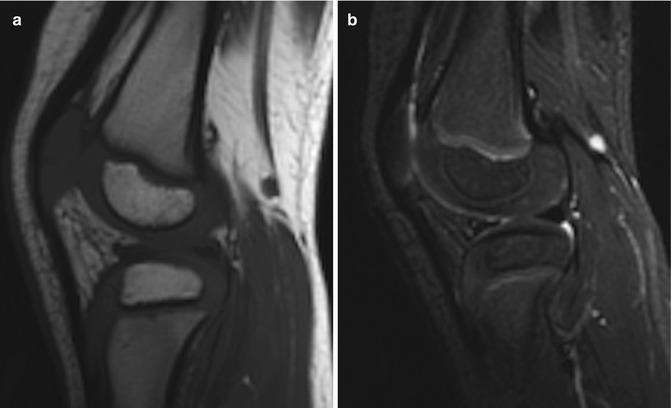
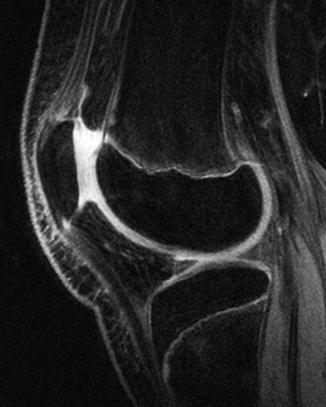
Fig. 2.3
Epiphyseal cartilage in a 4-year-old boy. (a) Sagittal T1-W image shows uniformly isointense cartilage (compared to muscle). (b) Sagittal inversion recovery (IR) image shows isointense signal intensity (compared to muscle) in the cartilage surrounding the ossified epiphysis and hyperintense physeal cartilage (Courtesy of Rebecca Stein-Wexler)
Fig. 2.4
Epiphyseal cartilage contrasted against joint fluid on sagittal 3D double-echo steady-state (3D-DESS) image of the knee in a 13-year-old boy. The epiphyseal and articular hyaline cartilage is slightly less bright than the joint fluid
With development, the cartilage changes in several ways. Epiphyseal cartilage evolves from its infantile appearance of uniform intermediate signal on T1-W images and moderate hyperintensity on fluid-sensitive sequences [12]. As ossification begins, fluid-sensitive sequences demonstrate patchy, heterogeneous (more hyperintense) areas, likely due to increased free water. These are most evident at the posterior distal femoral condyle and the trochlea of the distal humerus, but are also seen elsewhere [14] (Fig. 2.5). Cartilage at weight-bearing areas (e.g., the acetabulum and the distal and proximal femur) develops decreased T2 signal as the child begins walking, probably as water is displaced from cartilage [15] (Fig. 2.6).
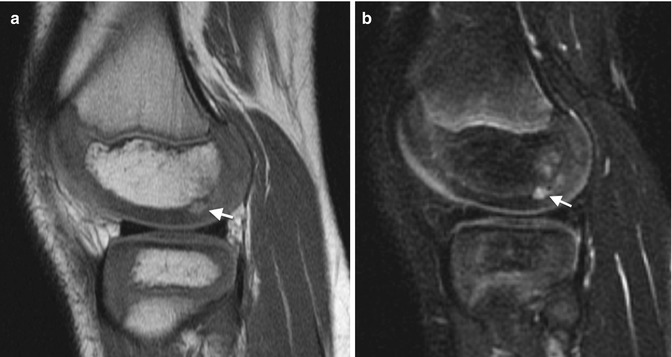
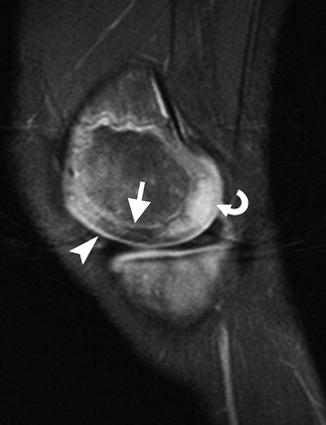
Fig. 2.5
Normal hyperintense pre-ossification centers within epiphyseal cartilage. Sagittal PD (a) and fast spin echo (FSE) T2-W FS (b) show pre-ossification (arrows) (Courtesy of Marilyn Ranson)
Fig. 2.6
Morphological changes in cartilage with maturation in a 6-year-old boy. Sagittal T2-weighted (T2-W) image with fat-suppressed (FS) knee image shows the weight-bearing epiphyseal cartilage of the femoral condyle has a relatively low signal, likely related to displacement of water from cartilage (arrow). A focus of increased signal in the posterior epiphyseal cartilage of femoral cartilage (curved arrow) likely represents the hyperintense fluid condensation that can be seen prior to the onset of ossification. In addition, the hyperintense articular cartilage (arrowhead) contrasts against the more intermediate signal of the epiphyseal cartilage
The physeal cartilage at both the primary physis and at the peri-epiphyseal secondary physis has specific architecture that yields a trilaminar appearance on MRI (Figs. 2.7 and 2.8). The portion that abuts the metaphysis, the zone of provisional calcification, is densely mineralized and thus markedly hypointense on all sequences. The remainder of the physeal cartilage, like the articular cartilage, resembles unossified epiphyseal cartilage on T1-W images and is predominantly hypointense. However, on fluid-sensitive sequences, this portion of the physis (the germinal and proliferative zones as well as part of the hypertrophic zone) is brighter than epiphyseal cartilage, yielding the second identifiable layer [13]. The physis that surrounds the ossification center in the epiphysis, the secondary physis, has similar architecture and signal intensity but is thinner.
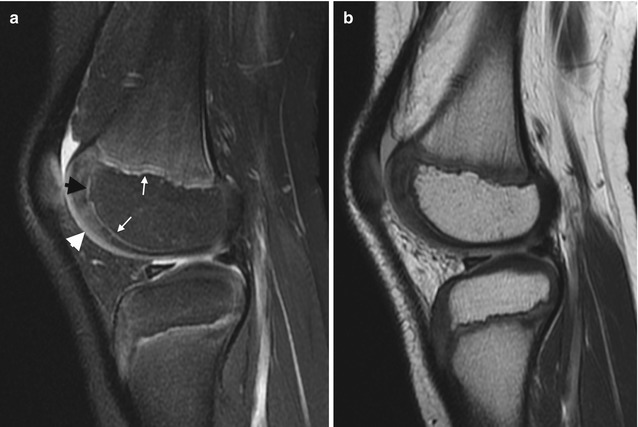
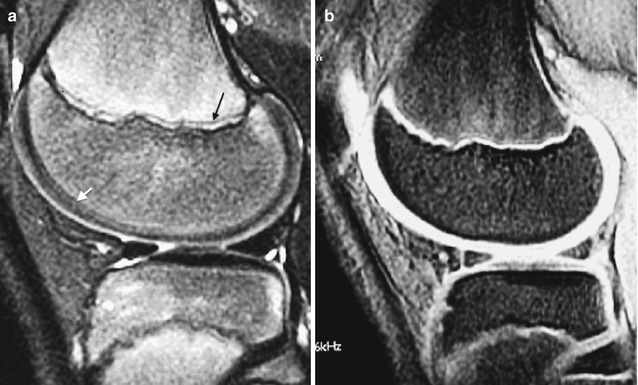
Fig. 2.7
Normal appearance of physeal, epiphyseal, and articular cartilage in a 7-year-old boy. (a) Sagittal PD FS image shows hypointense ZPC (white arrows), moderately hyperintense physeal cartilage (black arrowhead), and moderately hyperintense articular cartilage (white arrowhead). The ossified portion of the epiphysis is hypointense, and the remainder of the epiphyseal cartilage is heterogeneously hyperintense. (b) Sagittal PD image also demonstrates the various cartilage regions (Courtesy of Rebecca Stein-Wexler)
Fig. 2.8
Normal appearance of cartilage in an adolescent knee. (a) Sagittal FSE T2-W FS image shows trilaminar appearance with hyperintense metaphyseal spongiosa, hypointense ZPC (black arrow), and hyperintense physis. The epiphyseal cartilage (white arrow) has lower signal than articular cartilage. (b) Sagittal multiplanar T1-W GRE image shows uniformly bright cartilage signal (Courtesy of Marilyn Ranson)
Epiphyseal ossification begins in a single ossification center (as at the distal femur), in two centers (as at the proximal humerus), or in several centers (as at the trochlea of the distal humerus). The contour may be irregular. Normal signal intensity at MRI helps differentiate multiple ossification centers from fragmentation of a single center. If there is a single focus of ossification, ossification begins in the center of the epiphysis. Initially spherical, as endochondral bone forms, the shape changes to hemispheric, with the flat portion adjacent to the primary physis [16]. Although epiphyseal marrow is initially, like the adjacent metaphysis, hematopoietic, within a few months it becomes uniformly fatty (see Chap. 25).
Development of carpal bones, tarsal bones, and apophyses is similar to that of epiphyses. They therefore also demonstrate conversion to fatty marrow much sooner than do the metaphyses of long bones.
In very young children, the primary physis is flat and smooth, but with growth its contour begins to undulate [8]. It should still have uniform thickness, unless it has been damaged (e.g., after fracture or as a result of chronic stress in athletes). The physis thins with maturation and eventually fuses and disappears, sometimes leaving a very thin hypointense linear scar. Physeal fusion usually begins in the center of the physis and spreads to the periphery. The exception to this is at the distal tibia, where the anteromedial physis fuses first (at Kump’s bump) and fusion progresses posterolaterally.
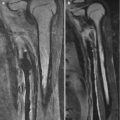
Epiphyseal cartilage is initially perfused by vessels within cartilage canals; these gradually become smaller and less numerous. Vascularization is most readily appreciated after administration of intravenous gadolinium, on fat-suppressed T1-W images. The vascular channels of the cartilaginous epiphysis exhibit linear and punctate areas of high signal intensity (the punctate areas are vascular channels viewed on end). Before the age of 18 months, some channels cross from metaphysis to epiphysis, and vascular canals are arrayed parallel to each other and to the long axis of the bone. As the secondary ossification center develops, the orientation of the vascular channels changes, so that they are arrayed in a spoke-like fashion around the ossifying epiphysis [9] (Fig. 2.9). During most of childhood, metaphyseal and epiphyseal blood flow are separate, with important consequences for trauma as well as spread of infection and tumor.
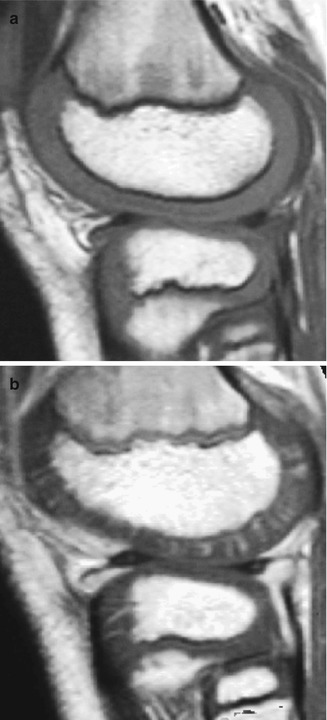
Fig. 2.9
Radiating array of epiphyseal vessels in a young child. (a) Sagittal T1-W MRI shows homogeneous intermediate signal of the epiphyseal and articular cartilage. (b) With GRE, radiating vascular channels are evident. The physes also enhance (Courtesy of Marilyn Ranson)
Gadolinium-enhanced sequences allow definition of the fibrovascular cuff and the primary spongiosa of new bone formation; it also delineates the posterior metaphyseal stripe, which is a subperiosteal band of fibrovascular tissue that contributes to growth (Fig. 2.10). In older patients, specialized MRI techniques such as delayed gadolinium-enhanced MRI (dGEMRIC) and T2 mapping allow visualization of the four unique zones of articular cartilage: superficial or tangential, middle or transitional, deep or radial, and calcified [11]. In higher field-strength magnets, 3D isotropic techniques can be applied to cartilage imaging [17].
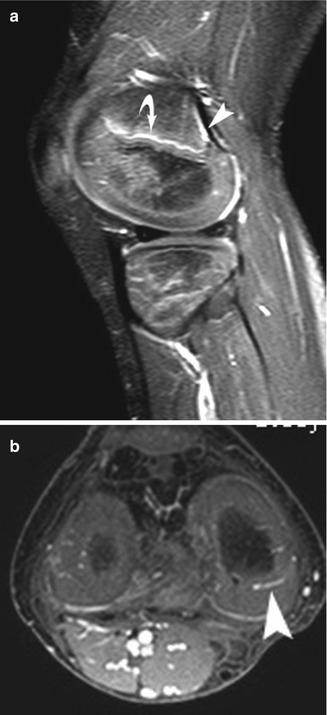
Fig. 2.10
Normal appearance of epiphyseal vasculature in a 6-year-old. Gadolinium-enhanced T1-W fast field echo (FFE) fat-suppressed (FS) MRI shows, on sagittal view (a), enhancement of the primary spongiosa of new metaphyseal bone (curved arrow). There is also enhancement of the subperiosteal fibrovascular tissue that forms the posterior metaphyseal stripe (arrowhead). (b) Axial image shows typical spoke-wheel pattern of vascular channels in the epiphyseal cartilage (arrowhead)
3 Physiologic Periostitis of Infancy (Box 2.1)
Box 2.1: Physiologic Periostitis of Infancy
1–4 months old (residual findings occasionally seen to 6 months old) |
Bilateral in 40–70 % |
Frequency: tibia > femur > humerus > ulna > radius |
<2 mm thick |
Diaphysis |
Physiologic periostitis of infancy is a normal physiologic process wherein new bone forms rapidly by intramembranous ossification along the periosteum of the diaphysis of long bones. This can be identified in one third to one half of infants between 1 and 4 months of age. The residual finding of subperiosteal bone blending into cortex can be seen occasionally as late as 6 months of age [18]. Periosteal new bone results from the rapid growth that is characteristic of early infancy, combined with the fact that in children the periosteum is relatively thick and loosely attached. It generally involves both the upper and lower extremities [19] and is bilateral in 40–75 % (especially at the femur) [18]. The tibia is affected most often, followed by the femur, humerus, ulna, and radius.
The periosteal new bone initially appears as a faint amorphous line paralleling the diaphysis of the long bone, separated from the cortex by a thin lucent line. Not necessarily concentric, it may be seen on only one projection (Fig. 2.11). As the child grows, the layer of new bone thickens and becomes denser, briefly resembling a double cortex. It is gradually absorbed into the cortex, where it contributes to bone width.
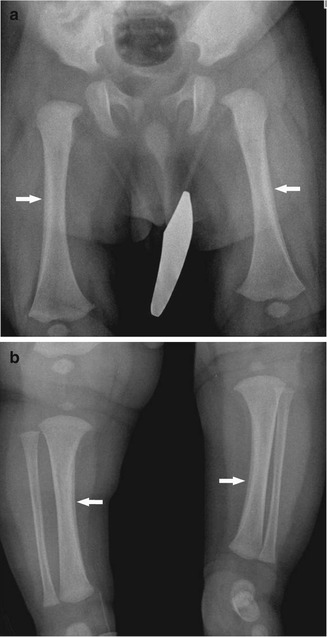
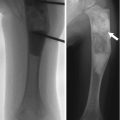
Fig. 2.11
Physiologic periostitis of infancy in a 2-month-old boy. Frontal views show bilateral lamellar bone formation (arrows) along the lateral diaphyseal cortex of both femurs (a) and along the medial diaphyseal cortex of both tibias (b)
Physiologic periostitis is differentiated from pathologic periostitis by its thinness (less than 2 mm), by the fact that it spares the metaphysis, and by the typical age at presentation, 1–4 months [18]. It should not be confused with osteomyelitis, infantile cortical hyperostosis, trauma, vitamin A intoxication, leukemia, or metastatic neuroblastoma.
4 Skeletal Maturation
Assessment of skeletal maturity is important in several clinical scenarios: in the setting of a suspected hormonal abnormality (e.g., precocious puberty), to help predict adult height (especially important in children with short stature), and to determine appropriate timing of surgery for scoliosis or for leg-length discrepancy. Radiologic assessment of skeletal maturity relies on evaluation of mineralization, maturation, and morphology of the ossification centers and comparison of these observations to standards.
Many methods of bone age assessment have been developed, but they are plagued by questions about accuracy, statistical validity, and interobserver variability [20, 21]. Furthermore, there are marked sexual, racial, familial, and environmental influences on bone development. For example, the sequence of ossification in the hand and wrist varies such that the triquetrum may ossify in any order ranging from the 3rd to the 24th of the 28 centers [22]. Some standards are based on a specific population group and do not necessarily apply to others [21, 23]. Girls differ from boys, not only in their advanced maturity but also in the order of ossification, and black infants are more skeletally mature than white infants. Therefore it is important to consider the standards as approximations and to always include a range of two standard deviations in estimating bone age. Computer-assisted measurement appears to increase statistical power [24].
Skeletal maturity in different parts of the body can be discordant, and this affects timing of surgical intervention. Discrepancy may be striking in the hand and wrist, where carpal maturation may lag behind or precede phalangeal maturation by several years. This can be syndromic or associated with disease but is more often inconsequential. However, up to 40 % of patients demonstrate a 1-year difference in physeal fusion between the distal forearm and the leg, and physeal closure in the hand may precede or follow physeal closure in the tibia by up to 2 years. This has important implications for timing of surgery. More important than the precise stage of skeletal maturity of the hand, elbow, or iliac crest is the state of maturation in the bone (or bones) being considered for potential intervention.
Skeletal maturity may be assessed by several methods, depending on patient age. In premature infants and during the prenatal period, the presence of specific ossification centers correlates with patient age. During the first year of life, the method of Sontag can be used (see below) [25]. During much of childhood, skeletal age determination is based on a PA view of the left hand, according to the methods of Greulich and Pyle, Tanner, Gilsanz and Ratib, and others [26–28]. However, during the pubertal growth spurt, these methods become less accurate, and skeletal age can be determined by the configuration of the olecranon apophysis [29] and then, later, by the status of the iliac crest apophysis [30].
Related posts:
Stay updated, free articles. Join our Telegram channel

Full access? Get Clinical Tree


