and Filiz Özülker1
(1)
Nuclear Medicine, Okmeydani Training and Research Hospital, Istanbul, Turkey
2.1 Head and Neck
Cerebrovascular Infarct
Fig. 2.1
Previously diagnosed remote cerebrovascular infarction presenting with diminished FDG uptake corresponding to the hypodense area on CT at left parietal and frontal lobes
Fig. 2.2
Axial 18F-FDG PET/CT image of the same patient at Fig. 2.1 showing hypometabolism at apicoseptal wall of left ventricle representing an infarct
Arachnoid Cyst
Fig. 2.3
Axial CT image (a) shows collection of CSF-attenuation fluid in posterior fossa (arrow) without any FDG uptake at the corresponding PET image (b), which is consistent with left retrocerebellar arachnoid cyst. Arachnoid cysts are congenital abnormalities that constitutes 1 % of all intracranial lesions. FDG PET can show hypometabolism corresponding to an arachnoid cyst, with the adjacent compressed brain parenchyma showing relatively normal FDG activity
Microadenoma
Fig. 2.4
Axial (a, b) and sagittal (c, d) PET and CT images of a patient showing a focus of mild hypermetabolism in the sellar region representing a microadenoma of pituitary gland (arrow)
Fig. 2.5
Axial (a, b) and sagittal (c, d) PET and CT images of a patient showing a focus of intense hypermetabolism in the sellar region representing a macroadenoma of pituitary gland (arrow). Pituitary incidentalomas <10 mm are classified as microadenomas, and those >10 mm are macroadenomas. They are also classified according to their hormone secretion status as functioning or nonfunctioning adenomas. Macroadenomas show higher FDG uptake than microadenomas
Mastoiditis
Fig. 2.6
Axial PET, CT, and fusion images showing increased FDG uptake at bilateral alveoli at maxilla due to tooth extraction (arrows) (a–c), axial PET, CT, and fusion images showing increased FDG uptake at left mastoid bone representing mastoiditis (arrow) (d–f)
Increased Activity at Masticatory Muscles
Fig. 2.7
The patient was chewing gum prior to imaging which caused increased masseter and pterygoid muscle activity
Maxillary Retention Cyst
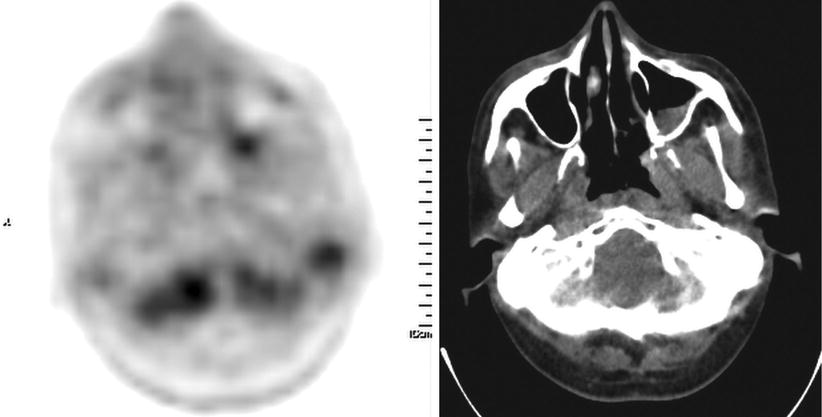
Fig. 2.8
Maxillary retention cyst at left maxillary sinus showing mild FDG uptake
Pleomorphic Adenoma
Fig. 2.9
Pleomorphic adenoma at left parotid gland showing mildly increased FDG uptake (SUVmax 2.9)
Fig. 2.10
Pleomorphic adenoma at left parotid gland showing significantly increased FDG uptake (SUVmax 5.5). Pleomorphic adenomas are FDG avid benign lesions causing false positive appearance at FDG PET and their metabolic activity increases as the size of the lesion increases
Warthin Tumor
Fig. 2.11
Axial CT and fusion images of a 75-year-old male with Warthin tumor of the right parotid gland (arrow) (SUV max 6.5)
Sjögren’s Syndrome
Fig. 2.12
Axial (a, b, c) and coronal (d, e, f) images showing increased FDG uptake at both parotid glands due to Sjögren’s syndrome
Asymmetrical Uptake at Tongue Muscle
Fig. 2.13
A 55-year-old patient with nasopharynx carcinoma had right sided glossopharyngeal nerve paralysis which resulted in asymmetrical FDG uptake at left side of the tongue
Focal Infection at the Base of the Tongue
Fig. 2.14
Axial PET and CT (a, b), fusion and MIP (c, d) images showing focal increased FDG uptake at the base of the tongue consistent with focal infection (arrows)
Osteonecrosis at Mandibula
Fig. 2.15
Axial CT and PET images showing focal increased FDG uptake at left retromolar trigone due to osteonecrosis (arrow)
Cord Vocal Paralysis
Fig. 2.16
MIP image shows intensely increased FDG uptake at left hilar mass lesion, right mediastinal and left cervical lymph nodes (a), axial PET, CT, and fusion images (b–d) show asymmetrically increased FDG uptake at right vocal cord (arrows). Compression of the recurrent laryngeal nerve by the mass lesion at hilar region leads to ipsilateral vocal cord paralysis. Unusual asymmetrical FDG uptake is detected due to excessive muscle activity of the functional vocal cord as it compensates for paralysis of the contralateral vocal cord
Increased Vocal Cord Uptake
Fig. 2.17
Patient was shouting during the uptake phase that followed injection of the tracer
Incidentally Found Thyroid Nodule
Fig. 2.18
Focal 18F-FDG uptake at left lobe of thyroid gland in a thyroid nodule found incidentally. Lesion turned out to be benign colloid nodule. Focal high uptake of 18F-FDG in the thyroid as an incidental finding occurs in approximately 1 % of the patients undergoing PET/CT examination. One third of these lesions are malignant in nature
Chronic Thyroiditis
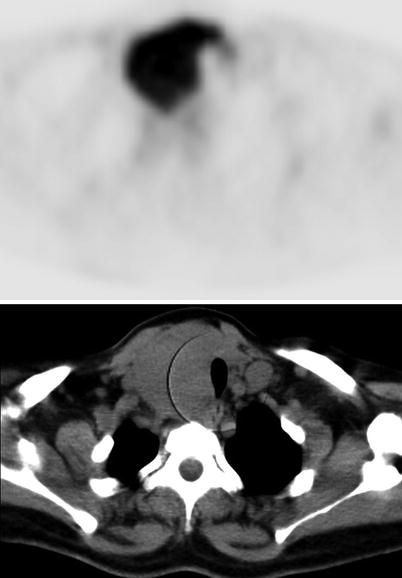
Fig. 2.19
Axial PET and CT images show diffuse intense FDG uptake at both thyroid lobes being more prominent at right. Chronic thyroiditis may cause intense and FDG uptake, unlike the focal uptake of nodules
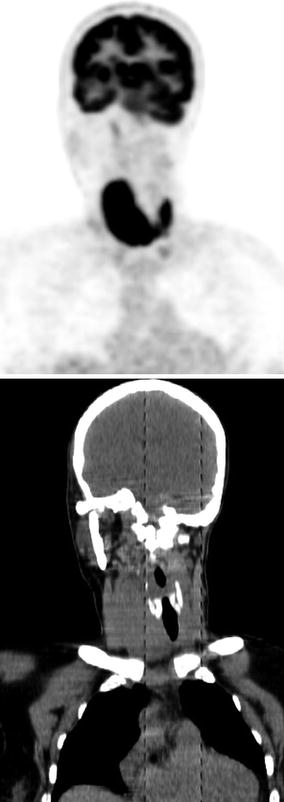
Fig. 2.20
Coronal PET and CT images
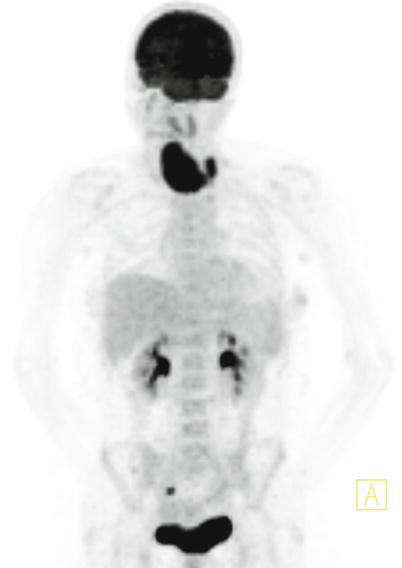
Fig. 2.21
MIP image
Discoid Lupus Erythrematosus
Fig. 2.22
A 55-year-old male patient with unusual FDG uptake at both ears due to inflammation secondary to discoid lupus erythrematosus (arrows)
2.2 Thorax
Physiologically Increased Uptake at Lactating Patient with Breast Cancer
Fig. 2.23
A 38-year-old woman underwent right mastectomy for breast cancer. 18F-FDG PET/CT is performed 1 month after she gave birth to a baby and while she was lactating. Axial (a, b) and coronal (c, d) PET and CT images show metastatic hypermetabolic lesions at left lobe of liver and diffuse physiologically increased uptake at left breast (arrow)
Fig. 2.24
MIP image of patient
Physiologically Increased Uptake at Lactating Breast
Fig. 2.25
Axial PET and CT images of a 28-year-old female patient display physiologically increased uptake at both breasts while she was lactating
Seroma After Breast Surgery
Fig. 2.26
Axial CT, PET, and fusion images of a female patient who underwent lumpectomy for a mass lesion at right breast (a–c). Hypodense lesion on CT is consistent with fluid collection at surgery site. PET image shows circumferentially increased FDG uptake at seroma (arrows)
Thymic Uptake
Fig. 2.27
A 20-year-old female with lymphoma underwent 18F-FDG PET/CT scan for recurrence detection. Minimally increased physiological FDG uptake (SUVmax 3.8) at thymus is noted (arrow) (a–c). Increased thymic 18F-FDG uptake may represent normal physiologic uptake but may also indicate the presence of thymic hyperplasia, lymphomatous infiltration, primary thymic neoplasm, or metastatic disease. It may be seen in post chemotherapy patients as a result of rebound hyperplasia
Hamartoma
Fig. 2.28
Solid lesion with lobulated contours and a focus of calcification on CT (arrow) is consistent with hamartoma (a, b). The lesion does not show any corresponding FDG uptake (c). A pulmonary hamartoma is a benign neoplasm composed of cartilage, connective tissue, muscle, fat, and bone. Hamartomas rarely show FDG uptake
Pneuomothorax
Fig. 2.29
Coronal and sagittal PET and CT images of a patient who is being staged for lung carcinoma show pneumothorax developed following a lung biopsy
Fig. 2.30
Axial PET and CT images of the patient
Postradiotherapy Inflammation
Fig. 2.31
A 63-year-old female patient underwent external beam radiotherapy (EBRT) for lung cancer. 18F-FDG PET/CT is performed for evaluation of therapy response. Axial CT (a, c), fusion (b), and PET (d) images display mildly increased diffuse FDG uptake at the consolidation area with air bronchogram, representing postradiotherapy inflammation (arrow)
Pulmonary Infection After Chemotherapy
Fig. 2.32
A 32-year-old male patient with testicular carcinoma underwent 18F-FDG PET/CT scan. Axial CT and PET images does not show any pathology (a, b)
Fig. 2.33
18F-FDG PET/CT was repeated after the patient had chemotherapy, and mildly hypermetabolic infiltration at left lung compatible with infection was detected (arrow) (a, b)
Pneumonic Consolidation
Fig. 2.34
A 74-year-old patient underwent 18F-FDG PET/CT for oncologic workup. Axial CT (a, b), PET (c) and MIP (d) images show pneumonic consolidation area with high FDG uptake at left lung
Pulmonary Tuberculosis
Fig. 2.35
A 50-year-old patient who had pulmonary tuberculosis (TB) underwent 18F-FDG PET/CT scan. Consolidation areas at upper zones of both lungs including foci of calcifications are detected on CT (a, c). Mildly increased FDG uptake at the consolidation areas is consistent with inflammation (arrow) (b). There is also a focal increased FDG uptake representing a right upper tracheal lymph node showing reactive hyperplasia (arrow head). While performing FDG PET/CT for oncologic workup, TB is encountered as a common pathology simulating cancer and producing uptake patterns that are sometimes being hard to distinguish from that of malignant lesions
Pneumoconiosis
Fig. 2.36
Mediastinal lymph node enlargement that is moderately hypermetabolic on 18F-FDG PET/CT. Histopathological findings of anthracotic pigment accumulation in mediastinal lymph nodes led to diagnosis of anthracotic pneumoconiosis
Sarcoidosis
Fig. 2.37
MIP (a), axial PET, CT, and fusion images (b–d) show bilateral hilar enlarged lymph nodes with moderately increased FDG uptake (SUVmax 4.7) consistent with sarcoidosis. 18F-FDG PET/CT scans can make contribution in the diagnosis of sarcoidosis and might also be used to monitor therapy response
Sarcoidosis
Fig. 2.38
MIP image (a), axial PET, CT, and fusion images (b–d) showing bilateral hilar enlarged lymph nodes and reticulonodular opacities at both lungs parenchyma with moderately increased FDG uptake (SUVmax 6.6). Axial fusion, PET, and CT images of pelvis (e–g) show bilateral hypermetabolic inguinal lymph nodes (SUVmax 2.2). All these lesions are compatible with sarcoidosis
Talc Pleurodesis
Fig. 2.39
A 56-year-old male patient with lung carcinoma was treated with talc pleurodesis. 18F-FDG PET/CT scan performed after application of talc pleurodesis showed increased FDG uptake at mediastinal pleural thickening consistent with talc deposit (arrow) (a, b). 18F-FDG PET/CT applied 4 months later displayed the clearance of pathological FDG uptake that was detected in the previous study, confirming the benign pathology. Two foci of newly developed FDG uptake possibly representing metastatic lymph nodes is also seen (c, d). Talc deposits in the pleura produce areas of increased uptake on PET study that correspond to the areas of high density pleural thickening on CT. These PET findings should be carefully evaluated in correlation with CT to distinguish this benign inflammatory process from malignancy
Pleural Tuberculosis
Fig. 2.40
Axial slices of CT and PET images show thickenings at costal and mediastinal pleura with corresponding increased FDG uptake, compatible with pleural tuberculosis
Fig. 2.41
MIP image
Diminished Myocardial Uptake in Fasting
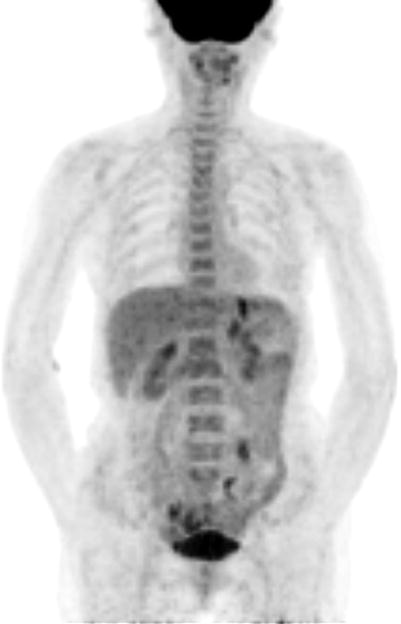
Fig. 2.42
MIP image of 18F-FDG PET/CT scan of a female patient, who had a prolonged fasting of 20 h before acquisition. Myocardial uptake is not seen, because myocardium metabolizes free fatty acids instead of glucose in case of fasting
Esophagitis
Fig. 2.43
Axial CT and PET (a, b) and sagittal MIP (c) images show increased FDG uptake at esophagus due to esophagitis
2.3 Abdomen
Herniated Stomach

Fig. 2.44
Stomach herniated into thorax
Hiatal Hernia
Fig. 2.45
Axial PET (a) and CT (b) images show a sliding hernia; the GE junction and a portion of the stomach slides upward into the mediastinum
Chilaiditi Syndrome
Fig. 2.46
Axial (a, b) and coronal (c, d) PET and CT images show interposition of the colon segment between the liver and the right hemidiaphragm
Gastritis
Fig. 2.47
MIP (a); axial PET, CT, and fusion (b–d) images show increased tracer uptake at thickened gastric wall (arrow). This patient is diagnosed to have gastritis but sometimes diffuse intense FDG uptake due to gastritis may mimic malignancy. Repeating imaging of gastric region after drinking water may show resolution of FDG uptake confirming its benign nature
Lipoma in Duodenum
Fig. 2.48
Focal filling defect in duodenum on CT image does not exhibit any FDG uptake on corresponding PET image and it is consistent with lipoma (arrow)
Metformin
Fig. 2.49
18F-FDG PET/CT MIP images in patients while taking metformin (upper row) and corresponding images after stopping metformin (lower row). Intense and diffuse uptake in the bowel segments is seen while taking metformin, and clearance of FDG uptake from the bowel segments is seen after stopping metformin. Note the better visualization of a lesion located in the left colon after clearance of activity (arrow)
Fig. 2.50
18F-FDG PET/CT MIP images in a patient with ovarian carcinoma: image obtained while taking metformin shows intense and diffuse FDG uptake in bowel segments (a), image obtained 3 months after the first study after stopping metformin shows a mass lesion with intense FDG uptake in the left upper quadrant (arrow) (b), image obtained after six courses of chemotherapy shows disappearance of the lesion confirming the malignant nature of the lesion (c)
Physiological Intestine Uptake
Fig. 2.51
MIP image (a) shows segmental bowel uptake which is suspicious for inflammatory bowel disease, but on delayed image (b) the activity in the bowel moved distally, proving physiological nature of this uptake
Fig. 2.52
Axial slices of PET and CT images of the previous patient show focal physiological FDG uptake (arrow) which is disappeared at late images
Inguinal Hernia
Fig. 2.53
Bilateral inguinal hernia is seen on axial CT image. Increased tracer uptake is noticed at right inguinal region on PET corresponding to the hyperdense contrast in the bowel
Fig. 2.54
Axial PET, CT, and fusion images (a–c), and coronal PET, CT and fusion images (d–f)
Radiation Proctitis
Fig. 2.55
Axial PET and CT (a, b) images
Fig. 2.56
MIP and axial fusion (a, b) images show circular FDG uptake at rectum due to inflammation from external radiotherapy given for cervix carcinoma
Presacral Fibrotic Tissue
Fig. 2.57
A 62-year-old female patient who had been operated for rectum carcinoma and received EBRT underwent 18F-FDG PET/CT scan for detection of recurrence. On CT images, solid lesion in soft tissue density at presacral region (a) which is suspicious for local recurrence does not show any pathological FDG uptake on PET image (b) (arrows). This lesion represents benign fibrotic tissue and malignancy is ruled out by 18F-FDG PET/CT scan
Pilonoidal Sinus
Fig. 2.58
Pilonoidal sinus located posteriorly to coccyx show mildly increased FDG uptake (arrows) (a–d)
Diffuse Fatty Infiltration of the Liver
Fig. 2.59
Axial image of a patient shows hypodense appearance of liver with an attenuation (in Hounsfield units) less than that of the spleen. This pattern is compatible with fatty infiltration of liver. Liver shows homogeneous and normal level of FDG uptake with SUVmax 3.2, while the spleen has a SUVmax of 2.9. According to a recent study, no clinically important correlation between liver attenuation at CT and SUVmax is detected. In addition, SUV max measurements in the patients with evidence of diffuse fatty infiltration of the liver were not significantly different from those in the healthy control subjects
Fatty Liver with a Fat Spared Area
Fig. 2.60
Liver is hypodense on CT except a small area at left lobe which shows higher FDG uptake compared to the rest of the liver. Fat spared area of liver may appear as focal areas of elevated FDG uptake on a PET scan and mimic metastases (arrow) (a–c)
Liver Abscess Due to Yersiniae Bacteremia
Fig. 2.61
18F-FDG PET/CT scan showed minimally increased 18F-FDG uptake with hypometabolic regions inside the liver corresponding to a mass lesion with septations in CT. The lesion in liver is consistent with abscess caused by Yersinia enterocolitica
Liver Cyst
Fig. 2.62


Hypodense lesion on CT without corresponding FDG uptake on PET image (arrow), consistent with liver cyst
Related posts:
Stay updated, free articles. Join our Telegram channel
Full access? Get Clinical Tree
