Fig. 14.1
Cutaway view of the heart (AHE)
The coronary arteries originate from the left and right coronary sinuses of the aorta (Fig. 14.2). The left main coronary artery, which comes off the left coronary sinus, continues for a variable distance before it divides into two major arteries, the left anterior descending and circumflex arteries [2]. The left anterior descending artery (LAD) descends in the anterior interventricular groove and, most of the time, continues to the apex, supplying the apical and inferior apical portion. The LAD gives off septal branches that course deep into the interventricular septum. The septal branches vary in size and number. The anterior two thirds of the septum derives its supply from the septal LAD branches, while the rest of the septum is supplied by the perforator branches from the posterior descending branch of the right coronary artery. The LAD provides also diagonal branches, which run on the epicardial surface diagonally to supply the lateral wall of the left ventricle. Usually, the first one or two diagonal branches are large enough for angioplasty or bypass consideration.
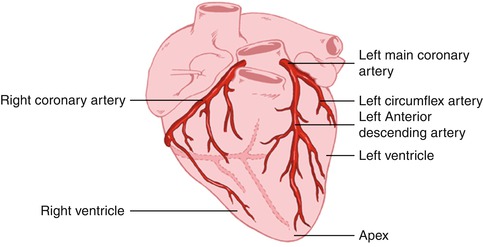
Fig. 14.2
Heart showing the origination of the coronary arteries from the left and right coronary sinuses of the aorta (AHE)
The left circumflex artery (LCx) branches off from the left main artery and runs in the left atrioventricular groove. It then continues to the left and posteriorly. It supplies several posterolateral ventricular branches, which in turn supply the posterior lateral surface of the left ventricle and parallel the diagonal branches of the LAD. In most cases, the LCx continues as a small terminal posterior left ventricular branch.
The right coronary artery (RCA) arises from the right coronary sinus and descends in the right atrioventricular (AV) groove. Its first supply is to the proximal pulmonary conus and right ventricular outflow region. Normally, there are also two or three large right ventricular branches that course diagonally over the right ventricle and supply the right ventricular myocardium. Most of the time the RCA continues along the diaphragmatic surface of the heart in the AV groove to reach the crux. At the crux, the RCA divides into a posterior descending artery (PDA) and posterior left ventricular branch. The PDA branch is usually a large artery that runs in an anterior direction in the inferior interventricular groove. The PDA supplies the inferior third of the septum. The PDA septal branches can provide a rich collateral pathway via septal perforating arteries of the LAD. The other terminal branch of the RCA, the posterior left ventricular branch, continues in the AV groove and communicates with the terminal branch of the Cx.
14.2 Physiological Considerations
Cardiac muscle has two essential properties: electrical excitability and contractility.
14.2.1 Electrical Excitation
The conduction system is composed of modified cardiac cells. The sinoatrial and atrioventricular nodes have cells with high electrical impulse automaticity, while the His bundle and the Purkinje system cells have higher rapid impulse conductivity. The contraction of the heart is normally initiated by an impulse in the sinoatrial node and then spreads over the atrial muscles to the atrioventricular node. The impulse then runs through the His bundle and the Purkinje system to reach all areas of both ventricles at approximately the same time [1].
14.2.2 Contraction
The ability of myocardial muscles to shorten and generate the force necessary to maintain blood circulation is a fascinating property of the heart. This is achieved primarily through the unique contractile function of two proteins of the sarcomere (actin and myosin) of the syncytially arranged myocardial fibers. The two main mechanisms that can alter cardiac muscle performance are a change in initial muscle length (Frank-Starling mechanism) and a change in contractile state. In the intact heart, these are determined by preload status, afterload status, the contractile state under a given set of loading conditions, and the heart rate. There is a passive exponential relationship between the length and the tension of muscle fibers. Cardiac muscle tissue, like other body tissue, is not entirely elastic. Thus, this relationship does not exist beyond certain muscle stretch limits. Additionally, there is an active proportional relationship between the initial length of myocardial muscle and the force generated by this muscle, again up to certain length limits [1].
Unlike skeletal muscles, cardiac muscle cells are connected to each other by intercalated disks and do not run the length of the whole muscle. Also, heart muscle has a rich supply of the high-energy phosphate needed for the contraction. Therefore, it may not easily develop an oxygen deficit as skeletal muscle does when its work exceeds its oxygen supply. Cardiac sarcomeres are limited by the fact that they can be extended only to a certain limit (the optimum length of 2.2 μm), whereas sarcomeres of skeletal muscles can be stretched out beyond that. Finally, cardiac muscle has all-or-none twitch contraction and cannot be physiologically tetanized as skeletal muscle can.
14.3 Determination of Left Ventricular Performance
14.3.1 Left Ventricular Function Curve
The left ventricular function curve usually refers to plotting of some of the LV performance measurements such as stroke volume or work against some of the preload indices such as pulmonary capillary wedge pressure [2]. This analysis requires invasive measurements and is useful not only for providing prognostic information in acute cardiac conditions but also for monitoring response to therapeutic interventions.
14.3.2 Ejection Fraction
The ejection fraction is the most useful single number of the LV performance, defined as the stroke volume divided by the end-diastolic volume. This functional index can be measured by both invasive and noninvasive techniques. Ejection fraction is closely related to the LV function curve; however, it is very sensitive to loading conditions [2].
14.3.3 Pressure-Volume Relationship Measurement
By studying the pressure-volume relationship, a stroke work index can be obtained [2]. This is defined as stroke volume X (mean LV systolic ejection pressure − mean LV diastolic pressure). It is a very sensitive index since it is affected by all factors that may alter LV performance.
14.3.4 Regional Wall Motion Assessment
The assessment of regional wall motion is extremely useful in confirming and locating the site of coronary artery disease (CAD). As with LV ejection fraction measurement, it can be studied using both invasive and noninvasive methods.
14.3.5 Diastolic Function
Diastolic function is usually assessed by studying the relationship between LV passive pressure and volume and by examining the rate of relaxation after contraction. Several important measurements have been derived from various invasive and noninvasive techniques that can be used for both evaluating and monitoring the changes in diastolic function [2].
14.4 Pathophysiological Considerations
Heart failure is considered a pathophysiological condition rather than a specific disease. In such a condition, the heart fails to supply enough blood to meet the metabolic demand of the tissues. Most cases of heart failure are due to primary myocardial dysfunction or intrinsic abnormalities, which include hypertensive myocardial hypertrophy, ischemic heart disease, valvular heart disease, pulmonary hypertension, pericardial disease, and other cardiomyopathies (Table 14.1). Various extrinsic abnormalities can cause heart failure as well, despite normal ventricular function; this is referred to as secondary heart failure. Heart failure in this situation could have many reasons: inadequate blood volume as in hemorrhage, inadequate oxygen delivery as in anemia, inadequate venous return as in tricuspid stenosis, profound capillary vasodilatation as in toxic shock, and peripheral vascular abnormalities as in arteriovenous shunts.
Table 14.1
Causes of heart failure
Systolic dysfunction |
1. Ischemic heart disease (e.g., chronic ischemia, myocardial infarction) |
2. Valvular heart disease (e.g., mitral regurgitation, aortic regurgitation) |
3. Dilated cardiomyopathy (idiopathic and nonidiopathic) |
4. Chronic uncontrolled arrhythmia |
Diastolic dysfunction |
1. Hypertension |
2. Ischemic heart disease (e.g., acute ischemia) |
3. Infiltrative myocardial disease (e.g., amyloid) |
4. Left ventricular outflow tract obstruction (e.g., hypertrophic obstructive cardiomyopathy, aortic stenosis) |
5. Uncontrolled arrhythmia |
14.4.1 Hypertension
The main consequence of hypertension on the heart is an increase of the afterload pressure. Myocyte hypertrophy is the usual result, to add more new contractile proteins and mitochondria in order to maintain a normal cardiac output opposing the pressure overload [3]. On the level of molecular biology, stretching of myocytes by hemodynamic overload was observed to induce specific genes with a known growth-regulatory effect such as proto-oncogenes [4]. These genes expand the myocyte capacity of protein synthesis, thus leading to concentric hypertrophy of the left ventricle (LV) without chamber enlargement. This process is often asymmetric in the various walls of the LV. In hypertrophic hearts, the increase in intracapillary distance and higher intracavitary pressure render the heart more susceptible to ischemia [5, 6].
14.4.1.1 Changes in LV Function
LV Diastolic Dysfunction. Relaxation of the ventricles following contraction is not a purely passive process, as it requires energy to remove calcium ions from the myocardial cells [7, 8]. Diastolic dysfunction is usually evident long before the development of systolic dysfunction. A decrease in early peak filling rate and prolongation of the time to peak filling rate are seen in the majority of hypertensive patients [9]. Accordingly, a greater than usual atrial contraction contribution to the late diastolic filling is noticed as an effort to maintain a normal LV diastolic volume. A high LV filling pressure is thus seen in these patients and is then transmitted to the arterioles and capillaries of the lung. Therefore, hypertensive patients will start developing signs and symptoms of pulmonary congestion despite their normal ventricular ejection fraction [10].
LV Systolic Dysfunction. Long-standing LV pressure overload and the associated myocardial ischemia in the abnormally hypertrophic myocardium will eventually lead to a decrease in the heart’s ability to contract [11]. Congestive heart failure is the end result seen in almost all uncontrolled hypertensive patients.
Arrhythmia. In addition to total cardiac pump dysfunction, there is a significant increase in sudden cardiac death among patients with hypertrophic hearts. Both simple and complex ventricular arrhythmias develop more frequently than in nonhypertrophic myocardium, and this cannot be explained only by the usual coexistence of CAD in these patients [12].
14.4.2 Pulmonary Hypertension
The degree of pulmonary blood flow is affected mainly by the lumen size of the pulmonary vessels [13]. Further, the pulmonary vascular resistance is defined as the difference of mean alveolar pressure and left atrial (LA) pressure divided by pulmonary blood flow. A change in any of these factors may therefore give rise to pulmonary hypertension. Pulmonary hypertension can be either primary or secondary to many other causes. In congenital heart diseases, increased medial thickening and atherosclerotic changes of the pulmonary vasculature are observed [14]. Such changes are also seen in patients with systemic to pulmonary collateral circulation. The sudden rise of PA pressure with irreversible RV failure and the usual significant decrease in LV systolic function association in acute pulmonary embolization are the cause of high mortality within the first hour in these patients [15]. Conversely, intimal fibrosis due to thrombus organization is the reason behind the cor pulmonale in chronic pulmonary embolization [16]. Pulmonary hypertension can also develop due to a rise of pulmonary venous pressure caused by LV diastolic dysfunction or high LA pressure. If such a condition persists long enough, medial thickening and arterialization of pulmonary veins will develop, which results in pulmonary fibrosis and destruction of alveolar capillaries [13]. The most common chronic lung disease associated with cor pulmonale is chronic bronchitis. The increased pulmonary vascular resistance in this case is caused by a reduction in the total area of the pulmonary vascular tree as well as mild thickening of the pulmonary arterioles [17, 18].
Unlike the LV, the RV is a high-volume, low-pressure pump. Consequently, as pulmonary vascular resistance increases, a decrease in RV stroke volume and EF is observed [19]. An increase in heart rate does not usually provide enough compensation, and a decrease in cardiac output is inevitable. Additionally, signs and symptoms of systemic venous congestion are seen due to high-pressure transmission from the RV. Diastolic LV dysfunction due to RV failure could be caused by the decrease in both the LV distensibility and the myocardial blood flow from the accompanied elevation in coronary venous pressure [8].
14.4.3 Valvular Heart Disease
The valvular destruction in acute rheumatic fever is related to both humoral and cell-mediated immunologic reactions, since the cell membrane of group A streptococcus antigens shares common determinants with the heart [20]. Mitral valve regurgitation is the most common presentation of acute valvulitis, while mitral stenosis is the usual chronic sequel of this disease. Varieties of autoimmune valvular lesions have also been described in many connective tissue disorders. Of the infectious causes, cardiovascular syphilis and infectious endocarditis are still recognizable. Other uncommon causes of valvular heart disease include congenital heart disease, ischemic heart disease, and cardiomyopathies.
14.4.3.1 Functional Changes
Mitral Valve Stenosis. The increase in LA size and pressure is related to the severity of mitral valve stenosis. As the LA enlarges, the incidence of all types of atrial arrhythmias, particularly atrial fibrillation, increases, which may predispose to pulmonary edema and thromboembolism. The increase in pulmonary venous pressure is another outcome that has a direct adverse impact on pulmonary vascular resistance and eventually results in RV failure. LV diastolic dysfunction is frequently observed, mainly due to the change of diastolic inflow pattern and pressure gradient across the mitral valve as well as to the absence of atrial kick. Systolic LV dysfunction can also occur due to prolonged LV pressure rise time, in addition to abnormal LV filling as the atrial systole extends into early ventricular systole [21].
Mitral Regurgitation. Early on in chronic mitral regurgitation, the LA gradually dilates as some of the LV-ejected blood returns to the LA. This in turn will result in a gradual increase of the LV diastolic volume. Adaptive increase in diastolic compliance is the reason behind effective maintenance of a relatively normal diastolic LV and both systolic and diastolic LA pressures until the late stage, when both chambers develop dysfunction [22, 23]. In acute mitral regurgitation, however, an early increase in both LA and LV diastolic pressures is evident. The lack of adaptive dilatation, like that seen in chronic regurgitation, will result in a significant increase in pulmonary venous pressure and acute pulmonary edema. Moreover, a marked decrease in LV stroke volume will lead to a decrease in cardiac output and tissue hypoperfusion [22].
Aortic Valve Stenosis. As a result of the increased pressure gradient across the aortic valve, both LV systolic pressure and diastolic pressure increase. A sustained and prolonged LV ejection time is usually seen, along with concentric ventricular hypertrophy [24]. Congestive heart failure usually develops due to both systolic and diastolic dysfunctions. As the hypertrophic myocardium fails to eject enough blood across the valve, an increase in diastolic volume and pressure will take place to compensate. This will further increase the diastolic dysfunction, and a rapid deterioration of symptoms will then be noticed. In addition, a significant reduction in coronary artery as well as systemic arterial pressures will be manifested as angina and syncope, respectively.
Aortic Regurgitation. In chronic regurgitation, LV volume is overloaded. The end-diastolic volume increase is proportional to the regurgitant volume of blood [25]. LV compliance is initially normal but decreases later on as diastolic pressure increases; this has a deleterious effect on the pulmonary veins and capillaries and results in pulmonary congestion. On the other hand, LV systolic pressure and thickness increase to compensate for the increase in the afterload. This will eventually fail if not surgically corrected. A sudden rise of LV diastolic pressure is seen, if the aortic regurgitation is acute, as the LV does not have enough time to dilate. Therefore, acute pulmonary edema will soon occur, in addition to angina from the reduction in coronary blood flow [25].
Tricuspid Valve Stenosis. Since the tricuspid is the largest valve orifice, severe stenosis is required before a significant pressure gradient can develop across the valve [26]. Systemic venous congestion is the expected finding. Atrial fibrillation is seen more as RA pressure and volume increase.
Tricuspid Regurgitation. Chronic regurgitation results in RV volume and pressure overload. The increase of diastolic pressure cannot be effectively compensated for because of the anatomical structure of the RV. As such, signs and symptoms of RV failure usually develop faster than those of LV failure, if both ventricles are subjected to similar situations. Unlike mitral valve regurgitation, acute tricuspid regurgitation produces no significant acute hemodynamic compromise and is well tolerated in most cases [26].
Pulmonary Valve Stenosis. Pulmonary valve stenosis produces RV pressure overload, which is counteracted by myocardial hypertrophy. RV failure develops much later, as this condition is better tolerated by the RV than the increase pressure in this case of tricuspid regurgitation [26].
Pulmonary Regurgitation. Pulmonary regurgitation is rarely seen; the findings are similar to those of tricuspid valve regurgitation.
14.4.4 Cardiomyopathies
14.4.4.1 Dilated Cardiomyopathy
Dilated cardiomyopathy is not a single disease but rather the final result of various types of myocardial insults. These insults can be viral or other infectious processes; exposure to cardiotoxins such as lithium, anthracyclines, and alcohol abuse; hypertension; pregnancy; and immune-mediated myocarditis. The dilated ventricles also show some degree of hypertrophy but not proportional to the degree of dilatation [27]. Occasional transmural scars, mural thrombi, and a variable degree of increased interstitial fibrous connective tissue can be seen. Mitral and tricuspid regurgitation are frequently noticed due to annular dilatation, lack of sphincteric contraction, and malalignment of the papillary muscle. Reduced systolic function with dilatation of one or both ventricles is the criterion for recognition. Symptoms appear when cardiac output cannot be compensated for or LV filling pressure becomes high.
14.4.4.2 Hypertrophic Cardiomyopathy
Hypertrophic cardiomyopathy is an idiopathic process that affects mainly the LV myocardium, but the right ventricle may also be involved. Other causes of myocardial hypertrophy such as systemic hypertension and aortic valve stenosis must first be excluded. The hypertrophy is asymmetric in most cases, but it can be concentric. This process commonly involves the whole septum, but it may be localized to the subaortic region. Extension into the anterolateral wall is occasionally seen. An apical hypertrophy variation is seen mainly in Japan. Rarely, only mid-ventricular hypertrophy is seen. Extensive myocardial fiber disarray with myocardial fibrosis involving mainly the septum is the typical histopathological feature. Patients with hypertrophic cardiomyopathy often have an ischemic myocardium due to the generalized arteriolar dysfunction. Sudden death from ventricular arrhythmias is common during the first decade of their life. Those who survive develop progressive LV diastolic dysfunction. Outflow obstruction and increased residual volume with a drop in ejection fraction and stroke volume will lead to a further increase in the LV filling pressure. Increases in LA pressure and size usually result in atrial fibrillation, which further decreases the stroke volume. Mitral regurgitation is occasionally observed due to structural changes in mitral leaflets.
14.4.4.3 Restrictive Cardiomyopathy
Two types of restrictive cardiomyopathy are observed: a rare, noneosinophilic, or primary restrictive cardiomyopathy and a more common eosinophilic type. Of the eosinophilic restrictive cardiomyopathy, endomyocardial fibrosis is described in the tropical zones, while Löffler’s endocarditis is seen in the temperate zones. The morphological features of the eosinophilic type include myocardial hypertrophy and significant endocardial thickening with plaques of collagen-rich fibrosis that vary in size. The eosinophilic myocardium will first show areas of necrosis that will progress to scarring with possible superimposed thrombi and finally end as thick myocardial fibrosis [27]. Typically, the venous pressure is exceedingly high due to stiffness of the ventricles that prevents dilatation in the diastolic phase of the cardiac cycle, but systolic myocardial function is well preserved until later stages of the disease. The fibrotic healing process usually starts at the apex and may obliterate the cavity at this region. As the mitral valve becomes embolized, mitral regurgitation develops that cannot be compensated for, since the LV dilatation is impaired. Therefore, an increase in LV filling pressure is usually observed. Similar changes take place in the right heart with manifestation of systemic venous congestion. The infundibulum usually dilates to compensate for the loss of volume and increased filling pressure; this results in tricuspid regurgitation and an increase in pulmonary pressure.
14.4.5 Pericardial Effusion
Pericardial effusion is considered to be present when the amount of fluid in the pericardial space exceeds 50 ml. Pericardial effusion can be associated with generalized processes not related to the pericardium, such as congestive heart failure, hypoalbuminemia, volume overload, and pulmonary hypertension. In most cases, however, it is related to a pericardial disease. The most common causes are post-myocardial infarction and uremic, neoplastic, and idiopathic pericarditis. The hemodynamic consequences of pericardial effusion depend on the rate at which the effusion is developing and the compliance of both the pericardium and the ventricles. With significant increase in the pericardial fluid pressure, the filling pressure of both ventricles may decrease, which subsequently leads to a decrease in cardiac output. This condition is called pericardial tamponade and in severe cases is associated with a high mortality. Echocardiography is an excellent tool for the diagnosis and follow-up of pericardial effusion. The condition is also invariably seen with equilibrium radionuclide angiography (ERNA); however, an effusion of more than 400 ml is usually needed to be well recognized. The identification of pericardial effusion is important to be able to start an appropriate workup for this potentially lethal condition.
14.5 Scintigraphic Evaluation of Cardiac Function
Radionuclide techniques provide both accurate and noninvasive means of evaluating cardiac function. Their role and clinical utility over the past 35 years are well established in the initial diagnosis of patients with suspected heart disease as well as in monitoring and deciding on prognosis in patients with known heart disease [28]. The accuracy of radionuclide ventriculography was recently found to be comparable to magnetic resonance imaging [29].
Although most ventricular function studies are performed with the patient at rest, exercise functional studies can also be done to assess regional and global myocardial contraction changes with stress. Two distinct types of studies can be performed either at rest or under stress: in the first-pass method, a bolus of radioactivity is dynamically imaged as it passes through the various vascular pathways of the heart; in the equilibrium methods, the heart is imaged over several hundred heartbeats after an intravascular space radioactive tracer has reached equilibrium. The cardiac information obtained by these methods is summarized in Table 14.2 [30].
Table 14.2
Information obtained by radionuclide evaluation of ventricular function
1. Global right and left ventricular ejection fraction |
2. Regional right and left ventricular function |
3. Absolute ventricular volumes |
4. Systolic emptying and diastolic filling rates |
5. Detection and quantitation of cardiac shunts |
In the first part of this section, the radiopharmaceuticals, imaging techniques, and methods of RNA analysis are reviewed. This is followed by a description of the common clinical applications of these types of studies.
14.5.1 Imaging Techniques and Interpretation
14.5.1.1 Equilibrium Radionuclide Angiography
Radiopharmaceuticals. Studies with radiopharmaceuticals require the use of an intravascular tracer that equilibrates within the blood pool. The ease with which 99mTc-pertechnetate can be attached to the patient’s own red blood cells (RBCs) makes labeled RBCs the preferred technique over labeled pooled human serum albumin. The usual adult dose is about 30 mCi. Three methods of labeling the RBCs are commonly used: in vivo, modified in vitro, and in vitro. The characteristics of each method are described below. All three methods allow the 99mTc to bind irreversibly to the hemoglobin and remain in the intravascular space, allowing serial studies to be performed for up to 6–8 h following labeling of the RBCs [31].
In Vivo Technique. The patient first receives stannous pyrophosphate intravenously. The stannous ion (tin) enters the RBCs and creates the optimal oxidation-reduction environment for reduction and binding of the 99mTc-pertechnetate, which is injected intravenously 15–20 min later. Once the 99mTc-pertechnetate is in the RBCs, it is trapped inside by strong binding to the beta chain of the hemoglobin. Approximately 70–80 % of the 99mTc is attached to RBCs, but in some patients as little as 50 % or less may be attached. This makes identifying the edges of the blood pool during processing and analysis more difficult. In some laboratories, this method is used only when a first-pass study precedes ERNA or the patient has limited venous access. The major advantages of this method are the simplicity of use, shorter labeling time, and lower cost.
Modified In Vitro Technique. This technique is used by many laboratories because it is easier to perform than the in vitro technique and results in a higher labeling efficiency than the in vivo method. As in the previous method, stannous pyrophosphate is first injected intravenously. The blood is then drawn from the patient into an anticoagulant acetate dextrose solution (ACD) or a heparin-treated, lead-shielded syringe containing 99mTc-pertechnetate. Subsequently, the syringe is placed in a mechanical rocker or rotated slowly by the technician for 10–15 min, and the RBCs are then reinjected into the patient. Labeling efficiency is usually greater than 90 %. This method offers the best compromise between ease of use and high labeling efficiency. Total labeling time averages 30 min.
In Vitro Technique. The labeling efficiency of this method approaches 100 %. Patient blood is drawn and the RBCs are separated, washed with saline, and incubated first with stannous pyrophosphate and then with 99mTc-pertechnetate. The cells are washed with normal saline before and after each step to eliminate unbound material. Finally, the labeled cells are reinjected into the patient with very little or no free 99mTc-pertechnetate. The average labeling time is slightly more than 30 min. This technique also requires handling blood during multiple steps and using needles to inject blood into sealed vials.
RBCs from patients receiving heparin therapy are sometimes difficult to label, and in such cases the use of ACD as an anticoagulant is preferred to increase the labeling efficiency. Inadequate anticoagulation or too aggressive shaking of cells may cause thrombus formation and result in hot spots in the lungs. Likewise, stannous pyrophosphate can be oxidized by water in glucose solutions, and this may lead to poor RBC labeling.
14.5.1.2 Image Acquisition
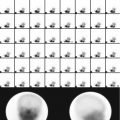
Assessing ejection fraction and regional wall motion requires measurement of volume changes and wall motion at different intervals throughout the cardiac cycle. Acquisition of multiple timed images of the blood pool activity in the heart will then be triggered by each R wave (Fig. 14.1). The duration of every frame may be 1–60 ms. Multiple beats are acquired to obtain adequate counts in each frame, and typically a complete radionuclide ventriculographic study will consist of 200–800 summed beats for each of the three planar views [30] (Fig. 14.3).
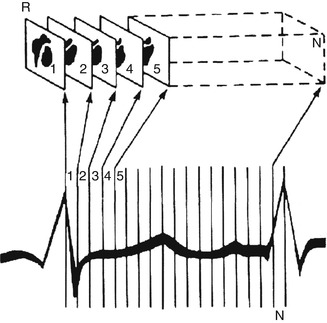
Fig. 14.3
Method by which the computer generates multiple gated images. The cardiac cycle is divided into a preselected number of frames of equal duration. Scintigraphic data from successive beats are placed into separate parts of the computer memory, depending on the temporal relation of the scintigraphic data to the R-wave marker (R). For each frame (1…N), scintigraphic data from successive beats are accumulated either until a preset time is reached (e.g., 2 min for exercise scintigraphy) or until the average cardiac image contains a predetermined number of counts (e.g., 200,000 counts for typical resting studies) (Reproduced with permission from Berman et al. [32])
A minimum of three different views of the heart are needed to assess all walls of the LV as well as all four cardiac chambers. The best septal views are left anterior oblique (LAO), anterior (ANT), which is 45° to the right from LAO, and left lateral (LLT), which is 45° to the left of LAO. Following labeling of the RBC pool, the LAO view is obtained first, as this view allows the best quantitation of the ejection fraction. In the LAO view, the camera is positioned so that the RV and LV are well separated. The other views are obtained for a similar number of counts as the LAO view. The closer the head of the camera is to the patient, the better the spatial resolution of the images. A 10° caudal tilt is used in the LAO view to minimize overlap of the left atrium (LA) and LV counts. Alternatively, a slanted hole collimator may be used to give optimal separation while allowing the camera head to be closer to the patient on the LAO view. The general all-purpose (GAP) collimator offers a compromise between the high-resolution and high-sensitivity collimators and is the one most frequently used in clinical imaging. A dedicated computer system is required to acquire, store, and process the information.
Studies may be acquired for a fixed number of heartbeats or for the total counts in the complete study. Fixed-beat studies usually acquire 200–800 individual beats, and the time of acquisition is dependent on the heart rate. Fixed-count studies usually require six million counts for the entire study, or they may be acquired until a fixed number of counts are reached within each image or in the LV region.
14.5.1.3 Modes of Acquisition
There are three possible modes of acquiring ERNA: list, frame, and dynamic arrhythmia filtration. Each method has its advantages and disadvantages, as described below and summarized in Table 14.3.
Table 14.3
Comparison between the different modes of computer acquisition
Mode of acquisition | Advantages | Disadvantages |
|---|---|---|
List mode | Optimal temporal resolution | Intensive memory requirement |
Excellent arrhythmia rejection | Longer processing time | |
Frame mode | Easy setup | Count drop-off |
Minimum memory | Fixed temporal resolution | |
Poor arrhythmia rejection | ||
Dynamic arrhythmia (buffered beat) mode | Flexible temporal resolution and arrhythmia rejection | Longer setup for greater options |
Less memory than list | ||
Accurate systole/diastole |
List Mode. During acquisition the computer records the spatial location of each photon, the ECG gating signal, and rimming markers, usually every millisecond. Following acquisition, each individual beat can be reviewed to eliminate atrial or ventricular premature beats that exceed a determined R-R interval duration (arrhythmia rejection). The acceptable beats can then be framed in the most appropriate timing interval for the type of analysis that is needed.
Frame Mode. Prior to starting frame mode acquisition, the patient’s heart rate is sampled for 10–20 s, and the mean R-R interval is used to set the time limits or window for acceptable sinus beats. For clinical studies, beats 10 % shorter or longer than the mean R–R interval are rejected as possible premature beats. The beat following the early rejected beat is also rejected, as it has a prolonged filling interval and will result in a higher ejection fraction. Frame mode studies are generally acquired for 16–32 frames. It is extremely important that patients be in a resting state during the heart rate sampling prior to starting acquisition and throughout acquisition. Major shifts in heart rate will cause many beats to be rejected and prolong the acquisition.
Dynamic Arrhythmia Filtration. This technique allows the acquisition parameters (duration of each frame, percent R-R variability allowed for beat rejection, and total number of frames) to be set at the beginning of acquisition. Once acquisition starts, each beat is placed in a temporary memory buffer where it is examined with regard to the preset parameters. If it meets all criteria, it is accepted and included in the final data set. If it does not meet all the criteria, it is rejected. Thus, greater flexibility in beat selection is possible than with frame mode, but without the memory requirements and longer processing time required by list mode acquisition.
Regardless of the method of acquisition used, it is important to confirm that only the R wave from the ECG signal is detected as the trigger signal and as appropriately gating the acquisition. This can be done by examining an ECG rhythm strip and identifying the triggering signal. Gating may sometimes occur incorrectly on the P-, T-, or R-wave signal as well as muscle artifact and pacing spikes from artificial pacemakers. If this occurs, the lead placement needs to be changed or the voltage amplitude adjusted to avoid inappropriate gating [32].
Simple LV ejection fraction calculations usually require time intervals of 40–50 ms to adequately define the end-systolic point in the heart cycle, where the heart has the smallest volume. For analysis of diastolic function, timing intervals of 10–20 ms give the most reliable information for the ventricular filling portion of the heart cycle. Even with list mode and dynamic arrhythmia filtration, there is still slight R-R interval variability that can lower the counts and distort the last few frames of the time-activity curve. This count drop-off does not affect ejection fraction calculation but is deleterious for diastolic function analysis. This limitation can be overcome by generating separate forward and backward time-activity curves and combining them in a final curve for analysis.
Patients in atrial fibrillation have variable diastolic filling intervals, and this results in a different ejection fraction for each beat. LV ejection fraction measurement by ERNA during atrial fibrillation has been shown to be an accurate reflection of the summed ejection fraction of each of the individual bats. Thus, it is an accurate reflection of overall ventricular systolic function [31]. Contrast ventriculography and echocardiography will sample only a few beats for ejection fraction calculation and may be less representative of true function.
14.5.1.4 Image Processing
Because of the random nature of radionuclide disintegration, nuclear medicine images are subject to statistical variation. Filtering is used to remove these statistical fluctuations by modifying (smoothing) the data points. Smoothing can be accomplished by spatial (within each frame) or temporal (between frames) filtering. Spatia1 filtering corrects each pixel by using information from the surrounding pixels within the same image, while temporal filtering uses pixel information from the preceding and subsequent images.
Identification of the edges of the ventricles is the next step. This can be done manually or using one of several edge-detection computer algorithms provided in most commercially available nuclear cardiology computer systems. When using these automated edge-detection programs, it is important to visually review each frame for accurate definition of edges.
Appropriate background subtraction must be also performed to obtain an accurate estimation of chamber volumes. A time-activity curve of the LV volume at each frame or time point in the cardiac cycle is next generated. This approximates the changes in ventricular volume over time, from which LV ejection fraction can be easily calculated [31].
Related posts:

Stay updated, free articles. Join our Telegram channel

Full access? Get Clinical Tree


