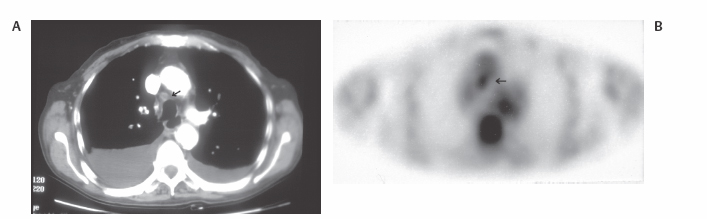
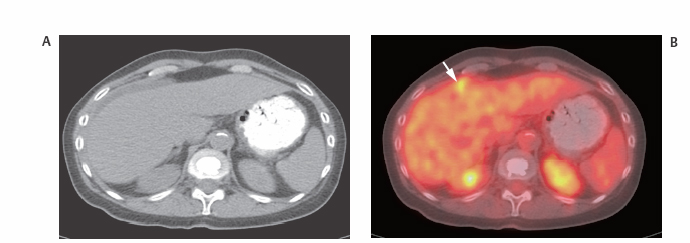
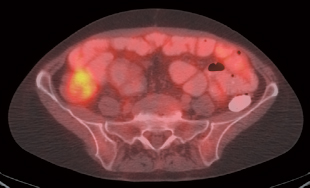
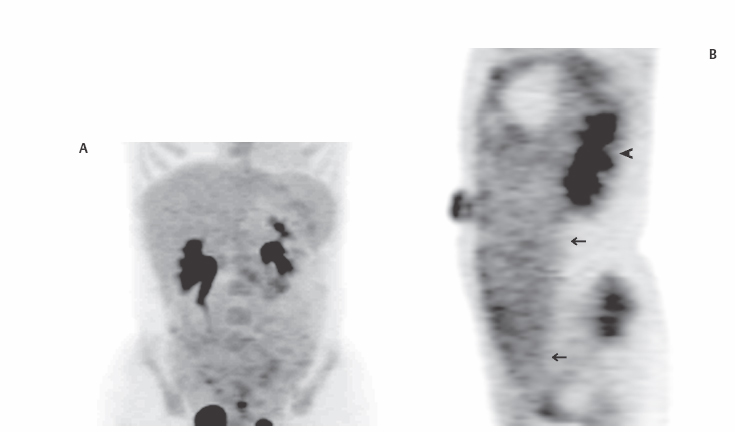
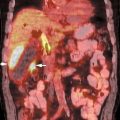
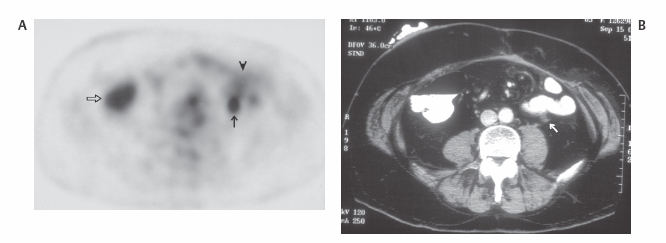
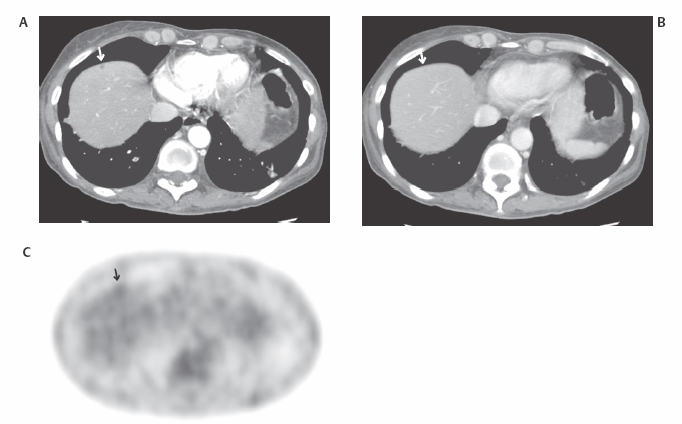
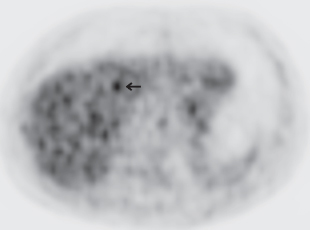
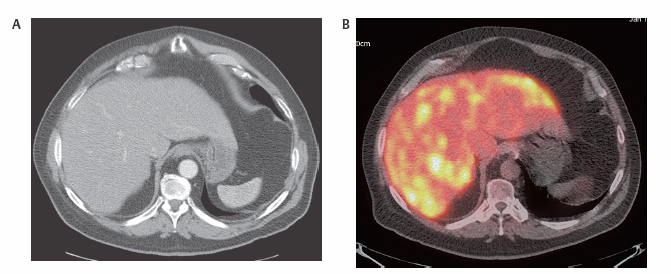
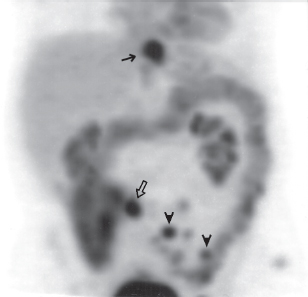
III The primary attribute of positron emission tomography (PET) imaging is its great contrast resolution compared with anatomical imaging techniques. Because of this contrast resolution, in oncologic imaging PET has substantial advantages over anatomical techniques in the early detection of disease in staging and recurrence and the accurate evaluation of therapy response. In general, the disadvantages of PET are related to its relatively poor resolution relative to anatomical imaging techniques and the numerous sources of nonneoplastic uptake of fluorodeoxyglucose (FDG). However, many of the disadvantages of PET are greatly mitigated with the use of combined PET/computed tomography (CT) imaging (see Chapter 8). Fig. 10.2 Peritoneal metastasis from colon cancer. (A) Axial positron emission tomography (PET) scan shows focal uptake (arrow) adjacent to small bowel (arrowhead). Although mild diffuse small bowel uptake is usually normal, focal areas of uptake greater than the surrounding small bowel are usually not normal. It is normal to have substantially greater uptake in the right colon (open arrow) than the small bowel. (B) Computed tomography (CT) scan at the same level demonstrates a small focus of abnormal soft tissue (arrow) adjacent to small bowel. This was not seen prospectively on the CT and was present only on one slice. The contrast-to-noise ratio of the abnormality on PET is much greater than on CT. Fig. 10.3 Subtle liver metastasis. A metastasis in the dome of the liver (arrow) is much better seen on (A) an arterial-phase axial computed tomography (CT) scan than on (B) a portal phase scan. (C) This lesion has mild FDG uptake on an axial PET scan. This lesion might be interpreted as artifactual secondary to image noise on the positron emission tomography scan alone, or if correlated with the portal phase CT. Correlation with arterial phase CT was necessary. The lesion itself is nonspecific in appearance on CT, but the presence of visible fluorodeoxyglucose uptake in this small lesion is consistent with metastatic disease. Fig. 10.4 Liver noise mimicking a lesion. Multiple foci of increased activity in the liver are present. It is difficult to differentiate whether these are secondary to lesions or image noise. One focus (arrow) is slightly more intense and was suspicious for a possible lesion. Note that this does not appear substantially different from the true-positive liver lesion in Fig. 10.3. However, this was a false-positive finding, as no lesion was identified by either computed tomography or magnetic resonance imaging in this region. Fig. 10.5 Liver metastases seen by positron emission tomography (PET) only. (A) Axial computed tomography (CT) scan does not demonstrate any liver lesions. (B) Corresponding PET/CT scan demonstrates multiple hepatic metastases. This is a rare finding, as the majority of liver metastases seen on PET can be visualized by contrast-enhanced CT. However, liver metastases are occasionally not visualized on portal-phase CT scans. The fatty infiltration of the liver in this case may contribute to the lack of visualization of the metastases. An arterial-phase CT was not done in this case, so it is unclear whether the metastases would have been visualized in a different phase of contrast enhancement. There are limited data on PET/CT imaging for the evaluation of solid splenic masses.8 Fig. 10.7 Peritoneal seeding pattern. Coronal positron emission tomography scan demonstrates multiple foci of peritoneal seeding medial to the cecum (open arrow) and on the sigmoid mesocolon (arrowheads) from a gastroesophageal carcinoma (arrow). This is a classic pattern of peritoneal spread. (From Lin EC, Lear J, Quaife RA. Metastatic peritoneal seeding patterns demonstrated by FDG positron emission tomographic imaging. Clin Nucl Med 2001;26(3):249–250. Reprinted with permission.)
Oncologic Applications
10
Oncologic PET by
Anatomical Region
Eugene C. Lin and Abass Alavi
 General Principles
 Liver
Liver
 Spleen
 Peritoneum
 Lymph Nodes
Radiology Key
Fastest Radiology Insight Engine