Fig. 9.1
OCT ILUMIEN PCI Optimization System (Courtesy of St. Jude Medical)
Fig. 9.2
OCT Grey scale, inverted grey scale, Sepia, colored scale (a), L-display (b), 3D display (c), and co-registered 3D OCT and angiographic images (d). The asterisk (*) is wire artifact (From Tearney et al. [1] with permission)
Intensity Scaling
The dynamic range of the OCT signal is too large to be displayed by conventional display monitors and as such, are commonly shown as the logarithm of the OCT signal, which compresses the data range for display.
Color Mapping
The OCT signal intensity is mapped to a color scale that can be displayed on a monitor. The common color maps are grayscale (low is black, high is white), inverted grayscale, and the sepia scale, ranging from black (low OCT signal) through brown, gold, yellow and white (high OCT signal). Less commonly used are color mappings (e.g. rainbow-like) that can bring out faint details in an image, but also strongly influence the shape-perception and measurements of the visualized data (Fig. 9.2).
L-mode Display
An L-mode view is a longitudinal reconstruction of an OCT pullback dataset at a particular rotational angle. As with IVUS, the plane through which the longitudinal section is taken should intersect the center of mass of the artery or the lumen. Distance measurements can be made using the L-mode images when the frame rate and pullback speeds are known (Fig. 9.2).
Three-dimensional Visualization
3D visualization including cutaway or flythrough views of volume renderings have been utilized to display OCT datasets. At present, there are no standards for 3D OCT visualization diagnosis or measurements (Fig. 9.2).
Co-registration of Three-dimensional OCT and Cineangiography
Co-registration of cine angiography and 3D OCT is available by the QAngio® OCT RE system by Medis Specials (Netherlands) (Fig. 9.2).
Image Acquisition Protocols Using the FD OCT Catheter
After the catheter (Dragonfly catheter (DUO C7, and OPTIS), St Jude Medical, Westford, MA) is removed from the packaging, a 3 cc syringe that is provided is used to flush with non-diluted contrast the side arm of the catheter. The catheter is then connected to the console and then advanced over the wire. At least a 6Fr-guiding catheter is required for FD-OCT imaging. The OCT imaging catheter is advanced distally into the coronary artery via a standard angioplasty guide wire. Correct guide catheter position can be confirmed by manual injection of a small flush bolus through the guide catheter prior to imaging, if needed. Automated OCT pullback is performed during manual contrast injection through the guide catheter using the manifold syringe. Automated OCT pullback speeds for FD-OCT systems typical ranges from 10 to 40 mm/s.
Lesion and Stent Morphology by OCT
OCT can identify a variety of vascular morphologies before or after PCI based on the following criteria:
1.
Back scatter (high or low) and signal intensity (rich or poor): Backscattering refers to the signal intensity and the higher the backscattering, the brighter (signal rich) the image will appear. Lesion characteristics with low backscattering will appear dark (signal poor and vice versa).
2.
Attenuation (high or low): Attenuation refers to penetration beyond the lumen. In the catheterization laboratory, when there is a vessel with a lesion in the wall with low attenuation, one can evaluate the lumen (and wall) beyond the lesion; whereas if the lesion had characteristics of high attenuation, luminal (and wall) evaluation would be more difficult.
3.
Borders (sharply or poorly delineated):
4.
Shape (focal, linear, layered):
5.
Consistency (homogenous or heterogeneous):
6.
Location:
OCT Coronary Evaluation Prior to Percutaneous Coronary Intervention
Interventional cardiologists who have been using intracoronary imaging were undoubtedly initially trained using intravascular ultrasound techniques. Because cardiologists have become well versed in traditional cardiovascular imaging such as transthoracic echocardiography, transesophageal echocardiography, and intravascular ultrasound imaging, all of which require understanding of ultrasound physics, many have difficulty with image interpretation of light technology. As mentioned above, the basics of image interpretation require understanding two basic concepts of backscatter and attenuation.
The normal coronary artery has three layers of intima, muscular media, and adventitia. Different from intravascular ultrasound, the media is low signal with low attenuation. The intima and adventitia are brighter with higher backscatter. Three of the most common vessel features encountered in the catheterization laboratory, other than the normal vessel, include fibrotic plaque, calcified plaques, and lipid rich plaque.
Fibrotic plaques or fibrotic caps are commonly encountered in the catheterization lab. Fibrotic plaques have high backscatter with low attenuation therefore appearing diffusely and homogenously bright with the ability to see clearly beyond the lumen. It has been suggested from post-mortem studies [8] that thin fibrous caps (<65 um) are vulnerable for rupture. However, a plaque thickness ranging anywhere from 50 to 90 um has potential for rupture at the shoulder [9, 10]. OCT has demonstrated that statins have the ability to thicken and stabilized fibrous caps [11].
Inflammation of the intimal lining may produce strong optical signals through a lipid rich layer of macrophages [12, 13]. Densely infiltrated macrophages on the surface of plaque may scatter light signal and appear as dark shadow and be misinterpreted as a thin-cap fibroathermona creating a superficial optical artifact. Lipid rich plaques within the vessel wall have low backscatter with low attenuation and typically appear as if there is a pool of darkness, which is confined within a higher superficial cap. Thin-capped fibrous atheromas and thicker-capped fibrous atheroma can be differentiated by the thickness of the bright superficial layer, which may have implications in plaque vulnerability.
Calcific plaques or calcified nodules within the vessel wall have low backscatter with low attenuation therefore appearing dark. Due to the nature of calcific nodules within the vessel wall, the borders of calcium are sharp and well-demarcated.
Optical coherence tomography can help differentiate if thrombotic burden is platelet rich (white thrombus) or red blood cell rich (red thrombus) and is superior to IVUS in thrombus detection [14, 15]. Light does not penetrate beyond red blood cells, which is the reason contrast is required to displace the blood. Therefore, red blood cell rich thrombus has high attenuation and high backscatter. If there is a thrombus in the lumen, which makes the lumen difficult to evaluate beyond the thrombus, it is likely to be rich in RBC. If there is a platelet rich thrombus, light is able to penetrated beyond the thrombus. Conversely, white thrombus has lower attenuation and high backscatter.
OCT definitions for aneurysms, pseudoaneurysms, and true vs. false lumen only apply when the EEM can be identified and are as follows:
True aneurysm: A lesion that includes all layers of the vessel wall with an EEM and lumen area >50 % larger than the proximal reference segment.
Pseudoaneurysm : Disruption of the EEM, usually observed after intervention.
True versus false lumen : A true lumen is surrounded by all three layers of the vessel; intima, media, and adventitia. Side branches communicate with the true, but not with the false lumen. A false lumen is a channel, usually parallel to the true lumen that does not communicate with the true lumen over a portion of its length.
Table 9.1 delineates the most common lesions identified by OCT as outlined in the consensus document. Figures 9.3, 9.4, 9.5, 9.6, 9.7, 9.8, 9.9, 9.10, 9.11, and 9.12 reveal different native vessel pathologies on OCT.
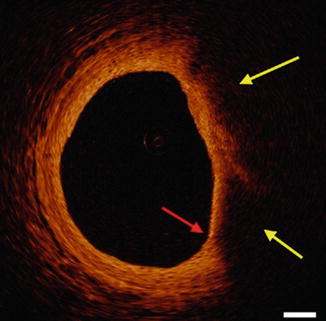
Table 9.1
Lesion morphology by OCT
Lesion | OCT characterization |
|---|---|
Normal vessel wall or intimal thickening (Fig. 9.3) | Intima: high backscatter, signal-rich, Media: low backscatter, signal poor, Adventitia: heterogonous high backscatter, signal rich, Periadventitial: large clear structures (adipocytes) |
Internal (intima and media boundary) and External (medial and adventitia boundary) elastic lamina: appear as highly back scattering thin structures | |
Atheroma | Mass-like (focal) lesion, or less of a layered structure of a vessel wall, IEL and EEL may or may not be visualized |
Fibrous plaque (Fig. 9.4a) | High backscattering and a relatively homogenous signal |
Fibrocalcific plaque (Fig. 9.4c) | Evidence of fibrous tissue (defined previously), along with calcium that appears as a signal–poor or heterogeneous region with a sharply delineated border (leading, trailing, and/or lateral edges). Microcalcifications are not well defined |
Necrotic core/lipid core | Signal–poor region within an atherosclerotic plaque, with poorly delineated borders, a fast signal drop-off, and little or no OCT signal backscattering, within a lesion that is covered by a fibrous cap. It may also contain OCT evidence of cholesterol crystals. Certain plaque components such as macrophages, which have a high attenuation, may reside at the surface of a plaque and generate the appearance of a signal- poor region below |
Fibrous cap | A tissue layer, which is often signal-rich, overlying a signal-poor region |
Fibroatheroma | OCT-delineated fibrous cap and a necrotic core |
OCT-thin capped fibroatheroma (TCFA) (Fig. 9.5) | OCT- delineated necrotic core with an overlying fibrous cap where the minimum thickness of the fibrous cap is less than a predetermined threshold (65 μm). Some studies have used an additional parameter that the necrotic core should subtend an arc that is greater than 90° or comprise more than 1 quadrant of an image displayed in Cartesian coordinates |
Macrophage accumulation (Fig. 9.6) | Signal-rich, distinct, or confluent punctate regions that exceed the intensity of background speckle noise. Macrophages should only be evaluated in the context of a fibroatheroma and may often be seen at the boundary between the bottom of the cap and the top of a necrotic core. Macrophages attenuate the IVOCT light significantly, and as a result, superficial macrophages can shadow underlying tissue, giving it the appearance of a necrotic core. Macrophage accumulations may also be confused on occasion with microcalcifications, cholesterol crystals, or IEM and EEM |
Intimal vasculature (Fig. 9.7a) | Signal-poor voids that are sharply delineated and can usually be followed in multiple contiguous frames |
Cholesterol crystals (Fig. 9.7b) | Thin, linear regions of high intensity, usually associated with a fibrous cap or necrotic core |
Thrombus | A mass attached to luminal surface or floating within the lumen of 2 types |
Red (red blood cell–rich) thrombus: which is highly backscattering and has a high attenuation (resembles blood) (Fig. 9.8a), | |
White (platelet–rich) thrombus: which is less backscattering, homogeneous, and has low attenuation (Fig. 9.8b) | |
Dissections (Fig. 9.11) | Tissue flap, which may be intimal, medial, adventitial, intramural hematoma, or intra stent |
Plaque rupture (Fig. 9.9a) | Intimal tearing, disruption, or dissection of the cap |
Plaque ulceration (Fig. 9.10) | A recess in the plaque beginning at the luminal-intimal border |
OCT erosion (Fig. 9.9b) | OCT evidence of thrombus, an irregular luminal surface, and no evidence of cap rupture evaluated in multiple adjacent frames |
Calcified nodule | A single or multiple regions of calcium that protrudes into the lumen, frequently forming sharp, jutting angles |
Aneurysms | Cavity-like appearance, may be true or false depending on disruption of EEM with a true and false lumen |
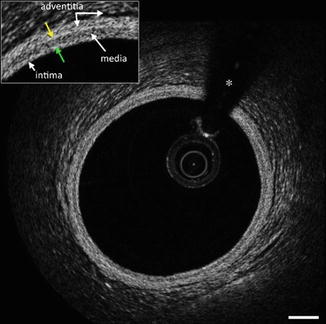
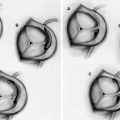
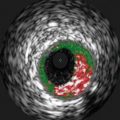
Fig. 9.4
Different Plaque Compositions on OCT: (a) Fibrous Plaque with intact IEM (green arrow) and EEM (yellow arrow). (b) Plaque without IEM or IEM (white arrow). (c) Fibrocalcific plaque with signal poor heterogonous lesions with well-demarcated margins. (d) Mixed plaque with both calcified plaque (red arrows) and signal poor plaque with poorly defined margins (yellow arrows). The asterisk (*) is wire artifact(From Tearney et al. [1] with permission)
Fig. 9.5
OCT-TCFA a signal poor plaque with poorly defined margins (yellow arrows) and a thin fibrous cap (red arrow) (From Tearney et al. [1] with permission)
Fig. 9.6
Inverted grey scale OCT with punctuate high backscattering focal area consistent with macrophages (red arrows). The asterisk (*) is wire artifact (From Tearney et al. [1] with permission)
Fig. 9.7
(a) OCT revealing intimal vasculature (yellow arrows) with well-defined areas with low backscatter. (b) Cholesterol crystals (yellow arrows) with linear areas with high backscatter. The asterisk (*) is wire artifact (From Tearney et al. [1] with permission)
Fig. 9.8
Thrombus characterization by OCT. (a) Red thrombus with high backscatter and attenuation (yellow arrow). (b) White thrombus with homogenous backscatter and low attenuation (white arrow). The asterisk (*) is wire artifact (From Tearney et al. [1] with permission)