(13.1)
Equation (13.1) represents the hypothesis that the perimeter of the smallest possible reentrant circuit is
 which is a different version of the wavelength (λ) described above;
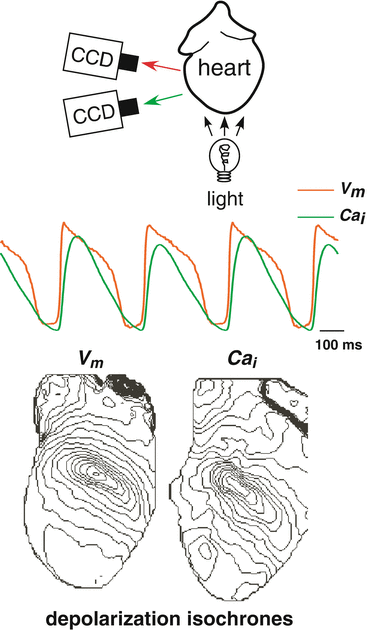
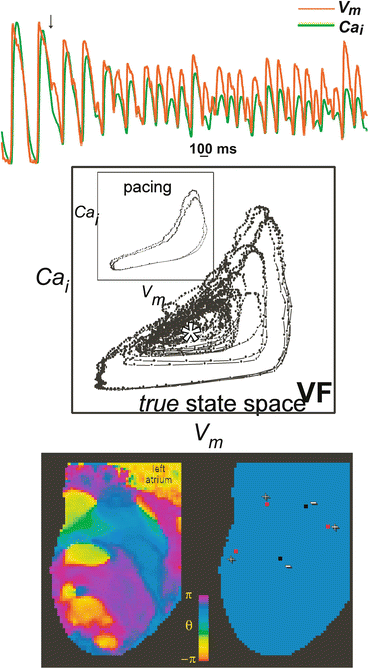
 The optical mapping modality integrates fast and simultaneous data acquisition with the quantitative visualization of electrophysiological function combined with anatomy, and therefore, establishes it as an ideal and indispensable tool for understanding the mechanisms of VF dynamics. Due to the high spatiotemporal resolution afforded by optical mapping and the ability to record on the whole organ level, it is an essential complementary tool to the traditional electrophysiological recording methods, such as multi-electrode arrays, electrocardiographs, and patch-clamping. In optical mapping, cardiac tissue is stained with one (or more) dye which are excited via a light source and whose emission spectra (spectrum) are changed due to changes in the underlying variable, and subsequently recorded as emitted fluorescence as shown in Fig. 13.1. Figure 13.1 illustrates “dual camera” optical mapping in which one charged-coupled-device (CCD) camera records transmembrane potential (V m ) and a second camera records intracellular calcium (Ca i ) simultaneously from the same surface (Gray et al. 2006). Dual camera optical mapping can also be used to record from both the anterior and posterior epicardial surfaces of the isolated heart (Banville et al. 1999; Banville and Gray 2002) or epi- and endocardial surfaces of tissue slabs simultaneously (Evans and Gray 2004). The middle panel of Fig. 13.1 illustrates examples of V m (red) and Ca i (green) signals as a function of time from one location. The great advantage of video imaging is the very high-spatial resolution which is exemplified in the bottom panel which shows uninterpolated “isochrones maps” of the depolarization process for both V m (left) and Ca i (right) which illustrate, in one image, the sequence of activation. Typically, fluorescence signals in optical mapping provide measures of only relative (not absolute) changes of the variable of interest, and therefore are normalized. An example of dual camera optical mapping of V m (left) and Ca i during VF is presented in Fig. 13.2 (Gray et al. 2000). The top panel shows examples of V m (red) and Ca i (green) signals from one site on the epicardial surface during VF. The middlle panel shows the same data as in the top panel, but with time parameterized, i.e., V m (t) versus Ca i (t). The inset of the middle panel shows similar data for the pacing signals in Fig. 13.1 for comparison. The middle panel shows trajectories for one site in “true” state space since both V m and Ca i are measured variables (Gray et al. 2006). One can choose a “centroid”, i.e., (V m *, Ca i *), in state space (indicated by white asterisks) and generate a new phase “state-space encoded phase variable” as
![$$ \theta \left(x,y,t\right)= \arctan \left[C{a}_i\left(x,y,t\right)-C{a}_i^{*},{V}_m\left(x,y,t\right)-{V}_m^{*}\right]. $$](/wp-content/uploads/2016/09/A320817_1_En_13_Chapter_Equ2.gif)
As described previously, this phase transformation allows for the identification of the location, number, and chirality of rotors on the heart surface as phase singularities, even if they are unstable or short-lived (see bottom panel of Fig. 13.2) (Jalife et al. 1998).

Fig. 13.1
Schematic of optical mapping methodology and example output during pacing. (Top) A dual camera setup to record both transmembrane potential (V m ) intracellular calcium concentration (Ca i ) simultaneous from the surface of an isolated Langendorff-perfused heart. A heart stained with two fluorescence dyes, RH237 for V m (red), and Rhod2 for Ca i (green). The dyes are excited by a light source (532 nm laser) and the emitted fluorescence signals are recorded via two charged-coupled-device (CCD) cameras. Bandpass emission filters were placed in front of the CCDs (centered at 645 nm for Vm and 590 nm for Cai). (Middle) Example of V m (red) and Ca i (green) signals from one location. (Bottom) Isochrone maps illustrating the position of the activation wavefront for both V m (left) and Ca i (right) every 2 ms resulting from pacing from the center of the anterior surface of a rabbit heart

Fig. 13.2
Example optical mapping output during ventricular fibtrillation (VF) in the rabbit heart (using dual camera system shown in Fig. 13.1). (Top) Example of transmembrane potential V m (red), and intracellular calcium concentration, Ca i (green) signals from one location. (Middle) The data from the Top panel plotted in state space, i.e., Ca i versus V m . The inset shows the analogous plot during pacing (data from Fig. 13.1. Middle panel) in which trajectories tranverse counter-clockwise and small Ca i alternans can been seen. During VF, the trajectories are still predominately counter-clockwise, but exhibit a large variety in “loop” shape exemplifying the variations of minimum and maximum values of V m and Ca i . (Bottom) Phase map (left) and phase singularity map (right) of one frame during VF; clockwise phase singularities are red and counter-clockwise phase singularities are black. At this instance there are three clockwise and two counterclockwise phase singularities on the epicardial anterior surface
![$$ \theta \left(x,y,t\right)= \arctan \left[C{a}_i\left(x,y,t\right)-C{a}_i^{*},{V}_m\left(x,y,t\right)-{V}_m^{*}\right]. $$](/wp-content/uploads/2016/09/A320817_1_En_13_Chapter_Equ2.gif)
(13.2)
For many years, fibrillation has been described qualitatively as randomly meandering reentrant wavelets (Wiggers et al. 1930; Moe and Abildskov 1959). According to this “multiple wavelet” hypothesis, fibrillation is maintained by multiple reentrant waves distributed randomly throughout the heart; thus each region of the heart is equally capable of contributing to sustaining the arrhythmia (Wiggers et al. 1930; Moe and Abildskov 1959). An alternative “mother rotor” hypothesis, which states that fibrillation is maintained by a single stable reentrant wave with fibrillatory conduction away from the source, has been recently revived (Scherf et al. 1948; Wellner et al. 2002b; Tabereaux et al. 2009). The ability to image arrhytmia dynamics with high spatiotemporal resolution in various animal models, along with non-linear wave theory including reentrant spiral waves, has greatly expanded the understanding of the mechanisms underlying fibrillation. In 1992, Davidenko et al. (1992) optically imaged epicardial muscles of dog and sheep and demonstrated that the core of reentant spiral waves could either be anchored or drifting and contained an “excitable gap”. Then in 1995, Gray et al. (1995a) used optical mapping to capture a single rapidly moving rotor in isolated rabbit hearts that resembles fibrillation electrocardiographically, thereby experimentally establishing the concept that the underlying activity of fibrillation can be due to the movement of a single rotor. In 1998, Jalife et al. (1998) introduced cardiac phase mapping and demonstrated an unprecedented amount of organization during VF, and provided a quantitative and mathematically justified means to identify both stable and unstable short-lived rotors via “phase singularities” (PSs). Subsequently, Choi et al. (2002) studied VF dynamics in time, space, and frequency domains in rabbit hearts to show that during fibrillation multiple wavelets are spatially unanchored, temporally unstable, and result in continuous wave breaks. Kay et al. (2006) explored the possibility of a mother rotor driving fibrillation in hearts comparable in size to human hearts. By optically imaging pig hearts, they observed that persistent stable rotors are absent and rather, short-lived rotors were common. They concluded that VF maintenance relies on the formation of new rotors. Additionally, Chen et al. (2000b) noted that in the isolated rabbit heart, some forms of VF are attributable to a single or small number of stable, high frequency periodic sources (a mother rotor) accompanied by fibrillatory conduction and short-lived wave breaks at some distance from this dominant stable rotor. Alternatively, Liu et al. (2004) proposed that both multiple wavelets and a mother rotor can co-exist in acutely ischemic rabbit ventricles. In short, it is likely that the tissue condition, electrophysiological variables, APD restitution, and the stage of VF all factor into the mechanism that underlies a particular fibrillatory activity and the ability to spatiotemporally monitor the VF dynamics using optical mapping will lead to better and improved therapies that target the specific mechanism.
In this chapter we quantitatively investigate the relationship between heart size D crit by analyzing optical mapping data acquired during VF from four different animal models, small (rabbit) and large (pig) hearts perfused with two different electromechanical uncoupling drugs, cytochalasin D (CytoD), and diacetyl monoxime (DAM), that alter electrophysiology and affect VF dynamics. Specifically, we compare: (1) actual phase singularity density versus the “theoretical maximum” (assuming that the critical surface area for reentry is a region of tissue with area equal to D crit 2) and (2) the “theoretical minimum rotor diameter” (D crit ) and heart wall thickness.
2 Signal and Image Processing Tools in Cardiac Optical Imaging of VF
Data were previously acquired using two high-resolution charge-coupled device (CCD) cameras (BrainVision, MICAM01) to simultaneously record fluorescence from the anterior and posterior epicardium of the whole heart. Data from previously published studies from four animal models of heart size and drug were analyzed: small hearts (rabbits) perfused with CytoD (SC) (Banville and Gray 2002); with DAM (SD) (Banville and Gray 2002; Banville et al. 1999) and large hearts (pigs) perfused with CytoD (LC) (Banville et al. 2004); and with DAM (LD) (Chattipakorn et al. 2001). Nineteen episodes of SC (dt = 3.5 ms), 14 episodes of SD, 27 episodes of LC (dt = 2.0 ms), and 33 episodes of LD (dt = 4 ms) were selected for analysis (dt is the frame rate for the respective study). The experimental protocols have been described elsewhere (Banville and Gray 2002; Banville et al. 1999; Chattipakorn et al. 2001). Images of the anterior and posterior views of a rabbit and pig heart recorded by the camera are shown in Fig. 13.3.
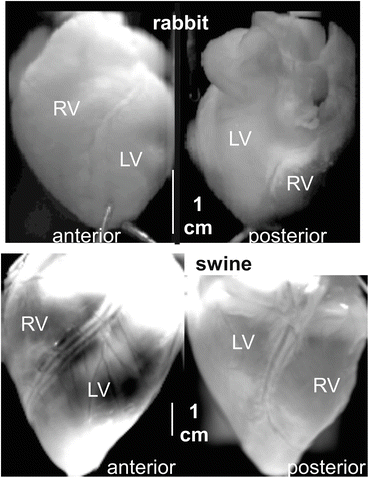

Fig. 13.3
Small rabbit and large swine heart images illustrating the high spatial resolution provided by video imaging. (Top) Images of the anterior and posterior surfaces of the rabbit (small) heart. (Bottom) Images of the anterior and posterior surfaces of the swine (large) hearts. The ventricular chambers are identified as LV (left ventricle) and RV (right ventricle). Scale bars indicate 1 cm
2.1 Signal Processing
We analyzed episodes of both VF initiation (all models) and sustained VF for LC and LD (neither SC nor SD exhibited sustained VF) (Banville and Gray 2002). The episodes of VF initiation were time aligned to the time of shock (t = 0 ms). All raw data were processed and filtered as described in the original publications (Banville and Gray 2002; Banville et al. 1999), with the exception of LD in which a 3 × 3 × 3 spatio-temporal boxcar filter was applied since no spatial filtering was done originally (Chattipakorn et al. 2001). For VF initiation episodes, the fluorescence signal from each site was normalized using the paced action potential and was converted to phase (θ) by translating the signals to a polar coordinate system using “reconstructed” (as opposed to true, described above) state space (Jalife et al. 1998):
![$$ \theta \left(x,y,t\right)= \arctan \left[F\left(x,y,t+\tau \right)-{F}^{*},F\left(x,y,t\right)-{F}^{*}\right], $$](/wp-content/uploads/2016/09/A320817_1_En_13_Chapter_Equ3.gif)
where t is time in milliseconds, τ is the delay factor (10 ms) and F* is the polar origin in reconstructed state space. We choose F* as follows:  of the fluorescence level of the action potential amplitude of the last paced beat for VF initiation (Gray and Jalife 1998); or
  of range during sustained VF. Depolarization time (DT) and repolarization time (RT) were computed as the time when θ = π/2 and θ = −2π/3, respectively (DTs and RTs were linearly interpolated between frames); this method for computing DT and RT has been validated over a wide range of pacing intervals in the rabbit heart (Banville and Gray 2002). A 5-point median spatial filter was applied to each DT map to reduce noise artifacts in the computation of CV.
![$$ \theta \left(x,y,t\right)= \arctan \left[F\left(x,y,t+\tau \right)-{F}^{*},F\left(x,y,t\right)-{F}^{*}\right], $$](/wp-content/uploads/2016/09/A320817_1_En_13_Chapter_Equ3.gif)
(13.3)
 of the fluorescence level of the action potential amplitude of the last paced beat for VF initiation (Gray and Jalife 1998); or
  of range during sustained VF. Depolarization time (DT) and repolarization time (RT) were computed as the time when θ = π/2 and θ = −2π/3, respectively (DTs and RTs were linearly interpolated between frames); this method for computing DT and RT has been validated over a wide range of pacing intervals in the rabbit heart (Banville and Gray 2002). A 5-point median spatial filter was applied to each DT map to reduce noise artifacts in the computation of CV.
2.2 Conduction Velocity
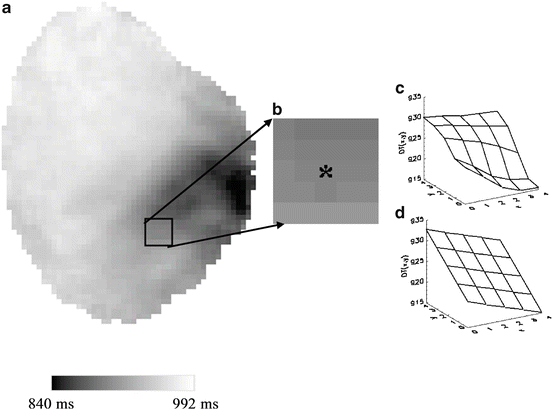
Conduction velocity (CV) was computed using a modified method of Bayly et al. (1998) as illustrated in Fig. 13.4. Briefly, DT movies were generated by filling every interval of DTn to DTn+1 for each pixel with the corresponding DTn value to generate a DT (isochrone) map at every time frame. CV was calculated at every pixel on the heart by fitting the surrounding 5 × 5 region of DTs to a plane, represented by the equation ax + by + c = DT(x,y), using a least-squares fitting method of a surface in three dimensions. When the center pixel was at the edge of the mapped surface, at least four neighboring DTs within the surrounding 5 × 5 region were required to compute CV. The activated pixels were represented by a set of linear equations, T(x,y) = A·K, to perform the planar fit:
![$$ \left[\begin{array}{c}\hfill {\mathrm{DT}}_1\hfill \\ {}\hfill {\mathrm{DT}}_2\hfill \\ {}\hfill \vdots \hfill \\ {}\hfill \vdots \hfill \\ {}\hfill {\mathrm{DT}}_{\mathrm{M}}\hfill \end{array}\right]=\left[\begin{array}{ccc}\hfill {\mathrm{x}}_1\hfill & \hfill {\mathrm{y}}_1\hfill & \hfill 1\hfill \\ {}\hfill {\mathrm{x}}_2\hfill & \hfill {\mathrm{y}}_2\hfill & \hfill 1\hfill \\ {}\hfill \vdots \hfill & \hfill \vdots \hfill & \hfill \vdots \hfill \\ {}\hfill \vdots \hfill & \hfill \vdots \hfill & \hfill \vdots \hfill \\ {}\hfill {\mathrm{x}}_{\mathrm{M}}\hfill & \hfill {\mathrm{y}}_{\mathrm{M}}\hfill & \hfill 1\hfill \end{array}\right]\cdot \left[\begin{array}{c}\hfill \mathrm{a}\hfill \\ {}\hfill \mathrm{b}\hfill \\ {}\hfill \mathrm{c}\hfill \end{array}\right], $$](/wp-content/uploads/2016/09/A320817_1_En_13_Chapter_Equ4.gif)
where M is the total number of pixels in the region; A is an M × 3 column matrix of the x- and y-coordinates in the first and second columns, respectively; T(x,y) is an M × 1 column matrix of DT values; and K is a 3 × 1 column matrix of unknown coefficients a, b, and c. The matrix A−1 was found using singular value decomposition and multiplied by T(x,y) to get the unknowns of K. The fitted plane, Tfit(x,y), was determined by finding the dot product of A and K. CV was computed by determining the gradient of Tfit(x,y):
![$$ \nabla {\mathrm{T}}_{\mathrm{fit}}={\left[\partial {\mathrm{T}}_{\mathrm{fit}}/\partial \mathrm{x},\partial {\mathrm{T}}_{\mathrm{fit}}/\partial \mathrm{y}\right]}^{\mathrm{T}} $$](/wp-content/uploads/2016/09/A320817_1_En_13_Chapter_Equ5.gif)
The x- and y-components of CV, dx/dTfit and dy/dTfit, were calculated using Eq. (13.5) where  and
and  as:
as:
![$$ \left[\begin{array}{c}\hfill \frac{\mathrm{dx}}{{\mathrm{dT}}_{\mathrm{fit}}}\hfill \\ {}\hfill \frac{\mathrm{dy}}{{\mathrm{dT}}_{\mathrm{fit}}}\hfill \end{array}\right]=\left[\begin{array}{c}\hfill \frac{{\mathrm{T}}_{\mathrm{fit},\mathrm{x}}}{{{\mathrm{T}}_{\mathrm{fit},\mathrm{x}}}^2+{{\mathrm{T}}_{\mathrm{fit},\mathrm{y}}}^2}\hfill \\ {}\hfill \frac{{\mathrm{T}}_{\mathrm{fit},\mathrm{y}}}{{{\mathrm{T}}_{\mathrm{fit},\mathrm{x}}}^2+{{\mathrm{T}}_{\mathrm{fit},\mathrm{y}}}^2}\hfill \end{array}\right], $$](/wp-content/uploads/2016/09/A320817_1_En_13_Chapter_Equ6.gif)
because CV cannot be obtained by simply inverting the elements of  . Two differences exist between our method and Bayly et al.’s method. First, we did not use a time window when performing the least squares fit because we created DT “movies” as described above. Second, a planar fit was used instead of a polynomial fit due to the higher spatial resolution of our optical mapping data compared to the electrical mapping data used by Bayly et al. (1998).

Fig. 13.4
Computing conduction velocity (CV). (a) Epicardial DT map at t = 992 ms of a VF episode of a small heart (rabbit) with cytochalasin D; the greyscale bar illustrates the range of values. (b) A 5 × 5 region to which the least-squares fitting of a plane was applied. An asterisk marks the pixel of interest at which CV (0.16 mm/ms) was calculated for this 5 × 5 region. (c) Surface plot of the original DTs of the 5 × 5 region. (d) Planar fit of the same 5 × 5 region
![$$ \left[\begin{array}{c}\hfill {\mathrm{DT}}_1\hfill \\ {}\hfill {\mathrm{DT}}_2\hfill \\ {}\hfill \vdots \hfill \\ {}\hfill \vdots \hfill \\ {}\hfill {\mathrm{DT}}_{\mathrm{M}}\hfill \end{array}\right]=\left[\begin{array}{ccc}\hfill {\mathrm{x}}_1\hfill & \hfill {\mathrm{y}}_1\hfill & \hfill 1\hfill \\ {}\hfill {\mathrm{x}}_2\hfill & \hfill {\mathrm{y}}_2\hfill & \hfill 1\hfill \\ {}\hfill \vdots \hfill & \hfill \vdots \hfill & \hfill \vdots \hfill \\ {}\hfill \vdots \hfill & \hfill \vdots \hfill & \hfill \vdots \hfill \\ {}\hfill {\mathrm{x}}_{\mathrm{M}}\hfill & \hfill {\mathrm{y}}_{\mathrm{M}}\hfill & \hfill 1\hfill \end{array}\right]\cdot \left[\begin{array}{c}\hfill \mathrm{a}\hfill \\ {}\hfill \mathrm{b}\hfill \\ {}\hfill \mathrm{c}\hfill \end{array}\right], $$](/wp-content/uploads/2016/09/A320817_1_En_13_Chapter_Equ4.gif)
(13.4)
![$$ \nabla {\mathrm{T}}_{\mathrm{fit}}={\left[\partial {\mathrm{T}}_{\mathrm{fit}}/\partial \mathrm{x},\partial {\mathrm{T}}_{\mathrm{fit}}/\partial \mathrm{y}\right]}^{\mathrm{T}} $$](/wp-content/uploads/2016/09/A320817_1_En_13_Chapter_Equ5.gif)
(13.5)
 and
and  as:
as:![$$ \left[\begin{array}{c}\hfill \frac{\mathrm{dx}}{{\mathrm{dT}}_{\mathrm{fit}}}\hfill \\ {}\hfill \frac{\mathrm{dy}}{{\mathrm{dT}}_{\mathrm{fit}}}\hfill \end{array}\right]=\left[\begin{array}{c}\hfill \frac{{\mathrm{T}}_{\mathrm{fit},\mathrm{x}}}{{{\mathrm{T}}_{\mathrm{fit},\mathrm{x}}}^2+{{\mathrm{T}}_{\mathrm{fit},\mathrm{y}}}^2}\hfill \\ {}\hfill \frac{{\mathrm{T}}_{\mathrm{fit},\mathrm{y}}}{{{\mathrm{T}}_{\mathrm{fit},\mathrm{x}}}^2+{{\mathrm{T}}_{\mathrm{fit},\mathrm{y}}}^2}\hfill \end{array}\right], $$](/wp-content/uploads/2016/09/A320817_1_En_13_Chapter_Equ6.gif)
(13.6)
 . Two differences exist between our method and Bayly et al.’s method. First, we did not use a time window when performing the least squares fit because we created DT “movies” as described above. Second, a planar fit was used instead of a polynomial fit due to the higher spatial resolution of our optical mapping data compared to the electrical mapping data used by Bayly et al. (1998).
2.3 Standard Electrophysiological Variables: CL, APD, and CV
Cycle length (CL) was calculated as the time interval between consecutive DTs, APD was calculated as the time interval between RT and the previous DT was calculated as the time interval between DT and the previous RT. CL and DT movies were generated by filling the DT-DT intervals of all pixels with the corresponding CL or DT value. Therefore, once a pixel was activated, it retained the CL or DT value until the next activation, at which time the pixel is set equal to the new CL or APD value. APD movies were similarly constructed, and updated every RT. This method overcomes problems associated with beat-to-beat analysis. CLs and APDs falling outside the range of [median CL/2, 2*median CL] and [median APD/2, 2*median APD], respectively, were considered to be outside a physiologically acceptable range and were not included in the analysis. Median CL and APD were determined from CLs and APDs from every pixel of each episode of each animal over the full duration of VF. The global spatial mean and the global spatial standard deviation (spatial dispersion) were computed from the movies of all electrophysiological factors for the four animal models. In addition, the mean spatial dispersion of APD (APDsd) and of CV (CVsd) were computed from the average of the spatial standard deviation. The electrophysiological variables are plotted versus time at 28 ms intervals (28 ms was the least common multiple of the recording rates of the four animal models).
2.4 Heart Geometry
The thicknesses and the rabbit right ventricle (RV), left ventricle (LV) and septum were taken from Table 2 of Vetter and McCulloch (1998) and are equal to 0.17, 0.49, and 0.49 cm respectively. The corresponding values for the pig were provided by Flavio Fenton (Georgia Tech University) from the model generated by Stevens et al. (2003) and are: 0.5 cm for RV; 0.81 cm for LV, and 1.19 cm for the septum.
2.5 Dcrit and Phase Singularity Density
We assumed that the measured CV represents the geometrical mean of longitudinal (L) and transverse (T) velocities, i.e.,  . Since fibers are aligned perpendicular to the transmural direction, CV T is used in Eq. (13.1) for the comparisons with the wall thickness values (using an anisotropy ratio of 3) (Schalij et al. 1992). Phase singularities (PS) were identified automatically by computing the line integral of the change in phase,

around each pixel (for each frame) using the 8 nearest neighbors. This integral is equal to zero everywhere except where a PS exists where it is equal to  where the sign indicates the spiral wave chirality on the epicardial surface. This line integral was computed at every pixel and then the resulting movies were “masked” to manually select rectangular regions. This was done to avoid the difficulties associated with identification of PS’s such as edge effects, motion, and low signal-to-noise ratio.
 . Since fibers are aligned perpendicular to the transmural direction, CV T is used in Eq. (13.1) for the comparisons with the wall thickness values (using an anisotropy ratio of 3) (Schalij et al. 1992). Phase singularities (PS) were identified automatically by computing the line integral of the change in phase,
(13.7)
 where the sign indicates the spiral wave chirality on the epicardial surface. This line integral was computed at every pixel and then the resulting movies were “masked” to manually select rectangular regions. This was done to avoid the difficulties associated with identification of PS’s such as edge effects, motion, and low signal-to-noise ratio.
3 Optical Imaging Study of the Critical Mass Hypothesis for VF
The tachyarrhythmias of the four animal models and control were analyzed for various electrophysiological variables, APD restitution, phase singularity, and heart size and thickness. The results suggest a relationship between electrophysiological variables and heart size in regards to VF dynamics.
3.1 Pacing
Isochrone maps illustrating the pattern of wave propagation during pacing are shown in Fig. 13.5. We computed all electrophysiological variables during pacing (last beat before VF initiation via a T-wave shock) to allow comparison to values recorded during early VF. The values are presented in Table 13.1. There were differences among the four animal models in APD, CV, and APD dispersion.
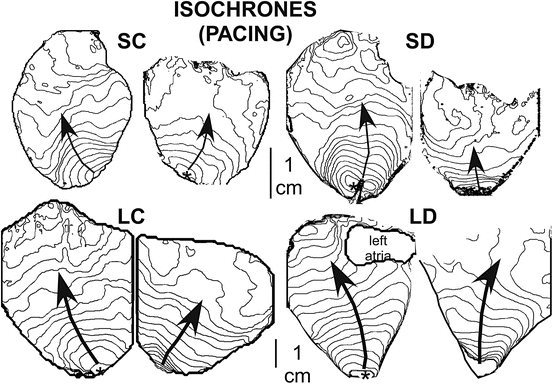

Fig. 13.5
Isochrone maps demonstrating the pattern of depolarization wave propagation during pacing for the four animal models (SC, SD, LC, LD). The pacing site is indicated by an asterisk, and arrows indicate the direction of propagation. The lines indicate the position of the wave front at 3.5 ms intervals (SC and SD) or 4.0 ms (for LC and LD)
Table 13.1
Average values of APD, CV, CL and of APDsd and CVsd before VF induction
Animal model | APD (ms) | CV (cm/s) | CL (ms) | APDsd (ms) | CVsd (cm/s) |
|---|---|---|---|---|---|
SC | 180 ± 12 | 41 ± 2 | 264 ± 22 | 9.9 ± 3.0 | 20 ± 2 |
SD | 94 ± 16 | 52 ± 3 | 251 ± 1 | 14.9 ± 3.5 | 20 ± 1 |
LC | 130 ± 5 | 38 ± 8 | 254 ± 16 | 18.1 ± 4.4 | 20 ± 4 |
LD | 127 ± 17 | 49 ± 6 | 300 ± 11 | 17.1 ± 2.1 | 20 ± 2 |
3.2 ECG Morphology
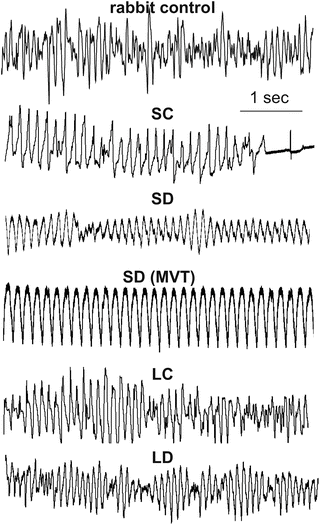
Representative ECGs of tachyarrhythmias exhibited by the four animal models (as well as from a control rabbit heart that exhibited sustained VF) are shown in Fig. 13.6. By visual determination of the fluorescence movies, episodes that appeared to be monomorphic VT (see SD MVT in Fig. 13.6) were excluded in the analysis. VF of SC always spontaneously terminated in contrast to the sustained arrhythmias for LC, LD and SD (SD episodes usually stabilized to MVT).

