Key Points
- •
Osteoarthritis involves all structures of the joint.
- •
Osteoarthritis is the most common form of arthritis.
- •
There is no direct correlation between radiographic findings and symptoms.
- •
Radiographs are insensitive indicators of osteoarthritis.
- •
Magnetic resonance imaging can delineate articular cartilage changes as well as evaluate changes to the other articular structures.
DEFINITION
Osteoarthritis (OA) (also called osteoarthrosis or degenerative joint disease ) is a “heterogeneous group of conditions that lead to joint symptoms and signs, which are associated with defective integrity of articular cartilage, in addition to related changes in the underlying bone at the joint margins.” In contrast to some definitions emphasizing that OA is a disease of hyaline articular cartilage, the disorder is now believed to involve the entire joint including cartilage, bone, ligaments, menisci, periarticular muscles, capsule, and synovium.
The disorder occurs due to altered local mechanical factors in a susceptible individual. Local factors include joint malalignment, muscle weakness, injury, previous knee surgery, occupational bending and lifting, or meniscal tears. Increasing age, female sex, possibly nutritional deficiencies, and genetic predisposition are examples of systemic predisposing factors. Obesity increases the likelihood of developing OA.
Joint involvement is asymmetric and focal, unlike the more diffuse involvement of inflammatory arthritis. Localized areas of cartilage loss can increase stress on that area, leading to further cartilage loss. Eventually, large areas of deficient cartilage or bony remodeling result in malalignment, which leads to further focal joint loading and further damage.
The changes of OA in a joint are asymmetric.
SCOPE OF THE PROBLEM
OA is the most common form of arthritis and the leading cause of disability in the elderly. More than 43 million individuals have degenerative joint disease in the United States. Peat et al. found the prevalence of painful, disabling knee OA in people older than 55 years in the United Kingdom and the Netherlands to be 10%. One quarter of these people were severely disabled. As the population ages, the disorder is likely to increase in frequency and its consequences to public health will become more profound.
PATHOLOGIC FEATURES
The pathologic features of OA have been summarized by Felson. Cartilage is composed of an extensive extracellular matrix made of type II collagen and aggrecan and other molecules surrounding chondrocytes (cells that synthesize the matrix and the enzymes that break it down). Aggrecan contains highly negatively charged glycosaminoglycan (GAG) chains that are held in proximity to each other by collagen II chains interwoven in the matrix. The negatively charged glycosaminoglycan chains repel each other, providing the compressive stiffness of the cartilage.
Hyaline cartilage is the site of the initial changes in osteoarthritis. In early OA, the net concentration of aggrecan falls (degradation is greater than synthesis), the negative charges are exposed, and these charges attract water into the cartilage, leading to swelling. Deterioration in the biomechanical properties of cartilage and aggrecan and collagen loss and injury lead to wearing away of cartilage, eventually exposing the subchondral bone. Subchondral bone remodeling leads to denser bone with filling in of the spaces between trabeculae, which can be seen on radiographs. Endochondral bone formation occurs at the margins of the joint, resulting in chondroosteophytes (usually called osteophytes ). These help stabilize the joint. Synovitis occurs in 20% to 30% of cases. Muscle changes also develop with decreased strength and atrophy of the fast twitch fibers that help stabilize the joint or respond to unanticipated stresses.
DIAGNOSIS
The diagnosis of OA is suggested clinically when an older patient complains of pain and stiffness and there is decreased mobility and absence of systemic features. The hands, knees, and hips are the most commonly affected joints. Typically pain is worse with activity and improved with rest. Rest pain may be seen, however, with severe symptomatic disease but should suggest that other disorders be considered (e.g., inflammatory arthritis). Unlike inflammatory arthritis, morning stiffness lasts less than 30 minutes. The diagnosis of OA is supported by typical findings on radiographs, but these are insensitive for confirming early disease. Radiographs are indicated if pain is nocturnal or at rest or persists after effective treatment. Magnetic resonance imaging (MRI) can exclude other causes of pain and directly allow any cartilage damage to be assessed.
Typically the pain of OA occurs with activity and improves with rest.
GENERAL IMAGING FEATURES
Radiography
Correlation of Radiographic Findings with Cartilage Changes
Correlation of arthroscopic findings with radiographic features has shown that significant cartilage degeneration may be present in the absence of radiologic findings.
Correlation of Radiographic Findings with Symptoms
Osteophytes at the knee and cartilage space narrowing at the hip are more strongly correlated with joint pain than is a global grade of OA severity. Felson et al. correlated clinical OA with a variety of definitions of radiographic OA. They determined that a knee should be classified as having radiographic OA if there is either an osteophyte of grade 2 or greater severity (0 to 3 scale) or there is moderate to severe joint space narrowing (≥ 2 on a 0 to 3 scale) as well as a bony feature in the affected compartment. Lanyon et al. assessed the correlation between radiographic features of OA and knee pain. The presence of osteophytes at either the tibiofemoral or patellofemoral joint were more efficient at predicting pain than was assessment of cartilage space. Evaluation of the patellofemoral joint in addition to the tibiofemoral joint is important, as the patellofemoral articulation is often a source of pain.
Radiographic Scoring
Scoring systems are utilized primarily for investigational purposes such as drug trials, but review of these systems highlights the significance of various radiologic features in diagnosis generally.
- •
What is assessed: Radiographic grading of OA typically includes assessment of osteophytes and cartilage space narrowing. Other features such as sclerosis and cyst formation have lower reproducibility but are included in some grading systems. Clinical and laboratory assessment may also be evaluated.
- •
Reproducibility of cartilage width assessment: Of the features of OA, cartilage space width is the most sensitive radiographic measurement for detecting change over time. The rate of cartilage loss in patients with hip or knee OA is about 0.25 mm per year. Because articular changes may be small, the reproducibility of cartilage thickness measurement is critical in following subjects over time. Reproducibility relates to several factors including uniform patient positioning on follow-up visits and measurement technique.
Some Grading Systems
Kellgren and Lawrence
Kellgren and Lawrence developed a system of grading OA that remains in use today. Various joints could be assessed, and a set of standardized radiographs was provided for reference.
The radiologic features that were considered in this grading system were as follows:
- 1
The formation of osteophytes on the joint margins or, in the case of the knee joint, on the tibial spines
- 2
Periarticular ossicles; these were found chiefly in relation to the distal and proximal interphalangeal joints ( Figure 8-1 )

FIGURE 8-1
OA of the DIP joint. This PA radiograph of the index finger shows small periarticular ossicles, which are indicators of OA.
- 3
Narrowing of the joint cartilage associated with sclerosis of subchondral bone
- 4
Small pseudocystic areas with sclerotic walls situated usually in the subchondral bones, particularly in the head of the femur
Grades of OA were described as follows ( Table 8-1 ):
- 0
None—a definite absence of the changes of OA
- 1
Doubtful
- 2
Minimal—definitely present but of minimal severity
- 3
Moderate
- 4
Severe
Kellgren and Lawrence noted that interobserver bias could result in prevalence of disease estimates that differed by ± 31%. It has subsequently been noted that this system has several additional limitations including overemphasizing the importance of osteophytes, and the failure of grading to correspond with symptoms or disability. It has been suggested that grading of OA may differ between joints. Using the Kellgren-Lawrence scale, if no osteophytes are present, osteoarthritis can not be diagnosed even if cartilage space narrowing is present. Brandt et al. also note that the Kellgren-Lawrence scale does not allow appropriate grading for patients with osteophytes and “definite” cartilage space narrowing who do not have sclerosis. These patients would be classified as having grade II (minimal) disease although cartilage loss could be prominent.
Other Scoring Systems
In 1995, an atlas (Osteoarthritis Research Society International [OARSI]) was published that illustrated the individual findings of OA in each joint or joint compartment. These could be used as reference standards for clinical trials.
A line drawing atlas that may simplify scoring has also been introduced. This atlas includes osteophytes and cartilage space narrowing as separate criteria. The use of line drawings (rather than radiographs) allows only one of these abnormalities to be presented on each illustration so that analysis of osteophytes, for example, is not influenced by the presence of cartilage space narrowing. Cartilage space narrowing was assessed separately for men and women. Both the femorotibial and patellofemoral joints were evaluated.
Magnetic Resonance Imaging
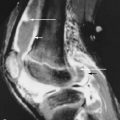
Virtually all the structures of a joint are involved in OA, and MRI is capable of delineating the morphology and to some degree the integrity of these tissues. Osteophytes are often more apparent on MRI than on radiographs. The cortex of the osteophyte and the marrow are continuous with those of the host bone, and these features are well demonstrated on MRI ( Figure 8-2 ). Subchondral edema, sclerosis, and cysts can be seen. Edema-like signal produces areas of intermediate to low signal on T1-weighted or intermediate-weighted images and bright signal on fluid-sensitive sequences. Subchondral fibrosis and trabecular thickening replacing normal marrow (which contains fat) result in hemispherical subchondral areas that are intermediate in signal on T1-weighted images and intermediate to low in signal on T2-weighted images. Cystic changes may occur within the areas of subchondral sclerosis, producing well-defined regions that contain fluid signal. Synovial hypertrophy occurs in OA to a lesser degree than in rheumatoid arthritis but may be visible on MRI.


Optimal imaging of the joint and particularly of the articular cartilage is technically complex and requires very high spatial resolution ( Figure 8-3 ). At the same time, examination times must be kept short to avoid motion artifact. Imaging parameters need to be adjusted so that articular cartilage can be differentiated both from the subjacent bone and also from the joint fluid. Because MRI techniques vary, it is important to review these technical factors when evaluating published studies or assessing images of articular cartilage (see Chapter 4 ). MRI has been shown to provide accurate assessment of articular cartilage volume, cartilage erosion, fissuring, thinning, signal change, and thickness in cadaver knees. The presence of changes in cartilage volume can be determined, but these advanced techniques are currently usually reserved for investigational purposes.


MRI generally allows detection of only intermediate-to-advanced osteoarthritic change in clinical cases. Correlative clinical and MRI studies have shown relationships between pain and synovitis, large effusions, patellofemoral osteophytes or more than four osteophytes in the knee, and enlarging bone marrow lesions.
Immediate imaging after intravenous contrast may be useful to evaluate synovitis (as is often done in patients with rheumatoid arthritis) (see Chapter 20 ), but in OA, delayed imaging after intravenous contrast (indirect arthrography) may also be useful. Delayed imaging provides an arthrographic effect that allows the articular cartilage to be better delineated.
d-GEMERIC
Largely investigational MRI techniques include T2 relaxation mapping, T1 rho relaxation mapping, and d-GEMERIC (delayed gadolinium-enhanced MRI of cartilage) to provide molecular information about articular cartilage. The d-GEMERIC technique utilizes MRI examination after intravenously administered gadolinium to noninvasively image the GAG concentration of articular cartilage. This is possible because GAG has a negative fixed charge density and Gadolinium DTPA (Magnevist, Berlex, NJ) is a divalent anion. GAG concentration is related to the mechanical properties of cartilage and is decreased in diseased cartilage. Intraarticular contrast injection may offer improved imaging but requires a more invasive injection technique.
Nomenclature for MRI
Standard nomenclature has been promulgated to facilitate communication. Interpretation criteria have been proposed, such as the KOSS scoring system and the WORMS score.
Ultrasound
Articular cartilage is seen on ultrasound as a hypoechoic band with sharp margins. Osteophytes and synovitis can also be evaluated. Not all areas can be assessed, and this technique requires operator expertise to be effective.
Positron Emission Tomography
Positron emission tomography (PET) is a functional imaging technique that enables metabolic mapping of the tissues in vivo using positron-emitting radionuclides. Fluorine 18 fluorodeoxyglucose (F-18 FDG) is the most commonly used radiopharmaceutical for PET scanning, and the degree of cellular uptake of FDG is proportional to cellular glucose metabolism. Integration with CT scanning allows precise localization of F-18 FDG–positive lesions, greatly facilitating image interpretation. Isotope uptake may also be quantified. PET scanning is usually used for evaluation of tumors, but labeled FDG is not a specific marker for cancer, and sites of infection and inflammation may also show high tracer uptake ( Figure 8-4 ).

HANDS/WRISTS
Although OA of the hands is one of the most prevalent diseases, diagnostic criteria are not clear. The American College of Rheumatology has proposed criteria for OA of the hand that provide a sensitivity of 94% and a specificity of 87% ( Box 8-1 ).

The most common areas of involvement, in decreasing order, are the distal interphalangeal (DIP) joints, the bases of the thumbs, the proximal interphalangeal (PIP) joints, and the metacarpophalangeal (MCP) joints. Findings are relatively symmetric. OA of other joints may accompany OA of the hand.
Clinically apparent bony nodules about the DIP joint (Heberden’s nodes) and similar features about the PIP joints (Bouchard’s nodes) likely (but not always) correspond to palpable osteophytes.
As in other joints, the hallmarks of OA of the hand are cartilage space narrowing, subchondral sclerosis, osteophytosis, and subluxation. Erosion and ankylosis are not typically present ( Figure 8-5 ). The significance of osteophytes without cartilage space narrowing is unclear; this finding could be an age-related change.


Interphalangeal Joints
Multiple joint involvement of the distal and proximal interphalangeal rows are characteristic features of OA, with DIP joint involvement significantly more common than PIP joint involvement. The highest incidence of hand OA is in the second DIP joint. DIP joint involvement may occur in the absence of PIP involvement; solitary PIP changes are rare. Cartilage loss results in apposition and remodeling of the subchondral bone, producing a characteristic osseous configuration likened to the wings of a bird (the “gull wing” sign). Osteophytes are marginal spike-like bony growths extending proximally from the distal phalanx at the DIP joint and proximally from the base of the middle phalanx at the PIP joint. There is a predilection for dorsal and volar osteophyte formation, which are therefore best seen on steep oblique or lateral views of the hand. Subluxation at the joint line usually occurs in the radial and ulnar directions, producing a characteristic zigzag appearance. This may in part be due to the tendency for osteophyte formation along the dorsal and volar joint margins, inhibiting subluxation in those directions.
Osteophytes are most common at the DIP and PIP joints and are best seen on lateral or steep oblique radiographs. Prominent MCP disease should suggest other underlying conditions.
Metacarpophalangeal Joints
MCP joint changes may be seen in OA but are less prominent than the changes seen in the interphalangeal joints. Unlike the asymmetric cartilage space narrowing in large joints, cartilage space narrowing seen with osteoarthritis in the MCP joints tends to be uniform. Marginal osteophytes at the MCPs are typically smaller than those in the interphalangeal joints, and subchondral cysts are generally small.
Prominent osteoarthritic changes in the second through fifth MCP joints are classically associated with other arthropathies such as rheumatoid arthritis, calcium pyrophosphate dihydrate deposition (CPDD) syndrome, and hemochromatosis (see Secondary OA on page 127 ) or with certain occupations involving repetitive stress on these joints.
Thumb Base
Radiographic changes of OA of the thumb base usually involve the trapeziometacarpal joint or, less often , the trapezioscaphoid joint. Findings of the disorder include cartilage space narrowing, sclerosis, cystic changes, osteophytosis, bony fragmentation, and radial subluxation ( Figure 8-6 ). If degenerative changes are seen at the trapezioscaphoid joint, 84% of these patients will have coexisting involvement of the trapeziometacarpal joint. Degenerative changes seen in isolation at the trapezioscaphoid joint, however, suggest other etiologies including CPPD and rheumatoid arthritis.


Anteroposterior (AP), lateral, and oblique views of the thumb are typically used for evaluation. A basal joint stress view provides clearer visualization of all trapezial facets and defines any subluxation of the joint.
It has been postulated that chronic loading leads to progressive instability and laxity of the trapezial ligaments and trapezial tilt away from the trapezoid. This “trapezial tilt” causes abnormal shear forces on the trapeziometacarpal joint, possibly leading to OA. There is a positive correlation between increased trapezial tilt angle and the severity of trapeziometacarpal OA. The trapezial tilt angle can be measured from the Robert’s view, which is a true AP view of the thumb.
Inflammatory (Erosive) OA
Inflammatory OA is a disorder most commonly affecting middle-aged women and characterized by acute episodes of inflammation of the interphalangeal joints of the hands. The relationship of erosive osteoarthritis to OA generally is uncertain; it may be a separate entity or an aggressive form of OA.
Radiography
Radiographic examination shows marginal osteophytes with or without bony erosions ( Figure 8-7 ). When erosions develop, they initially occur in the central portion of the subchondral bone, resulting in sharply marginated defects that eventually produce a “gull wing” deformity. These changes can be difficult to differentiate from psoriatic arthritis, although the presence of marginal erosion and fluffy new bone formation (a “mouse ears” appearance) is typical of psoriatic arthritis and may allow accurate diagnosis to be made. Bony ankylosis across the joint may occur but is a more typical feature of psoriatic arthritis.


Erosive OA results in a typical pattern of central erosion and remodeling that, because of its contour, has been termed the “gull wing” deformity.
Magnetic Resonance Imaging
High-resolution MRI has shed new light on this condition. In a study of 15 patients with OA of the small joints of the hand, micro-MRI revealed erosions, synovitis, and bone marrow edema— identical to the changes seen in inflammatory arthritis—in many joints. This suggests that erosive OA may actually be part of the spectrum of OA rather than a separate entity.
The MRI features of DIP joint changes of patients with OA have been compared with the changes seen in patients with psoriatic arthritis. Generally, osteoarthritic joints showed ligamentous and entheseal changes but much less inflammation than that seen in joints with psoriatic involvement. Difficulty was found in separating ligamentous changes of patients with OA from older control subjects. Osteoarthritic joints showed diffusely thickened ligaments, some with enhancement, extensor tendon enthesitis, and thickening of the extensor tendon. Ligament and tendon changes are seen even when cartilage appeared normal. Edema-like signal was noted only in joints with complete cartilage loss. In contrast, psoriatic patients showed greater enhancement at the origins and insertions of ligaments and the extensor tendon insertions, greater extracapsular enhancement with diffuse involvement of the nail bed, and diffuse bone marrow edema. Synovitis may be a component of OA as well as of rheumatoid arthritis. Dynamic contrast enhancement has been utilized to differentiate the synovitis in these two conditions.
Positron Emission Tomography
PET scanning is a potentially useful method of detecting early synovitis. Usually PET scans obtained for whole body evaluation of tumors do not allow assessment of the hands and wrists, but specific techniques may be used to evaluate these areas. Comparison of F18–FDG PET scanning of the hands and wrists of 14 patients with rheumatoid arthritis, 6 patients with primary OA, and 5 control patients (with fibromyalgia) has shown no increased uptake in control subjects. Joints with rheumatoid arthritis and clinical synovitis showed increased uptake in most but not all sites. A smaller number of joints showed increased uptake in patients with OA, suggesting that synovitis was also present in some areas. No distinction can be made based on the presence of uptake between rheumatoid arthritis and OA.
SHOULDERS
Radiographs
Multiple radiographic projections have been developed to assess various maladies of the glenohumeral joint ( Figure 8-8 ). A 40-degree posterior oblique, external rotation view (the Grashey projection) allows the glenohumeral cartilage space to be seen in profile and is therefore helpful for the assessment of arthritis. This projection is usually supplemented by an internal rotation AP view and by other views depending on the clinical question. Apple et al. suggest a Grashey view with the arm abducted and the patient holding a 1-lb weight to produce a loading force across the joint that approximates that of body weight. This may demonstrate cartilage space narrowing not visible on other radiographs. The axillary projection is helpful in delineating posterior subluxation that may complicate OA of the shoulder.

Because tumors of the lung apex may occasionally mimic shoulder symptoms, the apex of the lung is included on one radiographic view of each shoulder series at the Brigham and Women’s Hospital.
Radiographic findings of OA generally occur late in the disease. Marginal osteophytes develop around the anatomic neck and may be prominent medially ( Figure 8-9 ). The size of osteophytes from the inferior humeral head and glenoid margins on AP radiographs has been used to grade the severity of shoulder OA ( Table 8-2 ). Results of a cadaver study, however, have indicated the reliability of this system to be fair to poor. Eventually, the humeral head becomes flat and enlarged and subluxes posteriorly. Corresponding posterior glenoid erosion occurs and CT may be useful in preoperative planning to assess the degree of posterior bone loss. Rotator cuff tears are not a prominent feature of shoulder OA.


Positron Emission Tomography
Shoulder uptake may be seen as an incidental finding on PET scanning performed for evaluation of malignant disease. Assessment of the pattern of uptake may be helpful because circumferential diffuse uptake has been correlated with the presence of OA. This is thought to be due to increased metabolic activity associated with low-grade inflammation. Patients with rotator cuff disease or frozen shoulder demonstrated more focal patterns of uptake.
Ultrasound
In experienced hands and with proper equipment, ultrasound examination of joints can be remarkably helpful. In OA, ultrasound can be used to demonstrate any associated rotator cuff disruption. Intraarticular bodies can be identified and joint aspiration can be guided by ultrasound.
Magnetic Resonance Imaging
MRI can reveal findings of glenohumeral OA including osteophyte formation and subchondral marrow changes. It may be difficult to evaluate articular cartilage thickness, however. Acromioclavicular joint changes are frequently seen in asymptomatic individuals, and their presence should be correlated with clinical symptoms.
HIPS
Although early articular cartilage changes may be asymptomatic, progressive disease with the formation of osteophytes and subchondral sclerosis can lead to symptoms of generalized hip pain, pain in the lateral and anterior thigh or groin, and pain with prolonged ambulation. Physical examination may show an antalgic gait, decreased range of motion, pain on internal rotation, and a positive Trendelenburg sign.
Radiographs
Standard radiographic projections include a supine AP view of the pelvis, an AP view of the hip, and a “frog leg” lateral view of the hip with the patient rolled toward the affected side. Supine examination of the hip is generally satisfactory because changes in cartilage space are generally minimal between supine and weight bearing. The AP projections are obtained with the feet in internal rotation to correct for anteversion of the femoral neck ( Figure 8-10 ). When the hips are internally rotated, the lesser trochanters will be partially obscured, whereas the lesser trochanters are seen in profile when there is external rotation. The “false profile” view is an oblique lateral projection of the hip obtained in the erect position. It has been shown to be more sensitive than conventional AP views for detecting early cartilage space narrowing.


Normally, the acetabular roof (“sourcil”) shows uniform sclerosis and does not tilt upward (upward tilt suggests dysplasia). The cartilage space normally measures 3 to 8 mm in thickness superolaterally and 2 to 6 mm superomedially and is smaller in women than men. In about 80% of normal subjects, the cartilage space is wider superolaterally than superomedially. Usually the cartilage spaces are bilaterally symmetric, but asymmetry has been found in almost 6% of subjects. The smallest detectable difference in measuring cartilage space on serial radiographs is about 0.5 mm.
The normal hip cartilage space is uniform or slightly thinner superomedially. Superolateral thinning is likely abnormal.
Related posts:
Stay updated, free articles. Join our Telegram channel

Full access? Get Clinical Tree


