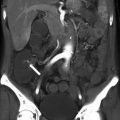
Fig. 1.1
Axial non-contrast CT image shows that the liver measures 10 HU less than the spleen secondary to fatty infiltration
The abnormal hepatic accumulation of copper, glycogen, or iron elevates the hepatic HU to values above 65 HU [1].
Non-contrast CT images provide baseline Hounsfield units for comparison with contrast-enhanced images to evaluate for lesion enhancement and distinguish this enhancement from hemorrhage or calcifications. Non-contrast images are also used to evaluate Lipiodol distribution after intra-arterial embolization of hepatic tumors.
Contrast-Enhanced CT
A liver protocol is used to evaluate most hepatic pathology, improving hepatic lesion identification and characterization [2, 3]. The protocol consists of non-contrast phase followed by multiphasic dynamic imaging with an intravenous iodinated contrast agent. A 16-detector scanner or greater needs to be used so that the entire liver can be covered during the late arterial phase. Multidetector scanners also allow the liver to be imaged at low energy or 80 kVp. An iodinated contrast material has a higher attenuation on 80 kVp images compared to high-energy or 140 kVp images, and low-kVp images can improve hepatic lesion detection [4]. Unfortunately in larger patients, a low kVp can produce images with too much noise to be diagnostic. We use automated exposure control (AEC) to adapt the tube current to the patient’s size to obtain quality images. AECs also lower radiation dose and have been shown to reduce the mean tube current by 20–68 % compared to exams that are obtained at constant tube current [5]. We also use reconstruction algorithms to enhance image quality of lower-dose scans.
At our institution, the images are obtained at 5 mm and reconstructed into 2.5 mm images.
Intravenous contrast should be administered using bolus tracking to ensure that accurate hepatic perfusional phases are obtained, regardless of a patient’s cardiac function, blood volume, or visceral perfusion. Bolus tracking monitors a target vessel or organ’s attenuation and begins the exam when the region of interest (ROI) reaches a designated threshold. Our institution places the ROI in the abdominal aorta near the celiac axis.
The late arterial phase is the first phase and is the most difficult phase to capture. Our liver protocol images the late arterial phase 17 s after the ROI reaches 100 HU, or approximately 30–35 s after the intravenous contrast was administered at a rate of 4–6 cc/s.
The late arterial phase is useful for identifying hypervascular lesions, including hepatocellular cancer (HCC), melanoma, and neuroendocrine metastases. The hepatic arterial anatomy can also be evaluated during this phase (Fig. 1.2).
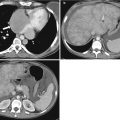
Fig. 1.2
Axial contrast-enhanced CT shows the early enhancement of the hypervascular HCC (black arrow) during the arterial phase
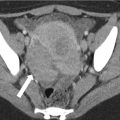
The portal venous phase is the second phase and is acquired approximately 60 s after contrast administration. The portal venous phase is used to identify hypovascular metastases such as those from colon cancer (Fig. 1.3). This phase is also used to evaluate the portal venous system and to determine segmental anatomy.
Fig. 1.3
Axial contrast-enhanced CT shows hypovascular colon cancer metastases (white arrows) during the portal venous phase
The excretory phase is the final phase and is acquired 3–5 min after contrast administration. This phase allows for additional characterization of lesions identified in the previous two phases. For example, a hypervascular lesion in a cirrhotic liver that has contrast washout on this phase is suspicious for HCC, while a lesion with progressive, centripetal filling is consistent with a hemangioma.
Magnetic Resonance Imaging
Magnetic resonance imaging (MRI) is increasingly utilized as the first-line modality for hepatic imaging. MRI’s prior limitations, which included long exam times and images with low temporal and spatial resolution and poor signal-to-noise ratios, have been improved with new advanced imaging techniques. The clear advantages MRI has over computed tomography (CT), which is currently the most common modality used for hepatic imaging, are MRI’s superb tissue contrast and lack of ionizing radiation. The recent introduction of hepatobiliary contrast agents has created new potential applications for MRI hepatic evaluation. The following sections will review the commonly used sequences for hepatic imaging. For these sequences, the normal liver signal relative to adjacent organs and the relative signal of the liver to common focal liver lesions and diffuse pathologies will also be presented.
Hepatic imaging is best performed at 1.5 or 3 T strength magnets using a multichannel phased-array coil. The basic MRI protocol for hepatic imaging has matured to include four sequences:
Axial T1-weighted imaging (T1WI)
Axial T2-weighted imaging (T2WI)
Axial diffusion-weighted imaging (DWI)
Axial precontrast and postcontrast imaging
T1-Weighted Imaging
T1-weighted imaging (T1WI) evaluation of the liver uses spoiled gradient echo (SPGR) techniques (GE Medical Systems, Milwaukee, USA) GE nomenclature will be used throughout. Please refer to Table 1.1, Appendix A. SPGR sequences can be obtained during a single breath hold, which minimizes respiratory motion artifact. Parallel imaging permits the acquisition of both in-phase (IP) and opposed-phase (OP) images during a single breath hold, when using 5 mm slice thickness or 30 slices, eliminating registration errors [8]. Parallel imaging is able to speed up scan time because only a portion of the k-space data is sampled with an array of receiver coils. The undersampled data can then be reconstructed into images using various algorithms [9]. In a 1.5T scanner, OP images are usually acquired at a TE of 2.1 ms while IP images are acquired at a TE of 4.2 ms.
The terms in-phase and out-of-phase refer to the relative phases of the signal of water and fat protons. In the out-of-phase series, the fat signal will cancel with corresponding water signal. In contrast, the in-phase series will result in the addition of both proton signals.
The normal liver will have the same signal intensity on IP T1WI and OP T1WI. The liver is slightly hyperintense to the spleen, muscle, and kidneys. The signal is dependent on the liver’s fat and iron content. In the setting of fatty infiltration, the liver signal increases on IP T1WI and decreases on OP T1WI (Fig. 1.4). This is also useful to detect microscopic fat within lesions. In the setting of iron overload in the liver, the liver is brighter on the OP relative to the IP images. This is due to the T2*-related signal loss on the longer echo time [10]. Similar susceptibility effects from iron and other metals can be identified with IP and OP imaging. Susceptibility artifacts occur at interfaces of substances with different magnetic susceptibilities. Magnetic susceptibility artifacts are also commonly seen at interfaces between air and tissue, such as in the bowel. These artifacts are more pronounced on IP images secondary to the longer echo time [11]. Spin echo (SE)-based techniques can be used to decrease susceptibility artifacts, but these SE series are very long.
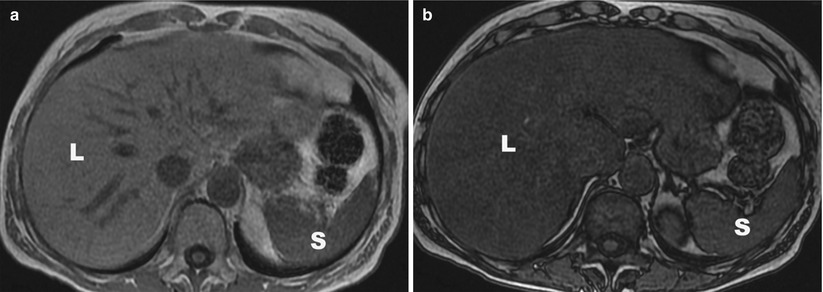
Fig. 1.4
(a) Axial in-phase image shows that the liver (L) signal is higher than the spleen (S) signal. (b) Axial out-of-phase image shows that the liver signal has dropped relative to the spleen secondary to fatty infiltration. L liver, S spleen
In addition to fat, protein and blood are bright on IP T1WI, and IP T1WI may be useful in identifying posttraumatic hematomas and hemorrhagic malignancies [6]. Melanin, copper, and glycogen are also bright on IP T1WI. Lesions that are hypointense to the normal liver on IP T1WI include metastases, cysts, hemangiomas, and areas of fibrosis. Finally, IP T1WI is not fat saturated and provides excellent definition of the various fat planes in the evaluation of hepatic anatomy.
T2-Weighted Imaging
There are a variety of techniques that can be used to obtain T2-weighted imaging (T2WI) of the liver. The most commonly used is fast spin-echo (FSE) technique. A variant of FSE are FRFSE and SSFSE (GEMS) sequences. Another T2WI imaging technique is diffusion-weighted imaging. In this section we review the imaging parameters for these various series.
FSE
Fast spin-echo (FSE) sequences significantly shorten T2WI scan times by using a train of echoes to fill multiple lines of K-space per TR (echo train length) (ETL) [12, 13]. The ETL varies but it is commonly between 16 and 21. The length of the ETL will affect the signal-to-noise ratio (SNR) and contrast-to-noise ratio (CNR). FSE image contrast is also reduced secondary to j-coupling interactions which cause fat to have a bright signal on FSE images rather than the dark-to-intermediate signal fat has on traditional SE images [14]. A reduction of SNR and CNR can make the detection of liver lesions more difficult [15]. T2WI is commonly obtained with an echo time (TE) of 60–80 ms. A longer TE will result in increased contrast with overall signal loss. The TR of FSE is over 4s. Fat suppression can be used to improve image contrast and hepatic lesion detection. The FSE technique decreases artifacts. T2WI can be obtained with respiratory-triggered techniques or variants of navigator (GEMS)/propeller techniques. These latter techniques reduce the motion artifact due to breathing or pulsation.
On T2WI, the normal liver signal is usually hypointense to the spleen, kidneys, and pancreas. Most hepatic pathology, such as metastatic disease and hepatocellular carcinoma, are hyperintense to the normal hepatic parenchyma. Water-like consistencies have a high T2 signal, so T2-weighted sequences are also useful for detecting cysts and hemangiomas and for evaluating the biliary system. A fatty liver will result in some signal loss if the T2WI is obtained with fat saturation. A dramatic loss of the liver signal is seen in the setting of iron deposition. This is best evaluated when compared to the muscle, as the pancreas and spleen may also have iron overload in the setting of primary hemochromatosis [6, 10].
SSFSE
Single-shot fast spin-echo (SSFSE) sequences (GEMS) are an extreme version of the multi-echo spin technique, where a single excitation pulse precedes all the echoes obtained in a single acquisition. The ETL is very long (>60). As k-space is symmetric, SSFSE acquires enough echoes to fill a little more than half of the k-space (0.6NEX). In the setting of a matrix of 128 phase-encoding steps, this corresponds to an ETL of 77 echoes. The needed data to fill the center of k-space can be obtained within a fraction of a second. Compared to FSE, SSFSE images have less motion-related artifact secondary to the faster acquisition time, but SSFSE images have more blurring from the long ETL [16]. SSFSE sequences also have inherently poorer SNR and T2 contrast secondary to the long radiofrequency pulse train and cannot be used to evaluate for solid tumors [17]. SSFSE sequences are commonly used to obtain a quick T2 survey of the abdomen that can also be used as the localizer for the remainder of the exam.
FRFSE
To achieve breath-hold T2WI, fast relaxation fast spin-echo (FRFSE, GEMS) sequences are another option. FRFSE adds a negative 90° pulse to the end of the echo train used in FSE sequences. This additional pulse aligns protons in tissues with long T2 values into the longitudinal plane from the transverse plane, allowing much faster recovery of these tissues while improving the contrast between tissues with long and short T2. The TE values for FRFSE are similar to FSE techniques (60–80 ms). The TR for FRFSE is 2S per ETL. This relative short TR allows breath-hold technique (slices – 50 slices at 5 mm) [14]. FRFSE images can be used to detect solid lesions (Fig. 1.5).
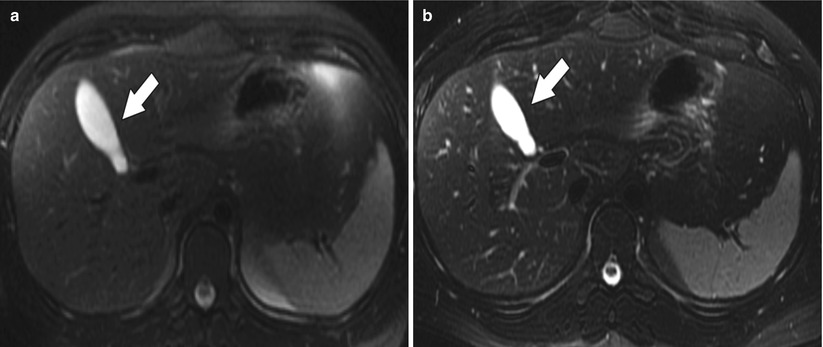
Fig. 1.5
(a) Axial T2 fat-suppressed FSE image shows the high signal in the fluid-filled gallbladder (arrow). (b) Axial T2 fat-suppressed FRFSE image from the same study again shows the high signal gallbladder (arrow), but notice the improved visualization of the biliary radicles secondary to the improved T2 contrast
Diffusion-Weighted Imaging
Diffusion-weighted imaging (DWI) is also a variant of T2WI. The images are obtained with echo planar imaging (EPI), using breath-hold, free-breathing, or respiratory-triggered techniques. Respiratory-triggered EPI is recommended over breath-hold EPI because its multiple acquisition technique produces images with a better SNR and allows for the use of more b values [18]. It is best to obtain diffusion gradients in three orthogonal planes to produce a stronger gradient with shorter TEs and less susceptibility, but adequate images can be obtained with only one axis (z-axis) gradient [19].
DWI uses two or more identical diffusion-sensitizing gradient pulses separated by a 180° refocusing pulse to change the phase of normal, unrestricted water protons so that they lose signal while abnormal, restricted water protons retain their phase and signal. The amount of signal loss is inversely related to the degree of water proton motion or apparent diffusion coefficient (ADC) and the b value. The b value is the sum of the diffusion-weighted gradient amplitude, applied gradient duration, and the time interval between the applied gradients or gradient separation.
Changing the b value can alter diffusion sensitivity and typical b value range from 400 to 800 s/mm2. The larger the b value, the more the image signal is based on diffusion properties, while smaller b values will have more signal contribution from T2 effects. The b values used for hepatic lesion detection should be less than 100 s/mm2. This low b value creates images with high tissue contrast that aides in lesion detection. Higher b values, 500 s/mm2 or greater, provide more information about a lesion’s diffusion properties and are used for lesion characterization.
DWI technique has been reported to be used to:
1.


Improve detection of small tumors secondary to greater lesion conspicuity
Related posts:
Stay updated, free articles. Join our Telegram channel
Full access? Get Clinical Tree
