INTRODUCTION
Every day, millions of people undergo imaging evaluations to assess a wide range of medical conditions. When the power of imaging technology is appropriately expanded, these studies yield a wealth of useful medical information. However, like all medical procedures, most imaging studies are associated with risks to patients and costs to patients and society as a whole. These drawbacks are made more significant when the studies fail to yield useful information, such as when an inappropriate study is ordered or when an imaging study is not indicated. Knowledge of the different imaging modalities and their relative costs and benefits is vital to proper management of patients.
The foundations of diagnostic imaging were laid over the course of a few years, starting with the discovery of x-rays by Wilhelm Conrad Röntgen in 1895, radioactivity by Henri Becquerel in 1896, and radium by Marie and Pierre Curie in 1898 [3]. Radiology, or the study of radiation, is an anachronistic term still in use that recalls the years before sound waves and nuclear magnetic resonance were harnessed as ultrasound (US) and magnetic resonance imaging (MRI) for medical use. Today, diagnostic imaging encompasses the use of various imaging technologies for the diagnosis of illness in humans and animals.
Medical physicists, imaging technologists, and radiologists collaborate to use this technology to answer questions raised by referring clinicians, with the ultimate goal of providing accurate and specific diagnoses to the patient. Medical physicists ensure the optimal and safe use of technology in patients. Imaging technologists are expertly trained in the use of specific imaging equipment used for acquisition of medical images.
Radiologists are physicians with specialized training in the interpretation of medical images. The radiologist must combine knowledge of imaging physics and anatomy with a broad fund of medical knowledge to arrive at a diagnosis relevant to the patient’s clinical presentation. In this capacity, the radiologist serves as a consultant to referring physicians. Therefore, effective communication between the referring clinician and the radiologist is vital in all stages of imaging. This communication ideally starts even before a diagnostic study is ordered, when the optimal imaging study can be chosen for the patient based on the clinical question after consideration of the strengths and weaknesses of the different imaging modalities available.
Like other aspects of clinical medicine, image interpretation combines subjective and objective information to reach a diagnosis. In some cases, this results in a single diagnosis.
In most cases, however, there is a list of diagnoses that must be arranged in the order of likelihood, and require additional imaging, clinical, or pathological evaluation.
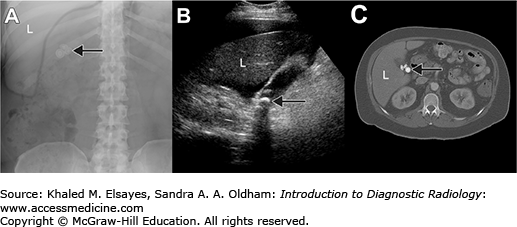
A firm grasp of the capabilities of the image storage and display system (PACS [picture archiving and communication system]) and ideally computer systems in general is a prerequisite for modern image interpretation. The ability to easily manipulate image settings and apply special software algorithms is essential. Knowledge of computer programming is not a requirement, but it can make interpretation more efficient by allowing the radiologist to create personalized solutions for the many deficiencies inherent in modern PACS software. At its most basic level, image interpretation requires identification of abnormalities on images. The radiologist must have a thorough understanding of the relevant anatomy and how it manifests on various imaging modalities in various states of disease and health (see Fig. 1.1). The radiologist also must have an organized system for image interpretation, in the form of a mental checklist of all anatomical structures that must be assessed for a given study. This is so the radiologist does not fall prey to a “satisfaction of search” error: stopping the checklist once a diagnosis is reached. This error results in missed ancillary findings, some of which may be relevant to the primary diagnosis (eg, missing metastases once the primary tumor is detected), or represent important unrelated diagnoses (eg, missing cancer once a fracture is detected in a trauma patient). The easiest thing one can do to become a better radiologist is to look at all the images. This may be an obvious statement, but time pressures often lead to shortcuts that can be disastrous.
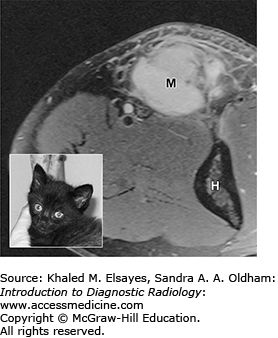
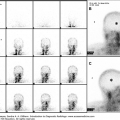
Information derived from diagnostic imaging is then combined with patient information (eg, age, history and chief complaint, physical examination findings, and laboratory values) and a broad fund of medical knowledge to solve the clinical puzzle and reach a conclusion relevant to the patient and her physician. The art of image interpretation, then, is a subjective assessment of all available data and relies heavily on communication between referring physicians and radiologists. In this way, an imaging study differs from most laboratory studies, which yield objective results in a vacuum of clinical information. Appropriate clinical history not only improves clinical decision making by the radiologist, but also affects perception in interpreting the images in the first place by focusing the attention of the radiologist on relevant anatomy and physiology [4, 5]. As seen in Fig. 1.2, a diagnosis of soft-tissue sarcoma became much less likely when a history of recent cat scratch was provided.
Fig. 1.2
45-year-old man with a lump at the elbow. MR image shows an enhancing soft-tissue mass (M) proximal to the elbow joint (H=humerus). Based on the provided history of “soft tissue mass, medial aspect of the elbow,” the radiologist diagnosed the lesion as a soft-tissue sarcoma. The patient was referred to a national cancer referral center, where further questioning of the patient prompted the recollection of a scratch or bite on his arm by his cat (inset) a month prior to the MRI. Given the history, the soft-tissue lump was identified as an inflamed lymph node), and the patient was successfully treated with antibiotics.
Unfortunately, this clinical information is often lacking. Electronic medical record systems have gone a long way to address the issue; however, multiple hurdles often prevent efficient access to patient data. These obstacles include lack of integration with PACS, poor user interface, slow network access, and lack of uniformity across different hospital systems and clinics.
The cycle of communication is completed either by direct discussion between the radiologist and the clinician, as is appropriate for urgent or unexpected findings, or through the written radiology report for more routine matters. Thus, another important role of the radiologist is as a medical communication expert who generates concise and accurate reports, avoiding ambiguity and outdated or confusing terminology. To that end, professional societies in radiology have proposed lexicons for the standardized reporting of imaging findings. The most successful of these has been the Breast Imaging Reporting and Data System (BI-RADS) of the American College of Radiology (ACR), which will be described in more detail in chapter chapter 10.
An artifact is an imaging finding that does not directly correspond to the reality of the patient and may mimic a clinical feature, degrade image quality, or obscure anatomy. They can be related to the patient, hardware, or software (and their use by the operator). Some artifacts can be seen across different modalities (eg, patient motion in radiography, computed tomography [CT], MRI, and nuclear medicine), while others are specific to the technology being used (eg, susceptibility artifact in MRI). Knowledge of artifacts specific to each modality is vital in accurate interpretation of the provided images.
Image contrast is the difference in brightness between an area of interest and its surroundings. The larger the difference in brightness between different tissue types, the easier it is to differentiate them from each other. Figure 1.3 shows examples of images with different levels of contrast.
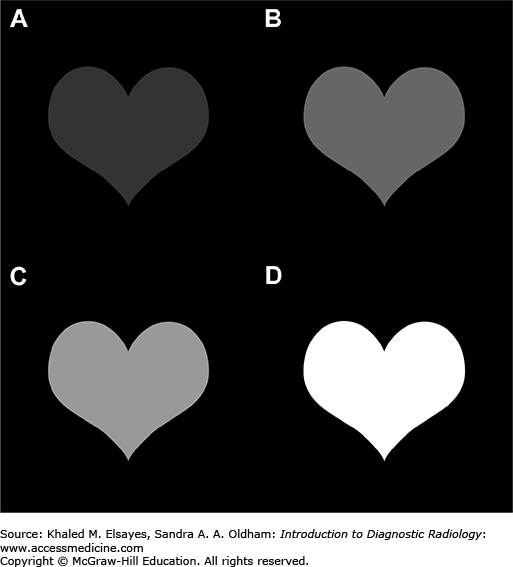
In diagnostic imaging, image contrast depends not only on tissue characteristics, but also on modality-specific factors that will be discussed in subsequent sections later in this chapter.
Imaging studies can be broadly divided into planar and cross-sectional. In their simplest form, planar images are shadows of complex three-dimensional objects. These images compress a large amount of information into a two-dimensional image; however, as would be expected, important anatomical relationships can be obscured in this fashion (Fig. 1.4A,B). The best-known planar imaging technique is radiography (eg, chest x-rays and mammography), which seems to be a required prop in all movie depictions of hospitals and doctor’s offices.
Fig. 1.4
Cross-sectional Imaging. (A) Diagram of the chest with “slices” through the heart. (B) Planar radiograph of the chest showing the margins of the right atrium (RA, white arrows), left ventricle (LV, black arrows), and descending thoracic aorta (small black arrowheads). (C) Axial CT image of the chest with pixel values adjusted for visualization of the soft tissues, showing the RA, left atrium (LA), LV, and aorta (*). The blue and yellow lines show the levels of the coronal (D) and sagittal (E) reformations, respectively. (D) Coronal reformation showing the RA, LV, and aorta (*), in addition to the pulmonary trunk (PT), liver, spleen (S), stomach (St), and inferior vena cava (IVC). The red and yellow lines show the levels of the axial (C) and sagittal (E) reformations, respectively. (E) Sagittal reformation of the chest showing the RA, LV, LA, PT, aorta (*), liver, and stomach. The red and blue lines show the levels of the axial and coronal reformations, respectively.
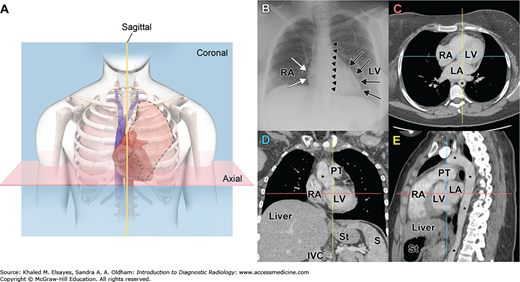
Cross-sectional imaging techniques address the three-dimensional reality of human anatomy by creating a detailed composite analysis of two-dimensional “slices” (Fig. 1.4C-E), and include CT, ultrasound, and MRI. Depending on the modality, images can be acquired in two or three dimensions. The unit elements of an image are referred to as pixels (picture elements) for two-dimensional images, and voxels (volume elements) for three-dimensional images. The images can be mathematically manipulated to obtain two-dimensional images in different planes (Fig. 1.4E) or three-dimensional images highlighting specific regions or anatomy. The mathematical algorithms and detailed physics remain beyond the scope of this text. It is important to note that these technologies have revolutionized the field of radiology in terms of highly specific diagnostic capability as well as high volume data acquisition, manipulation, and storage.
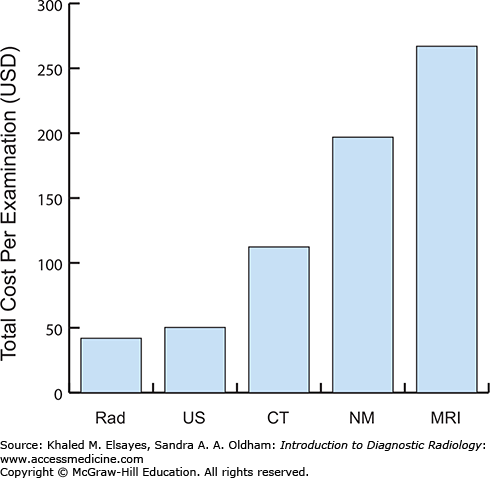
Progressive reliance on diagnostic radiology as an integral part of a patient’s clinical evaluation has resulted in marked growth in the number of studies performed. Continued research and technologic advancements provide the clinician with a range of imaging modalities and examinations to choose from. In addition to judicious selection based on the clinical scenario, one must not forget the practical impact of these choices with regard to the financial responsibilities of the patient, payers, and society as a whole. Due to the enormous variability in reimbursement rates across and within nations, it is impossible to provide an absolute cost for each modality and type of examination that exists. However, it is imperative that one acquires a general idea of the relative cost of one modality compared to another (Fig. 1.5) [1].
Fig. 1.5
Relative costs for various diagnostic imaging examinations. Although these are only relative values, they serve to provide a tangible reference point when considering advanced imaging for a patient. Rad, radiography; US, ultrasound; CT, computed tomography; NM, nuclear medicine, excluding PET and PET/CT; MRI, magnetic resonance imaging. Data from [1].
The sections that follow will cover some of the more commonly used imaging modalities used in diagnostic imaging and discuss how images are acquired and interpreted, the strengths and weaknesses of each modality, and issues of safety and cost. The literature cited will be to helpful review articles rather than to primary sources, and the interested reader is advised to consult these papers for a more thorough coverage of the subjects included in this chapter.
RADIOGRAPHY
Radiography is the oldest of the imaging modalities used in diagnostic radiology. Strictly speaking, radiography is the use of x-rays to generate images. This definition would include projectional radiography (eg, chest x-rays) and CT; however, in common usage, the words x-ray, plain film, radiograph, and conventional radiograph are used interchangeably to refer to projectional radiography. Fluoroscopy is an application of projectional radiography that allows real-time observation of the internal structures of a patient and is used predominantly in gastrointestinal imaging, interventional radiology, and musculoskeletal radiology.
This section will provide a brief overview of radiography and fluoroscopy, and an introduction to radiation dose measurements and radiation safety.
Radiographs are produced by passing an x-ray beam generated by an x-ray tube (see the “Equipment” section) through a patient and using one of many methods of capturing the attenuated beam. The image produced represents a “shadow” of the structures the x-ray beam passed through.
Image contrast in radiography is produced by the ability of different materials to attenuate (weaken) the x-ray beam. For example, x-rays passing through a patient’s chest will encounter little resistance passing through the air in the lungs, and the resulting transmitted x-ray beam will not be significantly attenuated. Bones, on the other hand, result in substantial attenuation of the x-ray beam, while soft tissues (such as the heart and mediastinum) result in intermediate attenuation of the x-ray beam. Attenuation of the x-ray beam for a given tissue is quantified in a single parameter, the mass attenuation coefficient, which is expressed as cm2/g. Several physical characteristics of a tissue contribute to a tissue’s mass attenuation coefficient. A detailed description of these physical characteristics is beyond the scope of this book; however, a familiarity with mass attenuation coefficient is important for understanding the basis of image contrast in radiography and CT (see the “Computed Tomography” section), and understanding how liquids like iodinated contrast agents can have higher attenuation than solids like cortical bone. The interested reader is referred to the excellent review by Bushberg [6] for more comprehensive coverage of this topic.
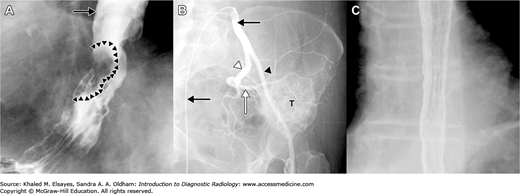
A variety of substances are available to enhance the contrast between different anatomical structures. Contrast media can be classified as positive or negative. Positive contrast agents result in increased attenuation of x-rays and show up as white on the conventional method of visualizing x-rays (Fig. 1.6A,B). Negative contrast agents, on the other hand, result in decreased attenuation of x-rays and show up as black or gray (Fig. 1.6C). Barium and iodinated agents are positive contrast agents used in radiography, while negative agents include air and carbon dioxide.
Fig. 1.6
Positive and negative contrast agents. (A) Double (CO2 and barium) contrast esophagography showing positive contrast outlining the proximal esophagus (black arrow), as well as a tumor (arrowheads). (B) Intravascular use of contrast material in a left common iliac artery angiogram. The tip of the catheter (black arrows) is located in the proximal right common iliac artery. Injected contrast opacifies the internal (white arrowhead) and external (black arrowhead) iliac arteries, showing that the blood supply to the tumor (T) is predominantly from branches of the superior gluteal artery (white arrow). (C) Double contrast esophagogram in another patient after passage of barium into the stomach shows mucosal detail outlined by barium in an esophagus that is a distended by CO2 gas.
Barium Sulfate: This inexpensive contrast agent is utilized in both fluoroscopic and CT examinations to opacify (make whiter) the gastrointestinal tract. It can be given orally as well as rectally and is excreted unchanged in the feces. It is generally well tolerated and can be formulated to various viscosities as needed for the level of mucosal coating desired. Mucosal coating is important in fluoroscopic examinations for assessment details of the endoluminal surface of the gastrointestinal tract. Adverse reactions are infrequent and often mild. Constipation, nausea, and diarrhea are several known side effects and are typically self-limiting. Allergic reactions have been reported but are exceedingly rare. The foremost risk of barium sulfate is peritonitis if spilled into the abdominal cavity in a patient with bowel perforation. The barium forms fibrinous deposits and a chemical irritation that leads to marked third-spacing of fluid and subsequent hypovolemia. Nearly half of all affected patients progress to sepsis and eventual death. If bowel perforation is suspected, water-soluble iodinated agents are used.
Iodinated Agents: These agents can be used for gastrointestinal or intravascular administration. In the gastrointestinal tract, they are considered inferior to barium for the purposes of fluoroscopic gastrointestinal studies because of opacification by passive filling rather than mucosal coating and are mainly used in the setting of suspected bowel perforation. Water-soluble iodinated agents are quickly absorbed by the peritoneal surface if spilled into the peritoneal cavity and will not cause peritonitis. Intravascular use of these contrast agents will be discussed in more detail in the CT section.
Gases: Carbon dioxide gas in the form of effervescent powder or tablet is activated in the presence of water and is an effective means of distending the stomach for fluoroscopic evaluation. Air injected via nasogastric or rectal tube is also efficient for gastric or colonic distension, respectively.
A complete description of the technology and physics of the modern x-ray tube and housing is beyond the scope of this book; however, a brief description is provided to help conceptualize the device. The x-ray tube is an evacuated chamber containing a cathode and an anode, across which an electric potential is applied (Fig. 1.7). The cathode contains a high-melting point metal filament, such as tungsten, that is heated, liberating electrons in a process called thermionic emission. The amount of heating, and thus the number of electrons “boiling off” the filament, is controlled by the milliampere (mA) setting on the x-ray control panel. The electric potential applied between the cathode and anode draws the electrons toward the anode, where they strike the anode disk, generating x-rays as well as a large amount of heat (approximately 99% of the energy of the electrons is lost as heat). The energy of the generated x-rays depends on the speed of the electrons as they travel from the cathode to the anode. The speed of the electrons, in turn, depends on the strength of the electric potential between the cathode and the anode. This is controlled by the kilovoltage peak (kVp) setting on the x-ray control panel.
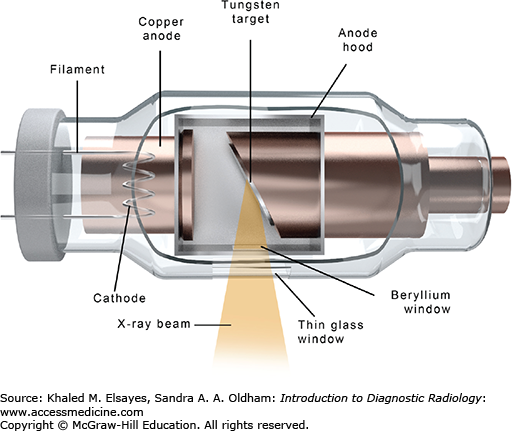
Higher kVp settings are used when high-energy x-ray beams are needed, such as when imaging thicker and/or denser anatomic parts.
The x-ray beam traverses the patient and is attenuated based on the characteristics of the tissues in its path. Several technologies are available for making the radiographic image. The three main technological solutions currently in use are conventional (film-based) radiography, computed radiography (CR), and direct radiography (DR).
Modern conventional radiography involves the use of a screen-film combination to capture the image information. X-ray photons strike one or two intensifying screens, which convert x-ray energy into visible light. This clean-film system is housed in a light-proof cassette, where the visible light generated by the intensifying screen(s) exposes the radiographic film to generate the image. The cassette is then taken to a film processor, which develops the film for visual interpretation. The main advantages of these systems are high spatial resolution of film, high sensitivity, easy handling, and low cost. The main disadvantage is the coupling of image acquisition and storage in the form of the film, high storage costs, and narrow dynamic range (the range of x-ray intensities a detector can differentiate between).
Computed radiography and direct radiography are digital radiography techniques that at some stage use a digital data format in acquiring, processing, displaying, or managing an x-ray image [7]. The main advantage of digital radiography techniques is the ability to separate image acquisition, processing, and display, which allows for optimization of each of these stages, as well as the ability to digitally manipulate acquired images [7]. Computed radiography involves acquiring the image on a filmless cassette containing an image sensor that temporarily stores information about the x-ray beam. The image sensor consists of a thin plate coated with tiny crystals of photostimulable phosphor (also called the image plate), which store the energies of the absorbed x-rays. After acquisition of the image, the cassette is inserted into a CR scanner, which automatically opens the cassette and scans the image plate with a laser (the readout process). The information is displayed on a small monitor, where the technologist can check the image quality for positioning and technical errors, as well as image artifacts. The digital image can then be sent to the PACS for storage and interpretation by the radiologist [8].
In contrast to both CR and conventional radiography, DR does not require a physical cassette for image acquisition. Direct radiography is a cassetteless system where the x-ray energy is converted to electrical energy, either directly using a photoconductor that converts x-ray photons into electrical charge or indirectly by a scintillator that emits light when exposed to x-rays, after which the light is converted into an electrical charge [9]. This image can then be sent to the PACS in the same manner as in CR.
Fluoroscopy involves a mobile x-ray tube that generates a continuous, adjustable x-ray beam, allowing for real-time visualization of anatomic structures. The x-ray beams strike a fluorescing screen coupled to an image intensifier that can transmit the images to a monitor [10]. Single images or a series of images can be stored for future review. Coupled with intravenous or enteric contrast administration, this modality provides a wide array of diagnostic and therapeutic options in multiple radiologic subspecialties. For example, intravenous contrast can be used to visualize vessels (Fig. 1.6B) and enteric contrast is commonly used in gastrointestinal evaluation, such as barium swallow studies (Fig. 1.6A,C).
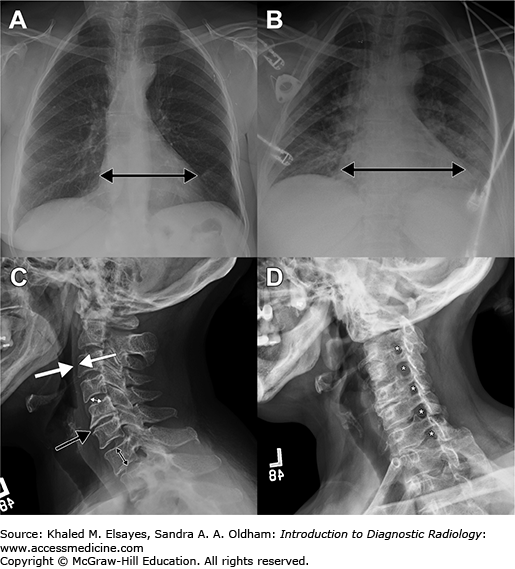
Image interpretation in radiography depends on a thorough understanding of the three-dimensional anatomy of the region under evaluation and how it is compressed into two dimensions under different projection techniques. For example, the cardiac silhouette (“heart shadow”) can change size depending on the position of the patient in relationship to the x-ray source and the cassette (or image detector in direct radiography). In the standard posteroanterior (PA) projection, the x-ray source is behind the patient and the cassette is in front, closer to the heart. Therefore, the size of the shadow cast by the heart is fairly close to the actual size (Fig. 1.8A). In contrast, the anteroposterior (AP) projection used in portable studies places the cassette behind the patient, with the x-ray source in front. This projection results in a larger shadow being cast by the heart, a phenomenon that is referred to as magnification (Fig. 1.8B). In addition, the radiologist must know the strengths and weaknesses of different projections. For example, cervical spine radiographs typically consist of anteroposterior, lateral, and odontoid views. The lateral view allows for an assessment of the alignment of the spine, prespinal soft tissues, and vertebral body and disc space heights (Fig. 1.8C). When pathology involving the neural foramina is sought (eg, for initial assessment of radiculopathy), oblique views are obtained, allowing assessment of the bony configuration of the neural foramina (Fig. 1.8D).
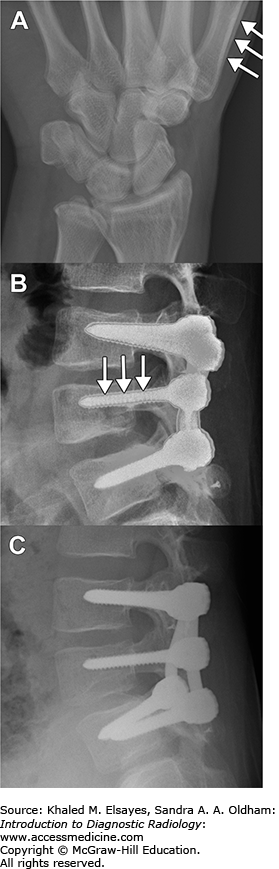
Fig. 1.8
Importance of projection in image interpretation.
(A) Posteroanterior (PA) chest radiograph obtained by placing the x-ray source behind the patient. The heart shadow is indicated by the double-headed arrow and is normal. (B) Anteroposterior projection (AP) results in apparent enlargement of the heart, a phenomenon known as magnification. (C) Lateral radiograph of the cervical spine is used to assess the alignment of the spine, thickness of the prevertebral soft tissues (between white arrows), and heights of the vertebral bodies (double black arrow) and discs (double white arrow), to name a few. In this patient, disc space narrowing is present at C5-C6 (black arrow). (D) The oblique view of the cervical spine highlights the bony contours of the neural foramina (*).
Another important concept is the attenuation characteristics of different tissues, introduced in theoretical form earlier in the section Image Contrast. In practice, differences in attenuation mean that bone, metal, and contrast agents appear white on images, soft tissues and fat appear as varying shades of gray, and gas appears black. Normal anatomy and pathology can then be identified based on their composition and anatomic location.
Artifacts can be seen in conventional, computed, and direct radiography. Some artifacts, such as patient motion (Fig. 1.9) and dust particles, can affect all techniques of radiography, while others are specific to one or more of the three methods. Ultimately, it is important for the radiologist to have an understanding of common artifacts in order to prevent errors in interpretation. The interested reader may refer to papers by Shetty, et al [11] and Walz-Flannigan, et al [12] for a review of artifacts in computed and digital radiography, respectively.
Fig. 1.9
Artifacts in radiography. (A) Patient motion can affect all techniques of radiography and results in a blurry image and doubling of cortical lines, best seen in the radial cortex of the thumb metacarpal (arrows). (B) The Uberschwinger (overswing or rebound) artifact results in a lucent halo around metal or at interfaces where there are sudden large difference in image density (ie, at areas of high spatial frequency). This postprocessing (software) artifact seen in computed and direct radiography is most pronounced with high degrees of edge enhancement. (C) Radiograph in the same patient without edge enhancement removes the artifact.
We are exposed to radiation from a multitude of different natural sources at all times. Ionizing radiation can damage living cells by causing undesired chemical reactions and altering the structure of macromolecules in cells. In imaging modalities that produce ionizing radiation (radiography, CT, and nuclear medicine), this potential harm can affect physicians, technologists, patients, and sometimes their families (in the case of nuclear medicine). Children, young adults, and women of reproductive age are particularly vulnerable. Therefore, it is important to critically weigh the risks and benefits of any study before recommending it for a patient.
The concept of ALARA (as low as reasonably achievable) in relationship to radiation dose is an extension of the oath to do no harm. In practice, this means using the lowest radiation exposure that is reasonably achievable to perform a study, weighing the risk of the adverse effects of radiation (see Biological Effects of Radiation) against the benefit of a diagnosis that can influence treatment. Dose minimization is the responsibility of every health care professional involved in the care of the patient, including the clinician who orders the study, the radiologist who determines how the study should be performed, the medical physicist who optimizes the imaging parameters, and the technologist who performs the study. The ALARA principle begins at the moment an imaging study is considered, by selecting the appropriate imaging study. An examination should only be requested if it directly influences patient. Unfortunately, imaging is sometimes inappropriately performed to satisfy academic curiosity, as a medicolegal strategy, or at the behest of patients.
The biological effects of radiation can be conceptualized as either deterministic or stochastic. Deterministic effects are thought to occur only once a certain threshold of exposure has been exceeded and are generally seen with higher doses of radiation. Biologically, these effects are caused by significant cell damage or death that overwhelms the physiological ability of the affected organ to repair itself. Adverse events resulting in deterministic effects are rare in diagnostic imaging, but tend to make headlines in the popular press when they do occur [13]. Examples include skin damage (erythema, necrosis, and epilation), cataracts, sterility, radiation sickness, teratogenesis, and fetal death. Teratogenic effects can occur with large doses of radiation and include growth restriction, microcephaly, and mental retardation. The risk of central nervous system injury with radiation is greatest when the exposure occurs between 8 and 15 weeks of gestation, with no proven risk above or below this range [14]. The National Council on Radiation Protection has recommended that cumulative dose to the fetus remain less than 50 mSv during the course of gestation.
Unlike deterministic effects, which do not occur below a certain threshold of radiation exposure, stochastic effects are thought to follow a linear, no-threshold model. It is thought that stochastic effects occur as a result of ionizing radiation causing symmetrical translocations that occur during cell division, with the most important consequence being cancer. This risk is most pronounced in children in general, and specifically in rapidly dividing tissues, such as reproductive organs and breasts in young women.
The linear, no-threshold model is based on fitting the data from Japanese survivors of the atomic bomb attacks with a linear model [2]. This is seen as the thick line in Fig. 1.10. At levels below 100 mSv, which is the range of doses of most medical imaging studies, any increase in radiation-induced cancers is thought to be too small to be distinguishable from the background cancer incidence due to other causes [15]. However, application of the linear model to these low doses may result in the overestimation of the risk of low-dose radiation, and other models have been proposed. The linear, no-threshold model is prudent for establishing radiation protection standards for members of the public and people whose occupations expose them to radiation [16]. However, overestimation of risks for medically indicated imaging procedures can stimulate sensationalistic reports in the popular press and result in fear and anxiety of imaging examinations and cancellation or deferral of vital imaging studies [15].
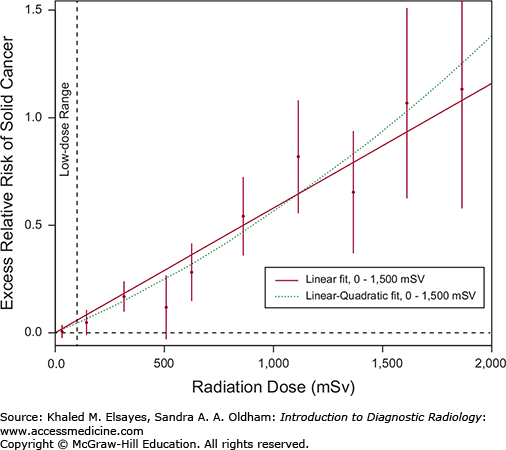
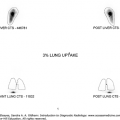
Fig. 1.10
Relationship between radiation-induced solid cancer risk and administered dose. The solid line shows the fit of the linear model to the data, while the dotted line shows the fit of a linear-quadratic model. For solid cancer incidence, the linear-quadratic model did not offer a statistically significant improvement in fit. Data in the low-dose range is more limited, and the difference between the two models illustrated is small in this region. Some have advocated the application of other models to fit the data in this region. Graph modified from [2].
Radiation exposure can be conceptualized as absorbed dose and effective dose. Absorbed dose (expressed in Grays, Gy) is a measurement of the total radiation energy absorbed per volume of tissue exposed and provides little information on the biologic effects of radiation. Effective dose, on the other hand, applies a weighting factor to absorbed dose for each exposed tissue based on its tendency to develop stochastic effects, and gives a measure of the risk for stochastic effects in the whole patient. For example, the weighting factor for the breast is 0.12, while that for the brain is 0.01. Therefore, the same amount of absorbed dose will result in different effective doses for these organs [17]. The effective dose is measured in Sieverts (Sv). A helpful way to conceptualize radiation doses for beginners is the background equivalent radiation time (BERT), which compares a given radiation dose to the exposure of the entire population from sources of natural ionizing radiation. This exposure comes from a variety of sources, such as cosmic radiation and natural uranium and thorium (and their indirect decay product, radon gas). This natural “background” effective dose is approximately 3 mSv per year, although the exact number varies by location and altitude [18, 19]. Using the BERT system, the radiation received from a given source is expressed in terms of a certain number of days or years of background radiation [17]. For example, a PA and lateral chest radiograph is equivalent to a background exposure of between 7 and 19 days, while an abdominal series is equivalent to a background exposure of between 3 and 4 months [17].
Radiography is widely available and inexpensive, has high spatial resolution, and exposes patients to lower doses of radiation than studies such as CT. In addition, it offers excellent visualization of bones for the purpose of tumor characterization and fracture identification, sometimes superior or complementary to MRI. The main disadvantage of radiography is the collapse of complex three-dimensional structures into a two-dimensional image, which can lead to uncertainty about the location of lesions in space and decreased sensitivity in detection of lesions hidden behind higher attenuation structures. In addition, the contrast resolution of radiography is inferior to CT and MRI.
COMPUTED TOMOGRAPHY (CT)
The introduction of computed tomography in the early 1970s is heralded as the greatest advance in the field of radiology since the discovery of x-rays. It provided a means by which x-rays could be utilized to create cross-sectional images and thereby allowed physicians to identify a greater range of abnormalities within the human body.
Allan M. Cormack was a South African physicist who discovered that changes in radiation therapy dose distributions within the body were related to differences in the tendency of various tissues to attenuate x-rays. He surmised that these differences could be used to create projection imaging using gray-scale models. His research went relatively unnoticed but its concepts later emerged independently in the work of Sir Godfrey Hounsfield, a British engineer. Hounsfield’s experiments with an x-ray tube resulted in data acquisition and processing times of 9 hours and 2½ hours, respectively; far too long for effective clinical use. The first clinical application of the CT scanner was in October 1971 at Atkinson Morley Hospital in London where a brain scan revealed a frontal lobe brain tumor in a 41-year-old woman. In 1979, Hounsfield and Cormack shared the Nobel Prize for Medicine for their contributions to the realization of projection imaging. Modifications in technique have reduced data acquisition and processing times to minutes [20].
The components of a CT system are housed within the donut-shaped gantry, which contains the radiation source (x-ray tube) and detectors (Fig. 1.11). The examination table carries the patient through the donut hole of the gantry. The images are obtained by rapid rotations of the x-ray tube around the patient. Essentially, a narrow beam of x-rays passes through a section of the patient and sensitive detectors measure the radiation transmitted directly across the beam. Computer processing of the data results in cross-sectional images of the body.
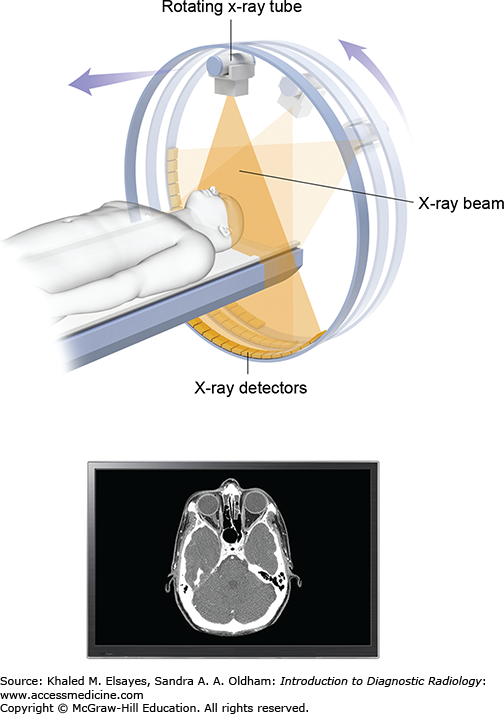
Image contrast in CT relies on the same principles as radiography: the difference in attenuation (weakening) of the x-ray beam as its passes through different substances. In CT, this difference is reproducibly quantifiable. As mentioned previously, each CT slice is composed of a matrix of volume elements or voxels. Each voxel has a value that represents the attenuation of x-ray photons that traverse that portion of tissue during the scan. The voxels are converted for display into a corresponding matrix of picture elements or pixels. Each pixel is assigned a numerical value (CT number) representing the average of the attenuation values in the voxel from which it was derived. Their values are given interpretive meaning on the Hounsfield unit (HU) scale which is named in honor of the inventor of CT. The numbers are, by convention, compared to the average attenuation value of water. Water is assigned a value of 0 HU. The scale ranges from approximately –1000 HU (black) for air to greater than +1000 HU (white) for metal. Important HU values for interpretation of images are shown in Table 1.1 and illustrated in Fig. 1.12A [21].
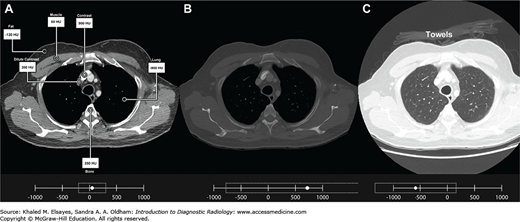
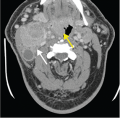
Fig. 1.12
(A) CT image with pixel values optimized for assessment of the soft tissues (“soft tissue windows”). Inset at bottom shows the range of pixel values centered at 55, with a width of 500. Attenuation values of various tissues on CT: Lung (-900 HU), subcutaneous fat (-120 HU), pectoralis major muscle (50 HU), iodinated contrast material in the superior vena cava diluted by circulation (200 HU), bone marrow (250 HU), and undiluted contrast in the brachiocephalic vein (900 HU). (B) CT image with pixel values optimized for assessment of bones (“bone windows”), centered at 750, with a width of 3000. Please note that the attenuation values for the various structures are the same as in A. Only the pixel values chosen for display are changed. (C) CT image with pixel values optimized for assessment of lungs (“lung windows”) centered at –600, with a width of 1500. Note that using this window, there is better visualization of the lung parenchyma, as well as the towels placed on the patient for comfort.
Box 1.1 – TERMINOLOGY
There is often disregard for the difference between the terms attenuation and density in CT. However, the terms have specific and distinct meanings, and confusion of the two signals a lack of knowledge of or disregard for the physics of CT. Attenuation refers to the ability of a tissue to weaken the x-ray beam that passes through it, and is the correct term to use to refer to how bright a structure is on CT. Density refers to the mass per unit volume of a substance.
While attenuation of x-ray beams is usually related to the density of a substance, this is not always the case. For example, liquid iodinated contrast agents result in significant attenuation of x-ray beams, sometimes more so than solid bone.
As described earlier, image contrast can be enhanced by the addition of agents that (most commonly) result in increased attenuation of the x-ray beam. Iodine and barium are commonly used agents that result in increased attenuation of the x-ray beam. Contrast agents can be administered through any cavity (natural or iatrogenic) and enhance differences between tissues that would normally have similar attenuation. The primary routes of delivery for CT are intravascular (venous) and enteric (oral and rectal). The use of contrast media is nearly ubiquitous in modern imaging, and its optimal use has been carefully studied in order to tailor CT protocols for specific clinical questions.
Intravascularly administered agents are iodinated material that move quickly into the extracellular fluid. No significant metabolism or transformation occurs. Excretion is primarily through the kidneys. In patients with compromised renal function there is greater excretion through the biliary system and gastrointestinal tract. Dynamic contrast-enhanced imaging refers to precise timing of the injection of intravascular agents coupled with image acquisition spaced in time. This technique can help identify and classify abnormalities by taking advantage of the difference in contrast enhancement among different tissues across time (see Image Interpretation on page 14). For example, a lesion can have the same attenuation as its surroundings on noncontrast and delayed images, but will have intense enhancement on arterial phase images (image obtained when most of the contrast enhancement is in the arterial system) (see chapter 5, case 6).
CT angiography also makes use of precise contrast timing to image vascular anatomy. This is helpful because vessels often have the same or similar attenuation as their surroundings and because emboli and thrombi often have the same attenuation as blood. With the injection of intravascular contrast, bland (nontumorous) emboli and thrombi retain their soft-tissue attenuation while the surrounding blood has higher attenuation due to the injected contrast. Coronal and sagittal reformations are commonly obtained to help localize abnormalities and better visualize anatomy.
Water-soluble iodinated contrast agents can be used intravenously in CT for visualization of hypervascular tissues (eg, tumor) and vascular structures (they can also be used for improved image contrast in the gastrointestinal tract, as will be discussed in the next section). The various iodinated contrast agents do not differ significantly from one another in terms of imaging capabilities when similar concentrations, administration rates, and volumes are utilized. They do, however, show important differences in adverse-reaction profiles primarily based on their charge, osmolality, and viscosity when administered intravenously.
First Generation Agents: The initial iodinated contrast agents were high-osmolar ionic compounds. These agents are very hypertonic—5 to 8 times the osmolality of blood. This high osmolality was shown to cause greater reported incidents of pain or discomfort when injected intravenously. Additionally, blood volume expansion caused by osmotic differences was a cause for concern in volume-overloaded patients such as those with heart failure. As a result, these agents have fallen out of favor for intravascular administration. They do retain utility in gastrointestinal or retrograde urological procedures (eg, cystography) because they can provide safe and adequate imaging at low cost.
Second Generation Agents: Low osmolality nonionic compounds demonstrated fewer adverse reactions and were more tolerable in terms of intravascular administration. Common agents include iohexol (Omnipaque), ioversol (Optiray), and iopamidol (Isovue).
Third Generation Agents: The nonionic iso-osmolar dimer iodixanol (Visipaque) has found use in patients at elevated risk for contrast induced nephrotoxicity (more in the following section) due to its unique chemical properties and hydrophilic nature. Due to its higher cost, it is typically reserved for patients at elevated risk of renal insult.
Barium Sulfate: As discussed, barium sulfate mixtures are used to opacify the bowel. For CT imaging, the patient ingests the barium sulfate suspension approximately 1½ to 2 hours prior to imaging to allow for appropriate transit within the bowel. As noted earlier, if bowel perforation is suspected, water-soluble iodinated agents are preferred.
An ultra-low concentration barium sulfate suspension (VoLumen) has been developed for special use in CT. This formulation contains sorbitol, a nonabsorbable sugar alcohol that promotes gastrointestinal distension by limiting resorption of water across the small bowel wall. Unlike conventional positive contrast agents that result in increased attenuation of x-rays, this agent provides negative contrast by filling the bowel with low-attenuation fluid. Consequently, it provides excellent evaluation of the bowel wall and is being used extensively in CT enterography. The use of a negative enteric contrast such as water or VoLumen coupled with intravenous contrast highlights hypervascular lesions as well as bowel wall thickening or abnormal enhancement and enables evaluation of bowel wall thickness and perienteric fat and vasculature [22].
Water-Soluble Iodinated Agents: As mentioned in the radiography section, these agents are used in patients with suspected bowel perforation to avoid complications of peritonitis. Dilute solutions are routinely used for oral and rectal contrast administration. A mild laxative effect may be seen due to the high osmolality.
The first commercially utilized CT scanner became available in 1972. There was a rapid push by multiple companies to produce innovations in its design. Four generations of CT scanners evolved over the short period of four years with continued reduction in scan times. Most modern scanners make use of a combination of technologies to allow rapid acquisition of high-quality images at radiation doses lower than what was possible with earlier generations of scanners.
Hounsfield’s Mark I scanner employed an x-ray tube and detector which were linked in opposing positions. A narrow, pencil-width beam passed through the patient to the detectors, while the tube-detector assembly rotated incrementally around the patient for a total of 180°. The patient was then moved through the gantry by a small increment, and the process repeated. This “step-and-shoot” incremental sequence is referred to as translation-rotation. This geometry resulted in an average scan time of five to six minutes. Because these long scan times required multiple breath holds, patient motion was a major source of image degradation [23].
These units generated multiple narrow fan-shaped beams that passed through the patient to multiple detectors using the original translation-rotation motion for scanning. The arrangement of multiple detectors reduced the number of translations required, resulting in a nearly three-fold reduction in scan time. The mechanical complexity of the rotate-translate mechanism remained a limiting factor [23].
In order to reduce scan times, the translation-rotation mechanism was changed to a purely rotational system with a large fan-beam of x-rays, which covered the entire width of the patient. A large array of detectors was utilized to measure data across the entire width of the beam. The tube and detectors continue to rotate together in what can be termed rotation-rotation motion. The design was very successful and a scan could be performed in less than 10 seconds [23].
A new design emerged employing a large, stationary ring of detectors with only the x-ray tube undergoing rotation around the patient. A disadvantage of the system was its size, owing to the fact that the tube had to rotate within the ring of detectors rather than in the same rotational path.
With the exception of minor improvements, CT technology remained relatively stable until 1987. Delays between each translation-rotation or rotation-rotation sequence (interscan delay) were the limiting factor in the existing systems. This was because after each 360° rotation of the tube-detector assembly, the power cables connected to the tube and detectors had to be respun in the opposite direction before the next rotation. Therefore, each complete rotation was followed by braking and then reversal before the next scan, resulting in long procedure times. This problem was solved by the invention of the “slip ring,” which passes power to the rotating components without a fixed connection. The innovative technology allowed for continuous rotation and data acquisition leading to dramatically reduced procedure times [23].
Slip ring technology allows the patient to be moved through the gantry at a constant speed while being continuously scanned. The complete elimination of interscan delay allows certain studies to be completed with just a single breath hold. It has also reduced artifacts caused by patient breathing/motion and allows for more precisely timed scanning. The continuous volume of image data acquisition made multiplanar reformations and detailed three-dimensional imaging feasible options [23].
This system uses the principles of helical scanning but incorporates multiple rows of detector rings rather than a single row. Commercially available units have evolved from 4- to 256-detector row systems, which has significantly reduced scan time by increasing the area of the patient covered by x-ray beams. Additionally, because of superior gantry rotation speeds, some scanners are at least eight times faster than single-detector CTs. Other benefits include improved resolution, reduced motion, and more detailed image reformations [24].
Related posts:

Stay updated, free articles. Join our Telegram channel

Full access? Get Clinical Tree


