CASE 1
A 65-year-old postmenopausal woman presents for prescription refill.
Osteoporosis
Dual-energy x-ray absorptiometry (DXA)
Bone is made up of a variety of cells (eg, osteoblasts, osteoclasts, and osteocytes), an organic matrix (predominantly type I collagen), and an inorganic matrix (predominantly calcium hydroxyapatite). Osteoporosis is the most common metabolic disease of bone. It is due to disturbances in bone remodeling that result in less bone tissue (matrix and mineral) per unit volume. Bone mineral density (BMD), the average concentration of mineral in a defined section of bone, is used to diagnose osteoporosis, estimate the risk of insufficiency fractures, and select and monitor treatment. BMD is estimated by a DXA scanner, a low-dose x-ray tube with two energies. The low-energy and high-energy photons are attenuated differently in bone and soft tissue, allowing BMD to be estimated.
DXA devices are used to calculate BMD in g/cm2 and to compare the values to a reference database. The comparison is quantified as a T-score, which represents the standard deviation by which the BMD of the patient differs from the mean BMD of a young adult reference population of the same ethnicity and sex, and a Z-score, which represents the standard deviation by which the BMD of the patient differs from the mean BMD of an age-matched reference population of the same ethnicity and sex.
According to the World Health Organization, osteoporosis is “a systemic skeletal disease characterized by low bone density and microarchitectural deterioration of bone tissue with a consequent increase in bone fragility” and corresponds to a T-score of −2.5 or lower. Patients with osteopenia (see Box C1.1), defined as T-scores between −1 and −2.5, have less bone density loss than do those with osteoporosis. A T-score higher than −1 is considered normal.
Box C1.1 – TERMINOLOGY
The WHO definition of osteopenia conflicts with the way the word has been used by radiologists. Radiologists have used osteopenia as a nonspecific and descriptive term for increased lucency of bone as seen on radiographs. This rarefaction could be due to a variety of causes, such as osteoporosis or osteomalacia. Other words, such as demineralization, undermineralization, and deossification, were used incorrectly as synonyms for osteoporosis and osteopenia and added to the confusion.
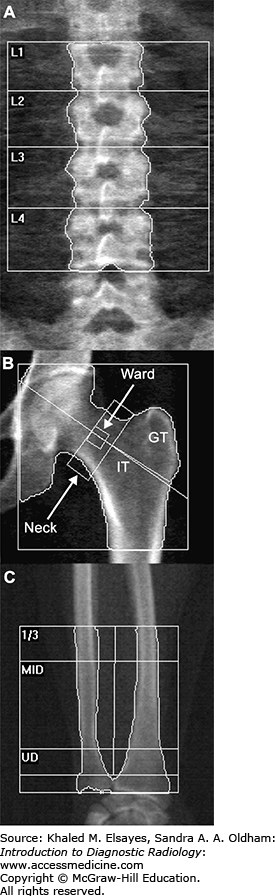
Typically, the lumbar spine and proximal femur are scanned (Fig. C1.1A,B). The forearm (Fig. C1.1C) can be scanned as an alternative to the hip and lumbar spine when these parts cannot be scanned due to artifacts (read further) or when the patient is too heavy for the table. In patients with hyperparathyroidism, the nondominant forearm is scanned in addition to the hip and lumbar spine. This is because BMD loss in hyperparathyroidism is greater in structures with predominantly cortical bone, such as the distal radius.
Fig. C1.1
Normal DXA images. (A) In the lumbar spine, regions of interest are drawn around the individual vertebral bodies and individual and combined BMD values are estimated. (B) In the proximal femur, regions of interest are drawn around the femoral neck, greater trochanter (GT), intertrochanteric region (IT), and Ward’s triangle. Individual and combined BMD values are estimated. (C) In the forearm, the distal one-third of the radius (excluding the ultradistal [UD] portion) is a good site for estimation of cortical bone mineral loss, whereas the ultradistal portion of the radius is a good indicator of trabecular bone loss.
Interpreting DXA scans requires more than just reading BMD estimates from a computer-generated report. As in other areas of radiology, the images should be assessed for quality and the presence of artifacts related to patient movement and appropriate field-of-view. Various artifacts of can result in a falsely elevated BMD estimate (see Box C1.2 and Fig. C1.2).
Box C1.2 – COMMONLY ENCOUNTERED ARTIFACTS
-
Catheters, pacemaker leads
-
Vascular grafts, inferior vena cava filters
-
Surgical hardware, clips
-
Piercings
-
Retained enteric contrast
-
Vertebroplasty cement
-
Atherosclerotic calcifications
-
Osteophytes, endplate sclerosis
-
Compression fracture
-
Bone island
-
Paget disease
-
Neoplasm
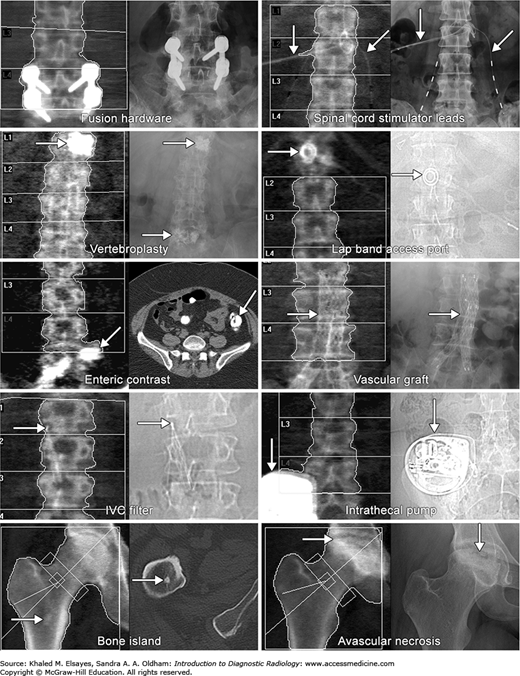
In the spine, the vertebral body heights should be assessed and compared with prior DXA studies (when available) to assess for progressive height loss. Finally, the rest of the image should be evaluated for the presence of incidental findings such as calcified leiomyomata, ureteral stones, and avascular necrosis of the femoral head. Figure C1.2 illustrates some common artifacts and incidental findings in DXA.
None
JA, Jamadar
DA, Hayes
CW. Dual X-ray absorptiometry: recognizing image artifacts and pathology. AJR. 2000;174(6):1699-–1705.
[PubMed: 10845510]
R, Azpeitia-Armán
J, Muñoz-Hernández
A, García-Gómez
JM, Díez-Martínez
P, Grande-Bárez
M. Dual-energy x-ray absorptiometry in the diagnosis of osteoporosis: a practical guide. AJR. 2011;196(4):897-–904.
[PubMed: 21427343]
CASE 2
A 55-year-old woman with chronic knee pain that is worse with activity. The patient reports no morning stiffness. Physical examination reveals crepitus, restricted range of motion, and no joint effusion.
Osteoarthritis (OA, degenerative joint disease)
Radiographs of the knee that include axial and standing flexion views. Although radiography is often the imaging modality of choice for suspected OA, a confident diagnosis of knee OA can often be made clinically without radiographic examination or even with normal radiographs in adults older than 40 years of age who present with usage-related knee pain, only short-lived morning stiffness (< 30 minutes), functional limitation, and one or more typical physical examination findings (see Box C2.1).
Box C2.1 – PHYSICAL EXAMINATION FINDINGS OF OSTEOARTHRITIS AT THE KNEE
-
Crepitus
-
Painful and/or restricted range of motion
-
Bony enlargement
-
Absent or only modest joint effusion
-
Deformity (fixed flexion, varus or valgus)
-
Instability
-
Periarticular or joint-line tenderness
-
Pain on patellofemoral compression
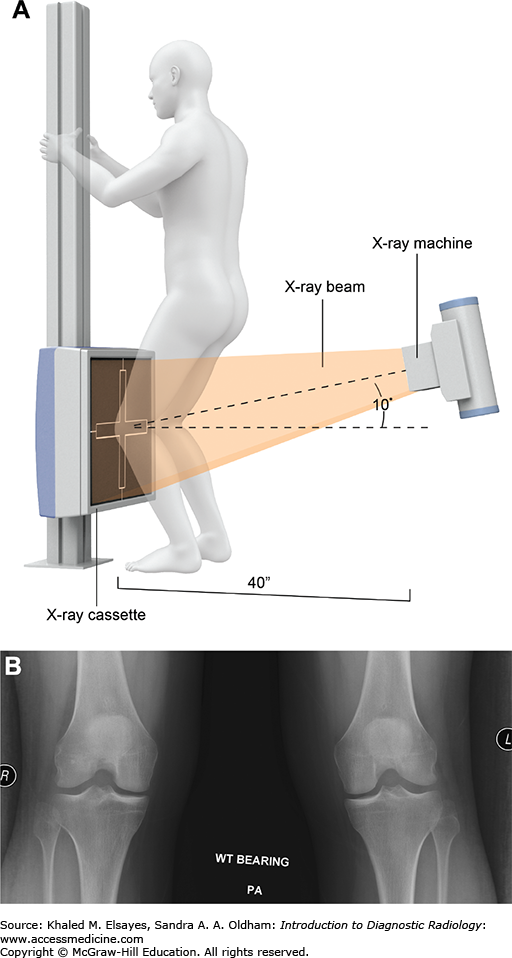
When imaging is indicated, radiographs can provide an estimate of cartilage loss as manifested by joint space narrowing and associated abnormalities of the subchondral bone (read further). The preferred method of imaging the knees, the Rosenberg view, is illustrated in Fig. C2.1. Standard supine (non-weight-bearing) anteroposterior (AP) views can underestimate joint space narrowing, a shortcoming that can be addressed by having the patient stand during radiography. The routine standing view, however, may also underestimate joint space narrowing, although for different reasons. For example, because the maximum stresses in the knee occur between 30 and 60 degrees of flexion, standard weight-bearing radiographs taken with an extended knee are not ideal for evaluation of cartilage loss in these areas. The Rosenberg view addresses this and other issues related to radiographic estimation of cartilage loss.
Fig. C2.1
(A) The Rosenberg view: The Rosenberg view is a 45-degree flexion, posteroanterior (PA), weight-bearing view of both knees with the patellae touching the x-ray cassette or image receptor. The x-ray tube is 40 inches from the image receptor, centered at the patellae, and pointing caudad (down) 10 degrees. The Rosenberg view is more sensitive and specific for joint space narrowing than are conventional extension weight-bearing anteroposterior views and is useful for the assessment of knees with early degenerative change. (Modified from Rosenberg, et al. J Bone Joint Surg Am. 1988;70(10):1479-1483.) (B) Normal Rosenberg view. Note that the anterior and posterior margins of the tibial plateaus are superimposed. A minimal joint space width of less than 3 mm is considered narrowed.
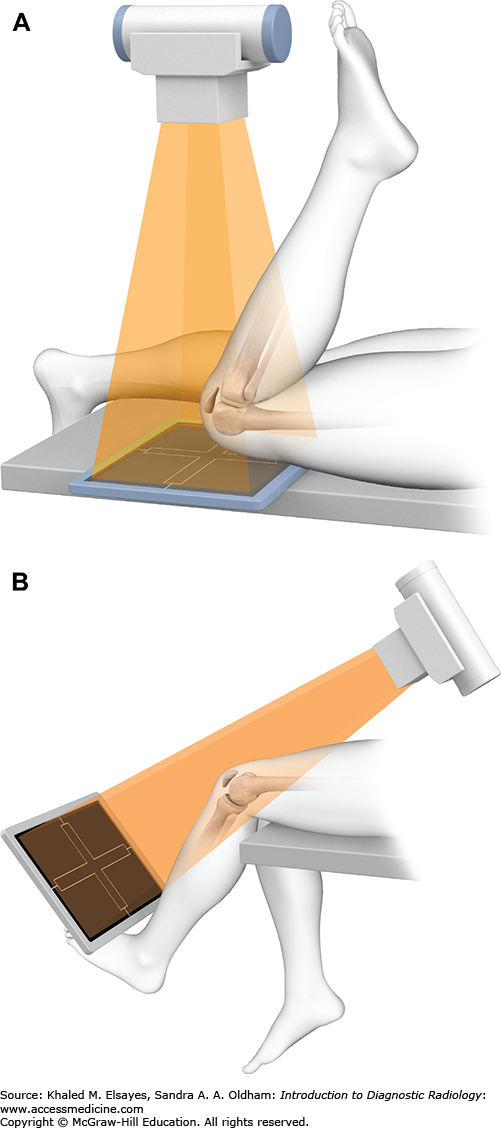
Axial views of the knee should also be obtained to assess the patellofemoral compartment. Two commonly encountered choices for the axial view of the knee are the sunrise (skyline) and Merchant views. Figure C2.2 details the differences. Because of institutional inertia, most axial views of the knee are still labeled as sunrise views. A familiarity with your institution’s protocols is vital to ensure accurate assessment of knee radiographs.
Fig. C2.2
Axial views of the knee. (A) The sunrise view is taken with the knee in flexion and gives an assessment of patellofemoral joint space narrowing; however, the beam is not tangential to the patellofemoral joint space. (B) The Merchant view, also called the Mountain View, because Drs Merchant, et al, were from Mountain View, CA, is more comfortable for patients with knee pain, provides a better assessment of the articulating surfaces of the femur and the patella, and is better for detection of patellar subluxation. (Modified from MacNab I. J Bone Joint Surg Am. 1952;34A(4):957-967.)
Additional imaging studies are not indicated in patients for whom radiographs are diagnostic of degenerative joint disease unless treatment depends on additional findings, or when symptoms are not explained by the radiographic findings. Magnetic resonance imaging (MRI) can be obtained when radiographs are nondiagnostic or incongruent with clinical findings (eg, suspected internal derangement, insufficiency fracture, or inflammatory arthropathy) or when pain persists despite normal radiographs. As the meniscus also contributes to the joint space, meniscal degeneration and extrusion can account for a significant amount of joint space narrowing seen on radiographs.
While early joint space narrowing is best assessed radiographically using Rosenberg views, advanced OA can be appreciated on standard AP views. Radiographic findings of OA of the knee (Fig. C2.3A-C) include joint space narrowing, osteophyte formation, subchondral sclerosis and cyst formation, and bone attrition (flattening). Narrowing of the medial compartment is more common and can lead to varus deformity of the knee (“bowlegged”) and widening of the lateral compartment. Mineralized intra-articular bodies can also be appreciated on radiographs. The term “loose body” is avoided by some radiologists because the intra-articular fragments may be adherent to synovial surfaces and therefore not “loose.”
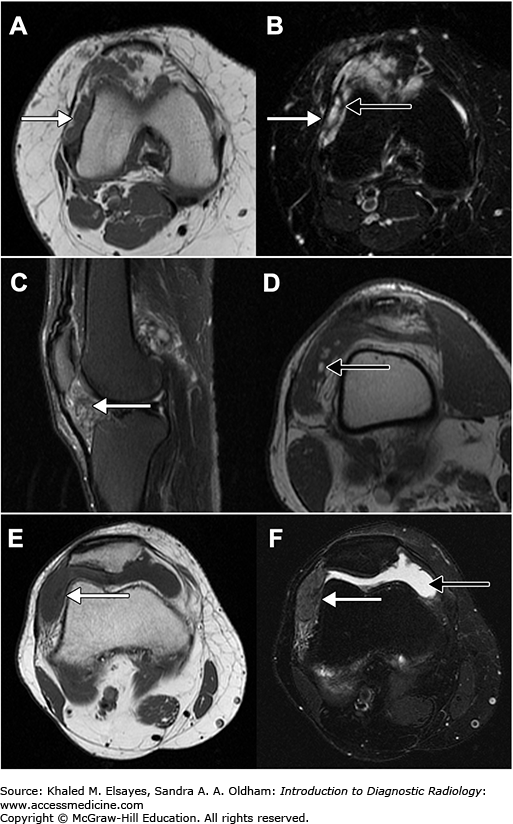
Fig. C2.3
Tricompartmental osteoarthritis in different patients. (A) Anteroposterior view of the knee reveals severe medial compartment joint space narrowing causing mild varus deformity of the knee. Mild subchondral sclerosis (black arrow), subchondral cysts (white arrows), and marginal osteophytes (white arrowheads) are also seen. (B) The lateral view from the same patient reveals similar findings at the patellofemoral compartment and an intra-articular body (long black arrow). (C) Merchant view in another patient reveals osteophytes (white arrowheads) both medially and laterally at the patellofemoral articulation, as well as subchondral sclerosis (white arrow) along the lateral patellar facet. (D) Coronal fluid-sensitive image in another patient reveals a macerated and extruded medial meniscus (black arrowhead), subchondral edema (*), and focal cartilage loss (black arrow). (E) Sagittal fluid-sensitive image reveals subchondral edema (*) and subchondral cysts (white arrows). (F) Fluid-sensitive axial image reveals severe loss of articular cartilage at the lateral patellofemoral compartment associated with subchondral edema (*). An osteophyte (white arrowhead) is also seen.
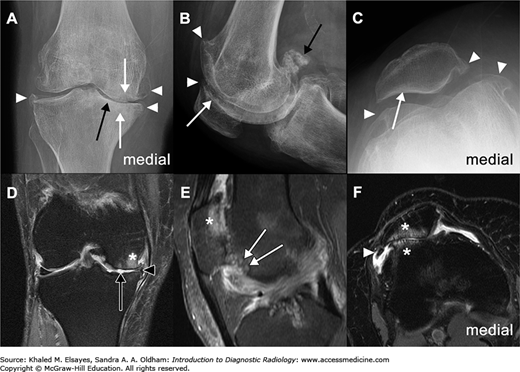
MRI provides a direct assessment of the articular cartilage (Fig. C2.3D-F). Cartilage abnormalities in OA include focal signal changes, thinning, and partial-thickness to full-thickness defects (sometimes with exposure of the subchondral bone). Associated subchondral sclerosis manifests on MRI as thickening of the cortical signal void (T1 and T2 hypointensity). Bone marrow signal abnormalities (T1 hypointensity and T2 hyperintensity) are often focal and seen in the presence of cartilage defects. Subchondral cysts appear as well-defined areas of fluid signal (T1 hypointensity and T2 hyperintensity) that may or may not communicate with a synovial space. The sclerotic margin that is often seen around cysts is more apparent on radiographs.
Attrition, the flattening and depression of the articular surfaces of bones, is associated with severe OA. This is best assessed on MR images by noting deviation from the normally convex surfaces of the medial and lateral femoral condyles, the medial facet of the patella, and the flat to slightly convex surface of the lateral tibial plateau.
MRI is also sensitive for meniscal abnormalities ranging from mucoid degeneration to maceration and extrusion. Mild synovial inflammation and thickening are frequently seen in or near the intercondylar notch, the infrapatellar fat, and the posterior joint. Moderate or large effusions are more frequently seen in patients with pain than in those without pain, and the prevalence of effusions increases with increasing radiographic severity of OA.
Intra-articular bodies may also be present and appear as hypointense structures in the joint capsule or in a Baker cyst.
Calcium pyrophosphate dehydrate deposition arthropathy (Fig. C2.4) can present as isolated or disproportionate patellofemoral joint space narrowing and should be considered when seen in conjunction with chondrocalcinosis (calcification along fibrocartilage menisci and hyaline cartilage) and calcium deposition in the gastrocnemius tendon origin.
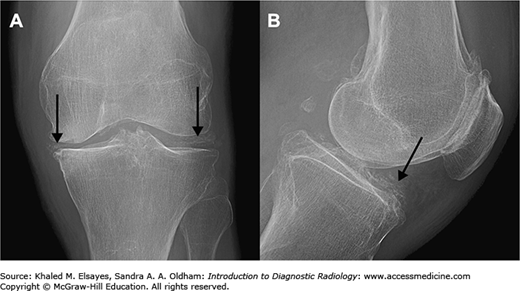
Fig. C2.4
Calcium pyrophosphate dehydrate deposition (CPDD) arthropathy has an appearance similar to that of osteoarthritis and requires joint aspiration for definitive diagnosis. (A) Frontal and (B) lateral views of the knee show the characteristic appearance of CPDD arthropathy: isolated or disproportionate patellofemoral osteoarthritis in conjunction with chondrocalcinosis (black arrows).
OA is the most common cause of chronic atraumatic knee pain in elderly patients. Other considerations for atraumatic knee pain in adults include meniscal and ligament tears, stress fracture (see case 9), transient osteoporosis, and chronic regional pain syndrome. MRI is the imaging modality of choice for evaluation of these conditions.
The presence of severe local inflammation, erythema, and progressive pain unrelated to usage should raise concern for infectious or inflammatory arthropathies.
DL, Daffner
RH, Weissman
BN,
et al. Expert Panel on Musculoskeletal Imaging. ACR Appropriateness Criteria. Nontraumatic knee pain (online publication). Reston, VA: American College of Radiology (ACR); 2008.
T, Jonsson
K. Radiography in osteoarthritis of the knee. Skeletal Radiol. 1999;28(11):605-–615.
[PubMed: 10591922]
WG, Ominsky
SH. Mountain view of the patella.AJR. 1981;136(1):53-–58.
[PubMed: 6779580]
A, Zaim
S, Taouli
B, Miaux
Y, Peterfy
CG, Genant
HG. MR findings in knee osteoarthritis. Eur Radiol. 2003;13(6):1370-–1386.
[PubMed: 12764655]
KM, Arden
NK, Doherty
M,
et al. Standing Committee for International Clinical Studies Including Therapeutic Trials ESCISIT. EULAR recommendations 2003: an evidence based approach to the management of knee osteoarthritis: report of a task force of the Standing Committee for International Clinical Studies Including Therapeutic Trials (ESCISIT). Ann Rheum Dis. 2003;62(12):1145-–1155.
[PubMed: 14644851]
TD, Paulos
LE, Parker
RD, Coward
DB, Scott
SM. The forty-five-degree posteroanterior flexion weight-bearing radiograph of the knee. J Bone Joint Surg Am. 1988;70(10):1479-–1483.
[PubMed: 3198672]
W, Doherty
M, Peat
G,
et al. EULAR evidence-based recommendations for the diagnosis of knee osteoarthritis. Ann Rheum Dis. 2010;69(3):483-–489.
[PubMed: 19762361]
CASE 3
A 55-year-old woman with morning stiffness of the hands and swelling at metacarpophalangeal joints.
Early rheumatoid arthritis
MRI or ultrasound. Radiographs are insensitive for the diagnosis of early rheumatoid arthritis (~70% of patients in the early stages have normal radiographs) but are used to exclude other causes of joint pain (eg, osteoarthritis and chronic calcium pyrophosphate crystal inflammatory arthritis) and to assess structural damage in established cases of rheumatoid arthritis.
MRI and ultrasound are both sensitive for the detection of synovial proliferation, which is one of the earliest detectable changes in rheumatoid arthritis. They can also assess disease activity and are useful in differentiating active disease from remission. Finally, MRI and ultrasound are used to evaluate suspected soft tissue complications of rheumatoid arthritis, such as ruptured tendons.
The choice between MRI and ultrasound depends on several factors. Ultrasound is relatively inexpensive, readily available, and allows for assessment of multiple joints, but can be time consuming and does not allow for visualization of bone edema or internal bone structure. It also depends on operator experience and radiologist expertise. MRI provides a more global view of a joint and is not operator-dependent, but is expensive, not globally available, requires more time to image a single joint, often requires the use of intravenous contrast, is susceptible to motion artifact, and has lower spatial resolution than ultrasound. The choice often depends on local expertise and the cost and availability of equipment. In most cases, however, MRI will not be cost-effective for monitoring treatment response.
Rheumatoid arthritis is an immune-mediated inflammatory disease that results in a symmetric polyarthritis that usually involves the small joints of the hands and feet. Rheumatoid arthritis is the most common of the inflammatory joint diseases, a group that also includes erosive, psoriatic, and reactive arthritis. Early treatment with disease-modifying antirheumatic drugs (DMARDs) such as methotrexate and newer biological agents improves clinical outcomes and reduces the progression of joint damage and disability. Early treatment requires early diagnosis, a task that is beyond the capability of radiography. Indeed, recent guidelines of the American College of Rheumatology and European League Against Rheumatism rely on physical examination findings and laboratory data (eg, autoantibodies such as rheumatoid factor and anti-citrullinated protein antibody) for diagnosis, and suggest the use of MRI or ultrasound if additional evidence of joint activity is needed for confirmation of the clinical findings.
Recognition of synovitis is the key to early detection of rheumatoid arthritis by MRI and ultrasound (Fig. C3.1). On ultrasound, synovitis appears as abnormal tissue that is nondisplaceable and poorly compressible. It is usually hypoechoic relative to subcutaneous fat but can sometimes be isoechoic or hyperechoic. A joint effusion is frequently present, and can be differentiated from synovitis by being displaceable. Power Doppler ultrasound is more sensitive than color Doppler for detecting synovial inflammation and has been shown to correlate well with clinical disease activity. While it may be difficult to differentiate synovium from the adjacent cartilage on ultrasound, this can be readily achieved on MRI.
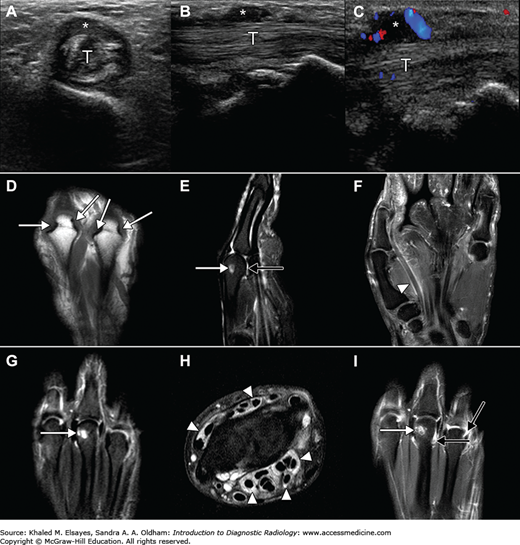
Fig. C3.1
Ultrasound and MRI findings in rheumatoid arthritis in three patients. (A-C) 65-year-old woman with rheumatoid arthritis and trigger finger. Transverse (A) and longitudinal (B,C) images show a thickened and heterogeneous flexor tendon (T) with hypoechoic thickening (*). (C) Color Doppler image shows hyperemia surrounding the tendon. (Ultrasound images used with permission from Dr Frank Malara, Austin Hospital, Melbourne, Australia). (D-I) MR images in two different patients depicting erosions (white arrows), synovitis (black arrows), and tenosynovitis (white arrowheads).
On MRI, synovitis appears as thickened synovium with greater than normal contrast enhancement. T2-weighted sequences can sometimes reveal synovitis as areas of signal that is less intense than joint fluid, but the distinction may be difficult.
Ultrasound and MRI are more sensitive than radiographs for detection of bony erosions. Although computed tomography (CT) is even more sensitive, radiation concerns make it less useful for serial monitoring of disease. On ultrasound, an erosion appears as an intra-articular discontinuity of the bone surface that is visible in two perpendicular planes. Ultrasound, however, is limited by its inability to visualize all parts of a joint (eg, the radial and ulnar aspects of all metacarpophalangeal joints) and can lead to incorrect characterization of normal anatomic variants (eg, normal depressions on the dorsal surfaces of the metacarpal heads) as erosions.
On MRI, an erosion appears as a sharply marginated bone lesion in a juxta-articular location that is visible in at least two planes and has a cortical break that is seen in at least one plane. On T1-weighted images, there is loss of the normal low signal intensity of cortical bone and loss of the normal high signal intensity of trabecular bone. The erosion generally contains inflammatory tissue or fluid, both of which are T2 hyperintense on T2-weighted images. In contrast to fluid, the inflammatory tissue will usually enhance.
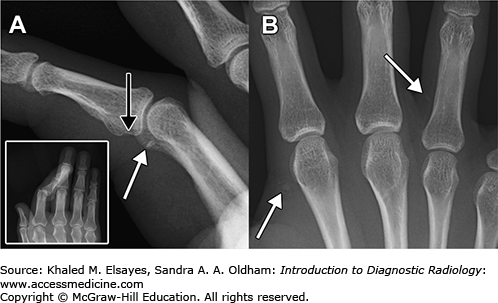
In the early phase of disease, radiographs are either normal or reveal periarticular soft tissue swelling, a potentially subtle finding that is better appreciated on physical examination. Late radiographic findings of rheumatoid arthritis include periarticular osteopenia, marginal erosions, and joint deformity (Fig. C3.2). Joint deformities include ulnar deviation at the metacarpophalangeal joints; radial deviation of the radiocarpal articulation; swan-neck, boutonnière, and hitchhiker’s thumb deformities; and telescoping of the fingers.
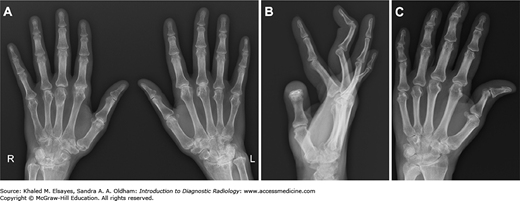
Fig. C3.2
Late radiographic findings in rheumatoid arthritis in the hands of three patients. (A) Radiographs of the hands reveal a symmetric polyarthropathy involving the distal radioulnar, radiocarpal, intercarpal, carpometacarpal, and metacarpophalangeal articulations, with joint space narrowing, periarticular osteopenia, and erosions at multiple sites. There is radial deviation at the radiocarpal articulation, but no obvious ulnar deviation at the metacarpophalangeal joints. Note that the distal interphalangeal joints are spared. (B) Lateral radiograph of the hand in another patient shows a swan-neck deformity of the middle finger: flexion of the metacarpophalangeal and distal interphalangeal joints and hyperextension of the proximal interphalangeal joint. While not pathognomonic, swan-neck and boutonnière deformities (not shown) are more often seen in rheumatoid arthritis than in the other inflammatory arthritides. (C) Frontal view of the hand reveals joint space narrowing and erosions at the radioulnar, radiocarpal, intercarpal, carpometacarpal, and metacarpophalangeal articulations. There is also dorsal subluxation at the interphalangeal joint of the thumb, giving the so-called hitchhiker’s thumb deformity.
Psoriatic arthritis, juvenile idiopathic arthritis, and chronic calcium pyrophosphate crystal inflammatory arthritis can produce similar imaging findings and present an imaging diagnostic challenge. Knowledge of the distribution of various arthritides in the hands (Fig. C3.3) can be helpful in some cases. Typical imaging findings in these conditions are shown in Fig. C3.4.
Fig. C3.3
Distribution of the arthritides in the hands. (A) Osteoarthritis is characterized by joint space narrowing, osteophyte formation, and subchondral sclerosis at the proximal and distal interphalangeal joints, as well as the carpometacarpal and interphalangeal joints of the thumb. Calcium pyrophosphate crystal inflammatory arthritis has a similar distribution, but with chondrocalcinosis characteristically seen at the wrist. (B) Rheumatoid arthritis is characterized by involvement of the radiocarpal, intercarpal, carpometacarpal, metacarpophalangeal, and proximal interphalangeal joints, central and marginal erosions, periarticular osteopenia, and joint deformities. Juvenile idiopathic arthritis (formerly juvenile rheumatoid arthritis) has a distribution similar to that of rheumatoid arthritis. (C) Erosive osteoarthritis is characterized by involvement of the proximal and distal interphalangeal joints, erosions with “gull-wing” deformities, and joint ankylosis. (D) Psoriatic arthritis is characterized by involvement of distal interphalangeal joints, erosion of the terminal tufts, “mouse-ear erosions,” pencil-in-cup deformities, “sausage digit,” joint ankylosis, and fluffy periosteal reaction.
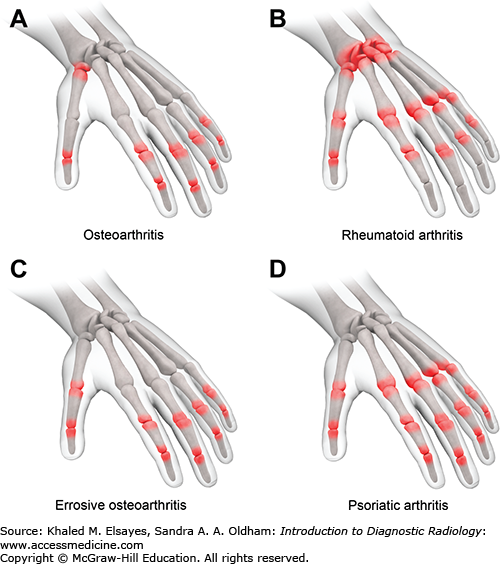
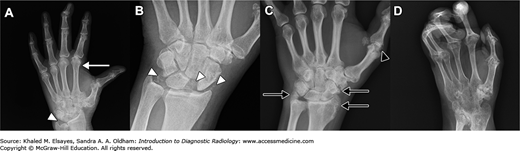
Fig. C3.4
Imaging differential diagnosis for rheumatoid arthritis. (A) Chronic calcium pyrophosphate crystal inflammatory arthritis with radiocarpal, intercarpal, metacarpophalangeal, and interphalangeal joint space narrowing. Changes of osteoarthritis are seen at the distal interphalangeal joints and at the carpometacarpal and interphalangeal joints of the thumb. Chondrocalcinosis is present at the triangular fibrocartilage complex (white arrowhead). A hooklike osteophyte is seen at the index finger metacarpal head (white arrow). No erosion is seen. (B) Chronic calcium pyrophosphate crystal inflammatory arthritis in another patient showing chondrocalcinosis at the wrist (white arrowheads) and widening of the scapholunate interval. (C) Psoriatic arthritis with erosion at the thumb metacarpal head (black arrowhead) as well as several areas of proliferative bone formation (black arrows). (Case used with permission from Dr Hansel Otero, Tufts Medical Center, Boston, MA.) (D) Juvenile idiopathic arthritis with advanced destruction of multiple joints, ankylosis (joint fusion) at the wrist, and overgrowth of the metacarpal heads.
Osteoarthritis and other inflammatory arthritides such as psoriatic arthritis and chronic calcium pyrophosphate crystal inflammatory arthritis.
D, Neogi
T, Silman
AJ,
et al. 2010 rheumatoid arthritis classification criteria: an American College of Rheumatology/European League Against Rheumatism collaborative initiative. Ann Rheum Dis. 2010;69(9):1580-–1588. Erratum in: Ann Rheum Dis. 2010;69(10):1892–.
[PubMed: 20699241]
EL, Grainger
AJ., Rheumatoid arthritis: ultrasound versus MRI. AJR. 2011;197(3):541-–546.
[PubMed: 21862794]
YK, Conaghan
PG. Imaging in rheumatoid arthritis. Best Pract Res Clin Rheumatol. 2011;25(4):569-–584.
[PubMed: 22137925]
CASE 4
A 50-year-old man with acute-onset pain and swelling of the right first metatarsophalangeal joint. He has had similar episodes in the past that have responded to over-the-counter analgesics.
Gout
Radiography
Gout is the most common crystalline arthropathy. It occurs as a result of longstanding hyperuricemia, which leads to monosodium urate crystal deposition within joints and soft tissues. Precipitation of monosodium urate crystals within the joint space leads to an intense inflammatory reaction, which manifests clinically as gout. Acute gouty arthritis is characterized by excruciating pain and warmth about the joint. The symptoms may be accompanied by fever and leukocytosis and can persist for several days. Gout affects the lower extremities more frequently than the upper extremities and the smaller joints more frequently than the larger joints. The first metatarsophalangeal joint is the most commonly involved joint on first clinical presentation. The distribution is asymmetric, and clinical presentation is typically monoarticular.
The most common early radiographic feature of gout is soft tissue swelling about the involved joint (Figs. C4.1 and C4.2), which occurs as a result of synovitis, joint capsule distention, and periarticular soft tissue edema. Intermediate-stage and late-stage radiographic features of gout develop 5 to 10 years after onset of clinical symptoms and include:
-
Faint soft tissue calcifications about involved joints
-
Soft tissue or intraosseous masses representing tophi
-
Cortical erosions and irregularity
-
Well-defined juxta-articular erosions with sclerotic rims and overhanging margins
-
Preservation of bone mineralization and joint space
Fig. C4.1
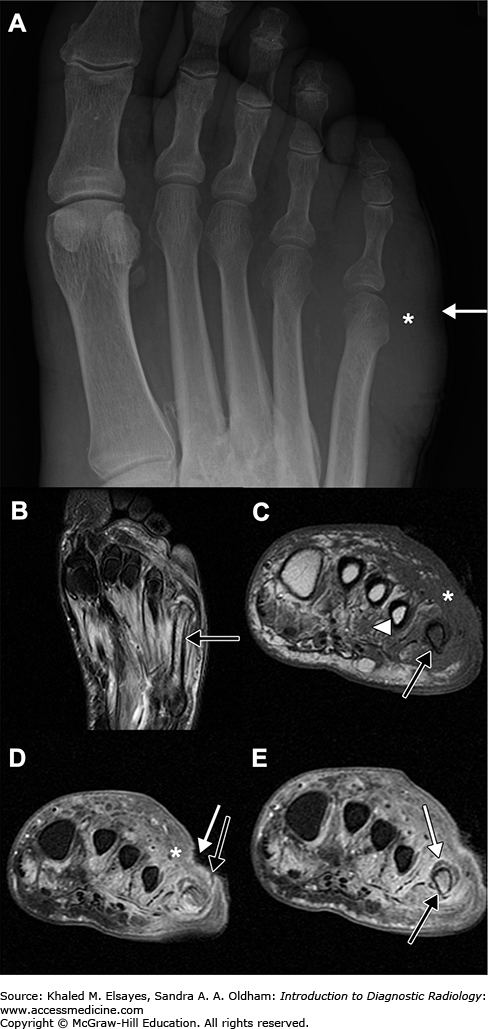
Frontal radiograph of the foot shows large erosions of the first and second metatarsophalangeal joints (black arrows). Small ill-defined soft-tissue mineralization is seen at the tibiotalar joint (white arrow), representing tophi. Diagnosis was confirmed with aspiration of the first metatarsophalangeal joint. Negatively birefringent needle-shaped monosodium urate crystals were identified under polarized microscopic examination.
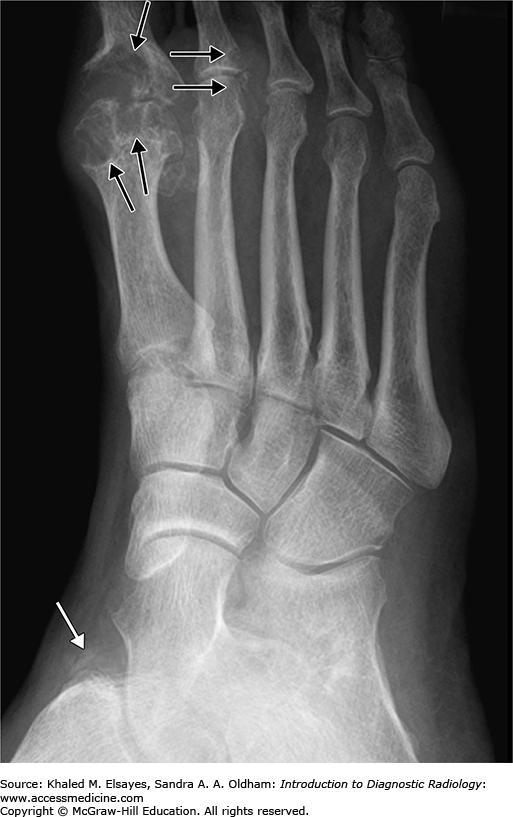
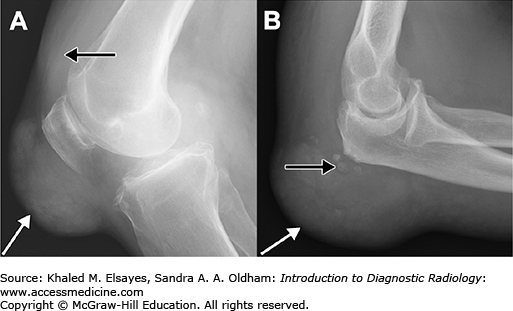
Fig. C4.2
Gout in the larger joints. Although gout most commonly affects the first metatarsophalangeal joint, involvement of larger joints is frequently encountered. (A) Lateral radiograph of the knee shows a large mass in the prepatellar soft tissues with small tophaceous deposits (white arrow) related to gout. A moderate joint effusion is present (black arrow). (B) Lateral radiograph of the elbow shows a large mass in the olecranon bursa (white arrow) with small tophaceous deposits (black arrow).
Secondary degenerative changes with loss of the joint space or even ankylosis may occur at more advanced stages of gout. However, this is rarely seen in the modern era.
Although radiographs are preferred in initial evaluation of gout, MRI (Fig. C4.3A,B) may be performed to detect smaller tophi and earlier-stage disease. Tophi characteristically have low to intermediate signal intensity on both T1- and T2-weighted MR images. Enhancement is typically encountered after administration of intravenous gadolinium due to proliferative synovitis, granulation tissue surrounding the tophus, and inflammatory reaction within adjacent soft tissues.
CT is increasingly used for visualization of tophi (Fig. C4.3C,D). The strength of CT in evaluation of gout lies in its capability to detect subtle bony erosions and to measure attenuation of tophi (150 to 200 Hounsfield units, which is lower than that of calcifications and higher than that of soft tissues). Developments in dual-energy CT currently allow quantification of monosodium urate deposits.
Fig. C4.3
(A,B) Coronal MR images of the foot reveal a small tophus (white arrow) in the soft tissues adjacent to the first metatarsophalangeal joint. The tophus has homogeneous low signal intensity on the T1-weighted image (A) and heterogeneous intermediate to low signal intensity on the T2-weighted image (B). The T2-weighted image also reveals increased signal within the distal metatarsal consistent with edema (black arrow). Small tophaceous deposits such as this are difficult to detect on radiographs. (C,D) Axial CT images in a different patient reveal small tophi adjacent to the proximal tibia (C, white arrow) and small erosions more inferiorly (D, black arrows).
-
Septic arthritis: Microbiological examination and culture of synovial fluid is necessary to exclude septic arthritis, which may coexist with gout.
-
Acute calcium pyrophosphate crystal arthritis: Formerly known as pseudogout. Cartilage calcification or chondrocalcinosis is a more dominant feature. Synovial fluid analysis may reveal positively birefringent rhomboid crystals.
-
Osteoarthritis: Early loss of joint space and lack of erosions differentiate this entity from gout. In gout, joint space loss tends to occur in later stages of the disease.
-
Rheumatoid arthritis: Bilateral, symmetrical joint involvement and juxta-articular osteopenia differentiate this from gout, which tends to be asymmetric and without osteopenia.
The main clinical differential consideration is acute calcium pyrophosphate crystal arthritis, formerly known as pseudogout. This is an acute-onset, self-limiting synovitis associated with deposition of calcium pyrophosphate crystals. Patients typically present with severe, rapid-onset joint pain, tenderness, swelling, and overlying erythema. The symptoms peak within 6 to 24 hours.
N, Doyle
A, McQueen
FM. Imaging in gout: insights into the pathological features of disease. Curr Opin Rheumatol. 2012;24:132-–138.
[PubMed: 22301866]
F, Dalbeth
N, Urresola
A, de Miguel
E, Schlesinger
N. Imaging of gout: findings and utility. Arthritis Res Ther. 2009;11:232.
[PubMed: 19591633]
P, Bardin
T., Gout. Lancet. 2010;375:318-–328.
[PubMed: 19692116]
QS, Dhanda
S, Jagmohan
P. A re-look at an old disease: a multimodality review on gout. Clin Radiol. 2011;66:984-–992.
[PubMed: 21658689]
CASE 5
A 55-year-old man with diabetes mellitus presents with a swollen foot. There is a skin ulcer along the dorsolateral aspect of the fifth metatarsophalangeal joint.
Osteomyelitis
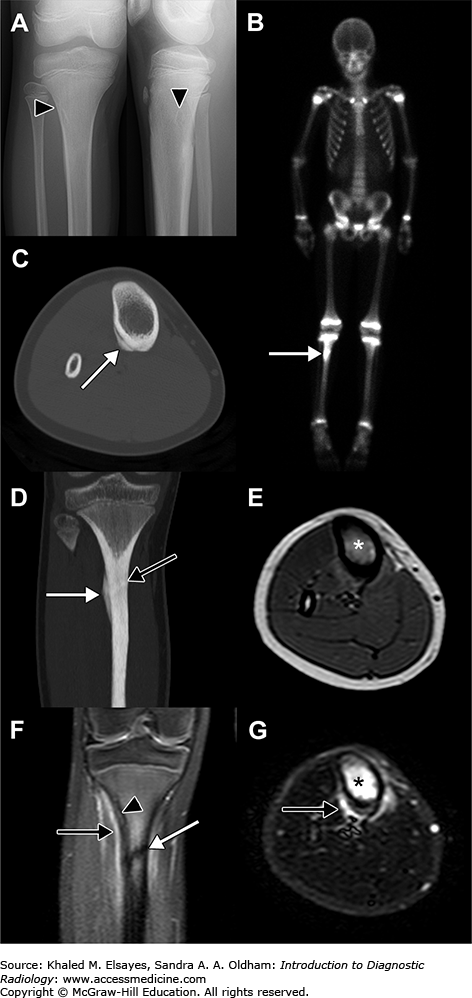
Radiographs in conjunction with MRI with intravenous contrast (Fig. C5.1). Radiographs have low sensitivity and specificity, with an overall accuracy of about 50% for diagnosis of osteomye-litis, but should be obtained as an adjunct to MRI for their superior visualization of cortical bone. Contrast is useful for the evaluation of soft-tissue complications such as sinus tract formation, development of associated abscesses, and necrosis, and provides information for operative planning for limited limb resection. Noncontrast CT and three-phase bone scintigraphy can be obtained in cases in which clinical suspicion for infection is low or if MRI is contraindicated.
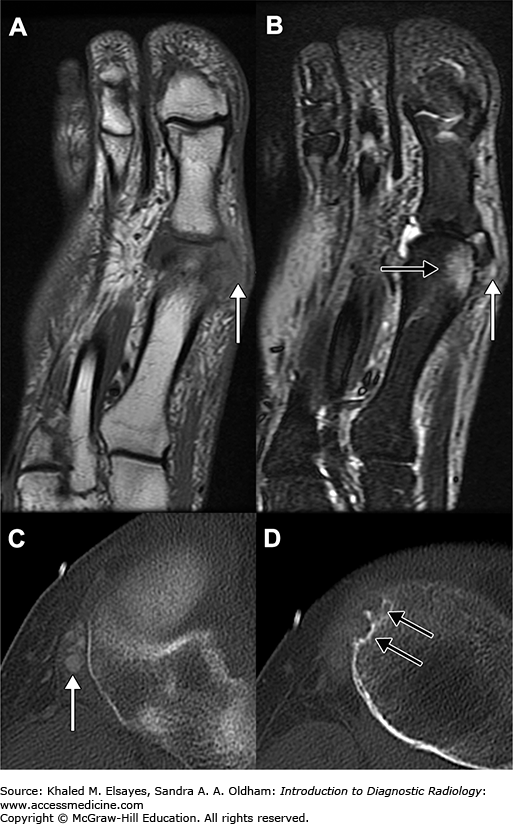
Fig. C5.1
Osteomyelitis in a patient with diabetes mellitus. (A) Radiograph shows a soft tissue defect along the lateral aspect of the foot (white arrow) with associated soft tissue swelling (*) but no bony abnormality. (B) Fluid-sensitive long-axis image of the foot shows bone marrow edema within the fifth metatarsal (black arrow) and soft tissue edema. (C) Short-axis T1-weighted image reveals decreased bone marrow signal (black arrow) that is the same or lower than that of muscle (white arrowhead), consistent with osteomyelitis. Soft tissue edema (*) manifests as decreased signal on T1-weighted images. (D) Postcontrast short-axis image showing the ulcer (white arrow) and a sinus tract (black arrow) extending to the fifth metatarsal. Enhancement (*) is seen in the inflamed soft tissues. (E) A postcontrast short-axis image at the same level as C shows that the bone marrow enhances (black arrow), indicating viable bone. Periosteal elevation (white arrow) is seen as a hypointense line that is lifted off the underlying bone by an enhancing layer of inflammatory tissue.
Foot infections are common in patients with diabetes mellitus and range from superficial infections and cellulitis to deep infections and osteomyelitis. Osteomyelitis (infection of the bone marrow) is the dreaded complication, and delayed diagnosis can increase the risk of amputation. Physical examination can be unreliable because the clinical findings of osteomyelitis may be masked or blunted in patients with diabetes mellitus. In addition, neuropathic (Charcot) arthropathy, which is present in up to 7.5% of patients with diabetes mellitus, can present with erythema, edema, and elevated temperature of the foot and mimic clinical findings of infection. Ulceration, neuropathy, and exposed bone increase the pretest probability for osteomyelitis.
Radiography has low sensitivity for osteomyelitis, especially early in the course of the disease. After about 2 weeks, radiographs may reveal demineralization, periosteal reaction, and bony destruction, often in proximity to a pedal ulcer.
The primary MRI finding of osteomyelitis in the foot of a diabetic patient is low bone marrow signal on T1-weighted images at the end of a sinus tract. Secondary signs of osteomyelitis on MRI include skin callus, skin ulcer, sinus tract, cellulitis, abscess, foreign object, and periosteal reaction.
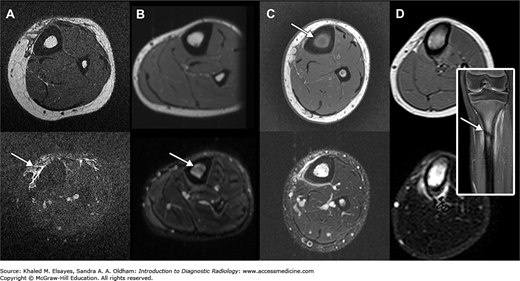
Differential considerations include cellulitis (Fig. C5.2A-D) and neuropathic arthropathy (Fig. C5.2E-H). Cellulitis will present on MRI as soft tissue edema and enhancement. There may be adjacent marrow signal abnormalities; however, marrow T2 hyperintensity without corresponding T1 hypointensity is more likely indicative of osteitis (inflammation of the bone marrow). Osteitis in this setting is a reaction to adjacent soft-tissue infection.
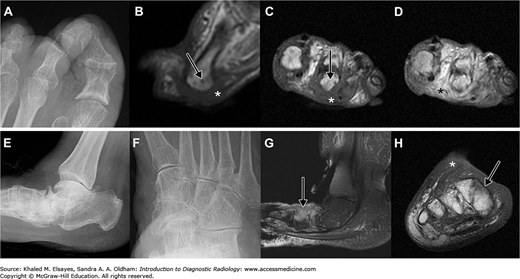
Fig. C5.2
Differential considerations in two patients with diabetes mellitus. (A-D) Cellulitis. (A) Coned-down radiograph in a patient with a pedal ulcer at the second metatarsal head reveals degenerative changes, but no bony destruction. T1-weighted sagittal (B) and short-axis (C) images reveal soft tissue edema (*) and mild bone marrow hypointensity (long black arrows) that is not as hypointense as muscle. (D) Postcontrast short-axis image reveals diffuse soft tissue enhancement (*). (E-H) Neuropathic joint. Coned-down lateral (E) and oblique (F) views of the ankle and midfoot show the typical findings of neuropathic joint, the so-called 6 Ds: increased density (subchondral sclerosis), destruction, intra-articular debris, dislocation, joint distension, and disorganization. (G) Sagittal T2-weighted image reveals bone marrow edema (long black arrow) in a periarticular distribution that is not as dark as muscle on the short-axis T1-weighted image (H), consistent with reactive marrow inflammation (osteitis).
Neuropathic arthropathy can also demonstrate soft tissue edema and bone marrow signal abnormalities. The bone marrow changes in neuropathic joints are periarticular in location, whereas those seen in osteomyelitis are typically diffuse and found adjacent to the ulcer or a sinus tract.
Neuropathic joint, fracture, and septic arthritis are clinical considerations. In septic arthritis, MRI will reveal a complex joint effusion in the involved joint, intense and usually thick synovial enhancement, and T2 hyperintensity in the adjacent bone marrow without corresponding T1 hypointensity.
MS. Diabetic foot infection. Am Fam Physician. 2008; 78(1):71-–79.
[PubMed: 18649613]
A, Schweitzer
ME. Use of MR imaging in diagnosing diabetes-related pedal osteomyelitis. RadioGraphics. 2010; 30(3):723-–736.
[PubMed: 20462990]
MB, Patel
M, Marwin
SE, Palestro
CJ. The diabetic foot. Br J Radiol. 2000;73(868):443-–450.
[PubMed: 10844873]
CASE 6
A 35-year-old man presents to his primary care physician with increasing right knee pain and swelling over the past several weeks. He denies fevers or recent trauma.
Inflammatory or neoplastic process in the joint
Knee radiographs are preferred in initial evaluation of knee pain. However, magnetic resonance imaging (MRI) is required to assess soft tissue structures.
Pigmented villonodular synovitis (PVNS) is a rare disorder characterized by synovial proliferation in the joint, tendon sheath, and bursa. It is believed to be a neoplastic disorder by most authors, whereas others suspect that it is caused by chronic inflammation. PVNS can be classified as localized or diffuse. Distinction between the two is important, since the former can be treated by simple excision with negligible risk of recurrence, whereas the latter requires extensive synovectomy and possibly chemotherapy because of its risk of recurrence.
Symptoms are nonspecific, but primarily consist of painful joint swelling and decreased motion, most commonly in the knee. The underlying effusion is typically hemorrhagic in appearance. Histologically, PVNS is characterized by diffuse hemosiderin staining related to recurrent hemorrhage of the friable villi of proliferative synovium.
Radiographic findings (Fig. C6.1A) include a large joint effusion or intra-articular soft tissue mass and well-defined erosions with preservation of the joint space.
Fig. C6.1
Pigmented villonodular synovitis (PVNS) in two patients. (A) Lateral radiograph of the knee shows a soft tissue density mass (white arrow) in the suprapatellar recess of the joint. (B) T2-weighted image in the same patient reveals low intensity nodular synovial proliferation (white arrow), as well as a moderate joint effusion (black arrow). The nodular appearance of the synovial proliferative tissue is characteristic of PVNS. No bony erosion was identified in this patient. Sagittal T1 (C) and T2 (D) weighted images in another patient show a large amount of hypointense nodular synovial tissue throughout the joint (white arrows), as well as bony erosions within the femur and tibia (black arrows).
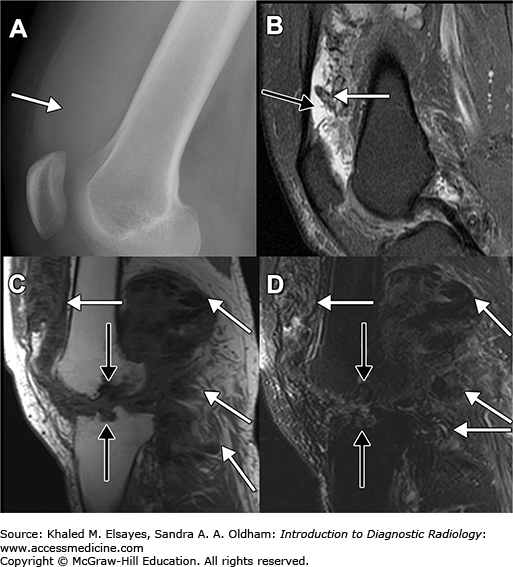
MRI findings (Fig. C6.1B-D) include a typically large joint effusion, heterogeneous synovial thickening, areas of “blooming artifact” on gradient-echo imaging due to hemosiderin deposition, prominent synovial enhancement, and subtle bony erosions with preservation of the joint space.
-
Synovial hemangioma (Fig. C6.2A,B) can have similar MRI findings due to repetitive intra-articular hemorrhage and synovial hemosiderin deposition.
Serpentine vessels seen with synovial hemangioma will not be seen with PVNS.
-
Synovial chondromatosis (Fig. C6.2C,D): The small, round, ossified bodies of synovial osteochondromatosis are generally apparent on radiographs and allow for easy differentiation from PVNS, whereas the nonossified bodies of synovial chondromatosis can occasionally present as a soft tissue mass on radiographs and MRI.
-
Gout (Fig. C6.2E,F) and amyloid may have an appearance similar to that of PVNS, with low-intensity nodular lesions on T1- and T2-weighted images. However, no blooming is present on gradient-echo images.
-
Hemophilic arthropathy: The proliferative synovium and juxta-articular erosions encountered in hemophilic arthropathy are similar to those seen in PVNS. A history of hemophilia and the presence of epiphyseal and metaphyseal overgrowth on radiographs are helpful in differentiating the two.
Fig. C6.2
Imaging differential considerations. (A,B) Synovial hemangioma. A soft tissue mass (white arrow) that is intermediate in signal intensity can be seen on the T1-weighted image (A) and is hyperintense on the T2-weighted image (B). Hypointense bands are seen within the lesion (black arrow). Serpentine surrounding vessels could be appreciated on contiguous axial images. (C,D) Synovial chondromatosis. (C) T2-weighted sagittal image reveals nodular and hypointense proliferation of the synovium (white arrow), without blooming to suggest hemosiderin deposition. (D) T1-weighted axial image reveals several well-defined hyperintense nodules (one is indicated by the black arrow), consistent with early ossification in the continuum of synovial chondromatosis to synovial osteochondromatosis. These ossified nodules were not apparent radiographically. (E,F) Gout mimicking PVNS. Axial T1-weighted (E) and T2-weighted (F) images reveal a hypointense soft tissue mass in the lateral aspect of the joint. Biopsy showed this to represent a gouty tophus. A small joint effusion (black arrow) was also present.
Internal derangement, septic arthritis, and gout can have similar clinical presentations.
NA, Ryan
AG, Choudur
H, Torreggiani
W, Nicoloau
S, Munk
PL, Al-Ismail
K. Pigmented villonodular synovitis. Clin Radiol. 2004;59:414-–420.
[PubMed: 15081846]
J, Palmer
J, Monill
JM, Franquet
T, Bagué
S, Rosón
N. MR imaging of benign soft-tissue masses of the foot and ankle. RadioGraphics. 1998;18:1481-–1498.
[PubMed: 9821196]
MD, Rhee
JH, Lewis
RB, Fanburg-Smith
JC, Flemming
DJ, Walker
EA. Pigmented villonodular synovitis: radiologic-pathologic correlation. RadioGraphics. 2008;28(5):1493-–1518.
[PubMed: 18794322]
S, Ayral
X, Dougados
M, Gossec
L. Pigmented villonodular synovitis: a retrospective single-center study of 122 cases and review of the literature. Semin Arthritis Rheum. 2011;40:539-–546.
[PubMed: 20884045]
EA, Fenton
ME, Salesky
JS, Murphey
MD. Magnetic resonance imaging of benign soft tissue neoplasms in adults. Radiol Clin North Am. 2011;49:1197-–1217.
[PubMed: 22024295]
CASE 7
A 30-year-old man with pain and deformity of the ring finger metacarpal after punching a wall (Fig. C7.1).
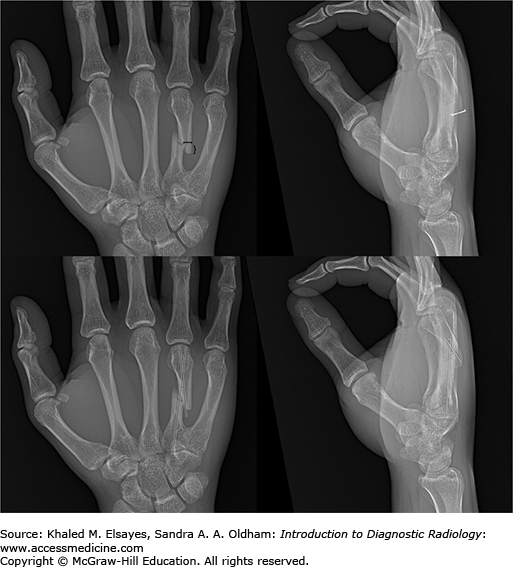
Fig. C7.1
Oblique fracture of the mid diaphysis of the ring finger metacarpal. There is ulnar (medial) displacement by one-half the bone width (black square bracket), dorsal displacement by nearly the full bone width (white square bracket), approximately 5 mm of overlap (black bracket), approximately 20° of volar (toward the palm) angulation, and approximately 5° of radial (lateral, toward the radius) angulation.
Fracture
Radiographs. Noncontrast CT may be needed for operative planning, and contrast-enhanced CT arteriogram is indicated if there is concern for vascular injury.
A systematic and standardized approach to fractures will ensure complete evaluation of the patient and proper communication of findings among healthcare professionals. Fractures are classified as open (formerly compound) if a break in the skin and underlying soft tissue communicates directly with the fracture and its hematoma. This is best assessed by direct examination of the patient; however, subcutaneous gas or an obvious soft tissue defect extending to the fracture is a suggestive finding on imaging.
The next step is to describe the location of the fracture (eg, proximal metaphysis of the femur, mid-diaphysis of the humerus). Fractures of the ends of bones must be carefully assessed for extension to the articular surface, since this can have important ramifications for treatment and prognosis. CT is used to fully define the intra-articular extension of fracture planes.
Fracture classification is the next step and involves assessment of the underlying bone, the extent of the fracture, and the plane (or planes) of fracture. A classification scheme is presented in Fig. C7.2.
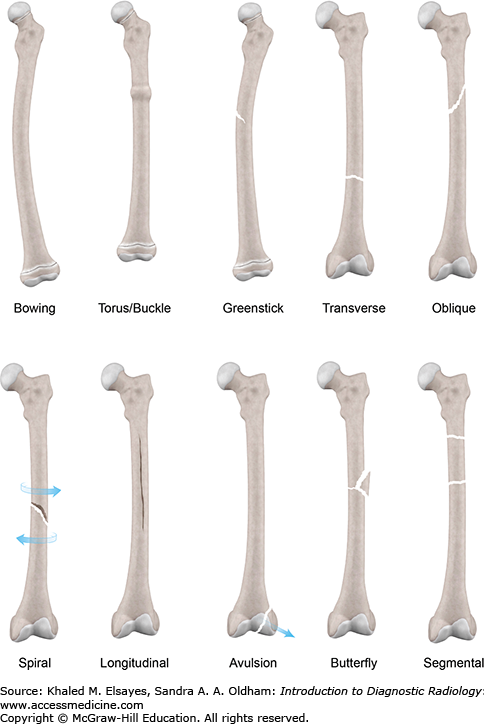
Fig. C7.2
Fracture classification. Moving inward, we first assess the underlying bone. A fracture through a bone lesion is called a pathologic fracture. An insufficiency fracture is a type of stress fracture that occurs with normal activity on abnormal (eg, osteoporotic) bone. We next assess whether the fracture is complete or incomplete. Complete fractures extend across the whole width of the bone, while incomplete fractures have a single cortical break. Bowing, torus, and greenstick fractures are incomplete fractures that are frequently seen in children. Fractures may have a single plane (transverse, oblique, etc) or can be comminuted. Segmental fractures are comminuted fractures that divide a long bone into successive pieces by consecutive transverse fractures. Butterfly fractures have a wedge-shaped fragment that is split from the dominant fracture fragments.
Next we assess the relationship of the fracture fragments. By convention, we describe the relationship of the distal fragment to the proximal fragment (Fig. C7.3).
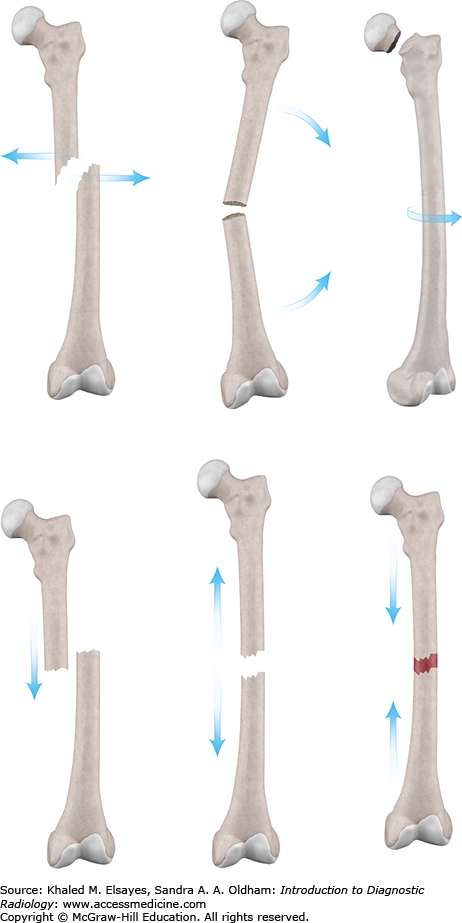
Fig. C7.3
Orientation of fracture fragments. Displacement refers to the relationship of fracture fragments along the transverse plane of the long bone, whereas distraction and overlap describe the relationship of the fracture fragments along the longitudinal axis of the bone. Impaction refers to fracture fragments being forcibly driven into each other. Angulation refers to the angle the distal fragment forms with the proximal fragment. A laterally angulated distal fragment is said to have valgus angulation, whereas a medially angulated distal fragment is said to have varus angulation. Finally, any rotary component of the fracture is described by noting the relationship of the distal fracture fragment to the proximal fragment as internally or externally rotated.
Additional fracture planes that upgrade a simple fracture to a comminuted fracture can sometimes be subtle or occult on radiographs. CT can be helpful in such cases. A careful search must be made to determine if there is an underlying bone lesion, since this will dramatically impact immediate and long-term patient management.
The clinical differential diagnosis for fractures varies according to site. Some fractures can mimic soft tissue injuries such as muscle strains or ligament tears.
K, Zuckerman
J. Handbook of Fractures. 3rd ed. Lippincott; 2006.
CASE 8
A 12-year-old runner with 2 months of pain in her right proximal tibia. She wants to know when she can return to running. Imaging workup is initiated (Fig. C8.1).
Fig. C8.1
Tibial fatigue fracture. (A) Radiographs reveal no evidence of fracture. An incidental benign lesion (a nonossifying fibroma) is seen (black arrowhead). (B) Whole-body Tc-99m MDP scan reveals increased uptake at the right proximal tibia (white arrow). (C) Axial CT image reveals periosteal reaction (white arrow). (D) Coronal reformation reveals periosteal reaction (white arrow) and a sclerotic line (black arrow) representing the fracture. (E) Axial T1-weighted image reveals loss of normal fat signal of the marrow (*). (F) Coronal fluid-sensitive sequence reveals the nonossifying fibroma (black arrowhead), the fracture (white arrow), and periosteal edema (black arrow). (G) Axial fluid-sensitive sequence reveals marrow (*) and periosteal (black arrow) edema.
Stress injury
Radiographs are obtained mainly to exclude other causes of pain. In competitive athletes with tight training schedules, MRI can provide prognostic information.
Shin splints and tibial fatigue fractures are in the spectrum of soft-tissue and bony abnormalities that develop in response to chronic repetitive stress and can be difficult to differentiate clinically (Fig. C8.2).
Shin splints (also known as medial tibial stress syndrome) refers to pain on the medial aspect of the tibia, often in the mid or distal diaphysis. It is thought to be caused by a combination of traction on the periosteum by the calf muscles and repetitive bending loads across the tibia that result in inflammatory changes of the periosteum followed by periosteal reaction and adaptive changes of the tibial cortex.
Stress fractures occur as the result of repeated loading of bone with forces less than that required for an acute traumatic fracture. Stress fractures due to abnormal activity (eg, excessive running) on normal bone are called fatigue fractures, and stress fractures due to normal activity on abnormal (eg, osteoporotic) bone are called insufficiency fractures.
Recreational runners presenting with symptoms suggestive of a tibial stress injury can be treated conservatively with rest and analgesics, with follow-up imaging if symptoms persist. However, when faced with a competitive runner with tibial pain, the question is often “when can my patient return to full-impact activity?” Fredericson et al. (1995) have proposed an MRI grading system for tibial stress reactions that can be used to plan how long an athlete should rest before returning to full-impact exercise (Table C8.1 and Fig. C8.2).
Fredericson Grading of Tibia Stress Reactions
| Grade | Scintigraphy | Periosteum MRI | Marrow | Time to Full-Impact Activity |
|---|---|---|---|---|
| 1 | Small ill-defined cortical area of mildly increased activity | Mild to moderate increased T2 signal | Normal | 2-3 weeks |
| 2 | Larger well-defined elongated cortical area of moderately increased activity | Moderate to marked increased T2 signal | Increased T2 signal | 4-6 weeks |
| 3 | Wide fusiform cortico-medullary area of highly increased activity | Moderate to marked increased T2 signal | Decreased T1 and increased T2 signal | 6-9 weeks |
| 4 | Extensive transcortical area of intensely increased activity | Moderate to marked increased T2 signal | Decreased T1 and increased T2 signal plus clear fracture plane | 6 weeks in a cast followed by 6 weeks of nonimpact activity |
Fig. C8.2
Spectrum of tibial stress injuries as graded by Fredericson et al (1995) (see Table C8.1). T1-weighted images are on the top, and T2-weighted images are on the bottom. Arrows point to changes that elevate the grade. (A) Grade 1, mild to moderate increased T2 signal in the periosteal soft tissues. (B) Grade 2, T2 hyperintensity in the marrow. (C) Grade 3, T1 hypointensity in the marrow. (D) Fracture plane.
Radiographs can be normal in the early stages. Three-phase bone scintigraphy (commonly, technetium Tc-99m methylene diphosphonate [Tc-99m MDP]) is more sensitive than radiography. Early-phase (arterial and blood pool) images are typically normal. Delayed phase images reveal uptake along the tibia that ranges from a small focus of mild cortical uptake to intense and extensive transcortical uptake. However, differentiation between medial tibial stress syndrome and stress fracture can be difficult with scintigraphy. MRI can depict the full spectrum of stress reactions (Table C8.1 and Fig. C8.2).
Although imaging findings in symptomatic runners are characteristic of various stress injuries, it should be noted that asymptomatic runners can have many of the same imaging findings. Therefore, images cannot provide a diagnosis of a tibial stress reaction without the benefit of clinical information, necessitating the inclusion of the dreaded phrase “clinical correlation recommended” in the report.
Rarely, tibial stress fractures can lead to a more extensive edema pattern and can mimic a neoplastic or infectious process.
In addition to medial tibial stress syndrome and fatigue fracture, the clinician must consider pathologic fracture by a neoplasm, exertional compartment syndrome, tendinitis, fascial defect, musculotendinous junction disruption, popliteal artery entrapment, effort-induced venous thrombosis, and nerve entrapment.
M, Bergman
AG, Hoffman
KL, Dillingham
MS. Tibial stress reaction in runners: correlation of clinical symptoms and scintigraphy with a new magnetic resonance imaging grading system. Am J Sports Med. 1995;23(4):472-–481.
[PubMed: 7573660]
M, Minutoli
F, Vinci
S, Salamone
I, D’Andrea
L, Bitto
L, Magaudda
L, Blandino
A. High-resolution CT grading of tibial stress reactions in distance runners. AJR. 2006;187(3): 789-–793.
[PubMed: 16928946]
N, Guelich
DR. Medial tibial stress syndrome. Clin Sports Med. 2012;31(2):273-–290.
[PubMed: 22341017]
CASE 9
A 65-year-old woman with sudden onset of severe, nontraumatic left knee pain. The patient is otherwise healthy.
Insufficiency fracture, formerly (and incorrectly) known as spontaneous osteonecrosis of the knee (SONK).
Radiography to start. If radiographs are negative or show a joint effusion, MRI should be obtained.
Stress fractures are fractures that occur as the result of repeated loading of bone with forces less than that required for an acute traumatic fracture. Stress fractures due to abnormal activity (eg, excessive running) on normal bone are called fatigue fractures, and stress fractures due to normal activity on abnormal (eg, osteoporotic) bone are called insufficiency fractures. Whereas many stress fractures heal without ever being diagnosed, some may progress to complete fractures and subsequent degenerative changes.
Initial radiographs may be normal. A careful assessment of the contours of the femoral condyles can reveal a subtle impression along the medial femoral condyle (involvement of the lateral femoral condyle and medial tibial plateau is uncommon, and the lateral tibial plateau is rarely affected). Delayed radiographs (Fig. C9.1A) reveal a subchondral lucency that can progress to flattening and collapse of the articular surface, and finally to degenerative changes.
Fig. C9.1
Insufficiency fracture of the medial femoral condyle. (A) Fontal radiograph of the knee reveals lucency and cortical contour deformity of the left medial femoral condyle (white arrow). Fat-sensitive (B) and fluid-sensitive (C) MR sequences reveal a hypointense subchondral crescent (black arrows) and extensive bone marrow edema manifesting as T1 hypointensity (B) and T2 hyperintensity (arrowheads). Note the preserved contour of the medial femoral condyle (white arrow). The radiograph (A) was obtained several months after the MR, by which time articular surface collapse had occurred. Early radiographs were normal.
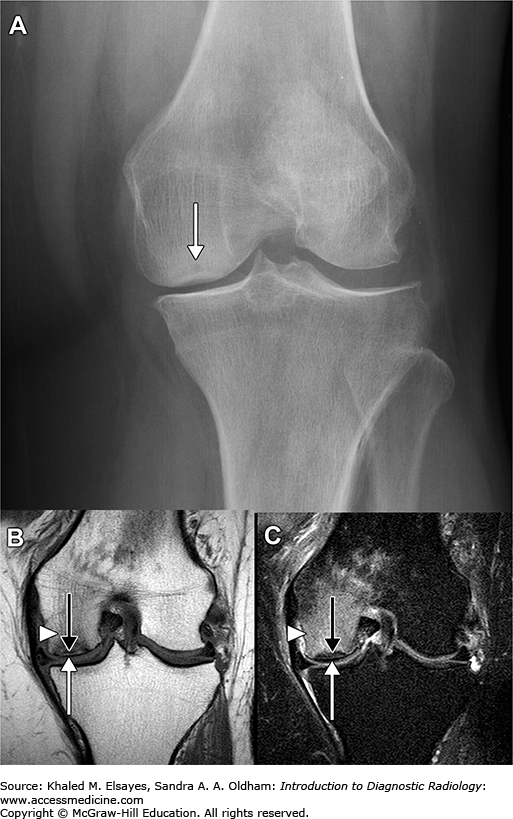
On MRI (Fig. C9.1B,C), there is extensive bone marrow edema, usually located in the medial femoral condyle extending to the intercondylar notch, out of proportion to degenerative changes that may be present in patients in this age group. When located in the tibia, the bone marrow edema can extend to the tibial tuberosity. A hypointense subchondral crescent or linear focus, either of which indicates the presence of a subchondral fracture, is usually present and is best seen on T1-weighted images. Meniscal tears, particularly large radial meniscal root tears, are often present. Cartilage injuries are also commonly seen in these patients.
The presence of a subchondral fracture and/or articular flattening can suggest progression to collapse of the articular surface and subsequent degenerative changes.
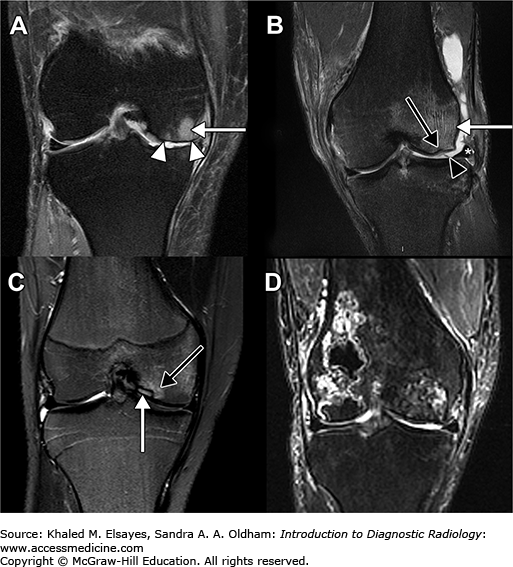
Bone marrow signal abnormalities (Fig. C9.2) can be seen with osteoarthritis, osteochondral contusion and fracture, osteochondritis dissecans, and bone infarction.
Fig. C9.2
Imaging differential considerations. (A) Osteoarthritis can also result in marrow signal abnormality (white arrow), and can be considered when focal subchondral marrow signal abnormalities are seen in the presence of cartilage defects (between white arrowheads) and osteophytes. The bone marrow edema in osteoarthritis tends to be more focal compared with the diffuse edema seen in insufficiency fractures. (B) Osteochondral injury (contusion or fracture) can be considered in the setting of acute knee pain after trauma and usually has associated findings of cruciate and collateral ligament injury and traumatic meniscal tears (*). This case is from a patient with an anterior cruciate ligament tear (not shown), who also has bone marrow edema (white arrow), a small peeled-off chondral fragment (black arrowhead), and a small cortical step-off of the lateral femoral condyle (black arrow). (C) Osteochondritis dissecans is typically seen in children and young adults, and tends to affect males more frequently than females. The osteochondral lesion is usually on the non-weight-bearing surface of the condyle (white arrow), closer to the notch, and is usually less extensive than in insufficiency fractures. The lesion has a characteristic ovoid appearance with sharply marginated borders. Bone marrow edema is indicated by the black arrow. (D) Infarction (classic osteonecrosis) has a characteristic serpentine configuration and is often bilateral and diffuse. Patients typically have a systemic disorder or a history of steroid use or alcoholism.
Osteoarthritis, fracture, infection, neuropathy, infarction, and tumor (metastases in this age group).
HC, Levine
SM, Zoga
AC. MRI findings in the subchondral bone marrow: a discussion of conditions including transient osteoporosis, transient bone marrow edema syndrome, SONK, and shifting bone marrow edema of the knee. Semin Musculoskelet Radiol. 2006;10(3):177-–186.
[PubMed: 17195126]
JB, Miller
TT, Math
K, Schultz
E. Shifting bone marrow edema of the knee. Skeletal Radiol. 2004;33(7): 380-–385.
[PubMed: 15138729]
RR, Kattapuram
SV. MR appearance of SONK-like subchondral abnormalities in the adult knee: SONK redefined. Skeletal Radiol. 2004;33(10):575-–581. Epub 2004 Jul 13 .
[PubMed: 15249985]
RM, Farooki
S, Resnick
D. Spontaneous osteonecrosis of the knee associated with ipsilateral tibial plateau stress fracture: report of two patients and review of the literature. Skeletal Radiol. 2001;30(1):53-–56.
[PubMed: 11289636]
T, Bullough
PG. Spontaneous osteonecrosis of the knee: the result of subchondral insufficiency fracture. J Bone Joint Surg Am. 2000;82(6):858-–866.
[PubMed: 10859106]
CASE 10
A 65-year-old woman with sudden-onset right hip pain after getting out of bed this morning.
Insufficiency fracture of the pelvis
Radiographs followed by MRI or bone scintigraphy (“bone scan”) as needed for diagnosis or CT if needed for operative planning.
Stress fractures can be classified as fatigue (abnormal force on normal bone) or insufficiency (normal force on abnormal bone). In elderly persons, insufficiency fractures of the pelvis and proximal femur are usually due to osteoporosis, but other factors can lead to weakening of bone in this patient population, including radiation therapy, rheumatoid arthritis, prolonged corticosteroid therapy, vitamin D deficiency, and renal failure. Patients with pelvic and proximal femoral insufficiency fractures have prolonged hospital stays and increased morbidity and mortality.
Radiographs may not depict the fracture plane (Fig. C10.1A), especially in the sacrum and ilium, where overlapping bony structures and bowel contents abound. Parasymphyseal and pubic ramus fractures are usually more readily apparent, and radiographic findings may include cortical disruption, sclerotic lines, and a lucent fracture plane.
Fig. C10.1
Insufficiency fractures of the pelvis. (A) 65-year-old woman with prior radiation therapy to the pelvis. (A) No sacral fracture was seen on radiography of the pelvis. There are old insufficiency fractures of the inferior and superior pubic rami (black arrows). (B) Tc-99m MDP bone scintigraphy reveals radiotracer uptake in the characteristic H or Honda pattern. (B) CT reveals fracture planes through both sacral ala (white arrows). The underlying bone has a patchy sclerotic appearance due to prior radiation therapy. (D) T1-weighted MR image reveals the fracture planes as hypointense lines (white arrows) superimposed on a background of decreased signal due to marrow edema (*). (E) T2-weighted image reveals the marrow edema (*) as high signal areas. The fracture planes (white arrows) can also be seen. (Case courtesy of Dr John E. Madewell, MD Anderson Cancer Center.)
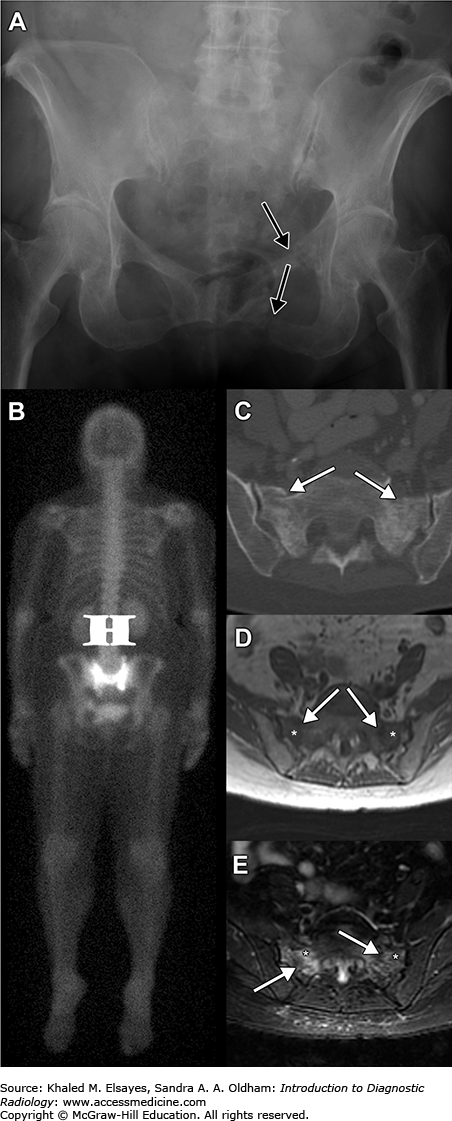
Bone scintigraphy (Fig. C10.1B) is sensitive for detection of pelvic insufficiency fractures. The typical butterfly or H-shaped pattern of radiotracer uptake is formed by vertical fractures of the sacral ala joined by a horizontal component. Incomplete H patterns can also be seen, depending on the specific fractures.
CT findings can range from subtle cortical irregularity to irregular sclerosis to obvious fracture planes (Fig. C10.1C). MRI typically reveals bone marrow edema and a fracture plane (Fig. C10.1D,E), although each may be seen in isolation. Associated soft tissue abnormalities are also common, and consist of muscle edema and loss of normal fat planes. Compared with other pelvic and proximal femoral fractures, sacral insufficiency fractures are more likely to present with marrow edema without a clear fracture plane and are less likely to have associated soft tissue changes.
The fracture plane may not always be visible on MRI, and the bone marrow edema can be similar to that seen with neoplasm and osteomyelitis. CT can help differentiate these entities from fracture. In a fracture, the trabeculae on either side of the fracture plane are intact, and are not destroyed as in tumor or infection.
Avascular necrosis of the femoral head, insufficiency fracture elsewhere in the pelvis, and neoplasm with or without pathological fracture can have similar clinical presentations.
MC, Ambekar
A, Lu
Y, Link
TM. MRI and CT of insufficiency fractures of the pelvis and the proximal femur. AJR. 2008;191(4):995-–1001.
[PubMed: 18806133]
WC, Khong
PL, Yin
Y,
et al. Imaging of pelvic insufficiency fractures. RadioGraphics. 1996;16(2):335-–348.
[PubMed: 8966291]
CASE 11
A 25-year-old man with suspected splinter in hand.
Soft tissue foreign object
In the extremities, ultrasound should be used as the initial imaging modality of choice for detection of foreign objects. High frequency (> 7.5 MHz) linear-array transducers are used. Radiography is limited to visualization of radiopaque foreign objects such as metal and glass.
All soft tissue foreign objects are hyperechoic on ultrasound and will usually have posterior acoustic shadowing (Fig. C11.1A). A surrounding hypoechoic halo of granulation tissue, edema, or hemorrhage can assist in detection of smaller foreign objects. Ultrasound can also be used to identify complications such as abscess formation and vascular injury.
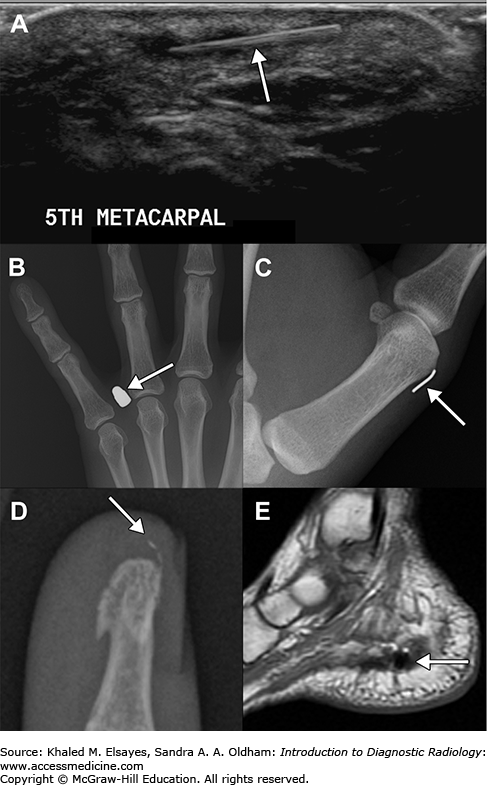
Plastic and wooden foreign objects can be subtle or invisible on radiographs. Secondary signs of laceration such as a skin defect, soft tissue swelling, and subcutaneous gas should be sought to narrow the area of investigation. Radiography can be used to detect metal and glass. The former is well demonstrated on radiographs (Fig. C11.1B,C). The radiopacity of glass is variable and depends on its density and effective atomic number (ie, its ability to attenuate x-ray beams) compared with those of the surrounding soft tissues (Fig. C11.1D). The lead content of glass is often incorrectly cited as the primary factor determining visibility on radiographs.
MRI does not reliably depict most foreign objects. Metallic objects (Fig. C11.1E) can be detected by noting the artifacts associated with their presence, namely loss of signal, geometric distortion, and failure of fat suppression.
Regardless of the imaging modality used, complications of soft tissue foreign objects should be actively investigated. These include vascular injury, infection, and bone injury.
In the absence of clinical information, avulsion fragments (Fig. C11.2A) and soft tissue calcifications (Fig. C11.2B) can mimic foreign objects.
None
LK, Jacobson
JA, Powell
A, Fessell
DP, Hayes
CW. Sonography and radiography of soft-tissue foreign bodies. AJR. 2001;176(5):1155-–1159.
[PubMed: 11312171]
CASE 12
A 35-year-old man with wrist pain after a fall on an outstretched hand. On physical examination, there is tenderness over the anatomic snuffbox.
Scaphoid fracture
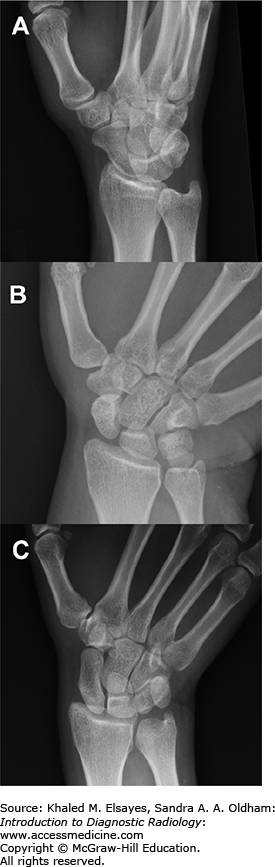
Strart with 4-view wrist radiography. Standard frontal and lateral radiographs of the wrist are often inadequate for diagnosis of scaphoid fractures, and specialized views are used (Fig. C12.1). The choice of these views, however, varies according to local preferences.
Fig. C12.1
Some of the additional views used for diagnosis of scaphoid fractures. (A) Semipronated view: a 45° ulnar oblique posteroanterior projection (to detect oblique sulcal, waist, and tubercle fractures). (B) Ulnar-deviated posteroanterior view (to detect proximal pole fractures). (C) Ziter’s “banana” view (to detect fractures of the waist of the scaphoid).
The blood supply of the scaphoid (Fig. C12.2) leaves it susceptible to avascular necrosis and nonunion after fracture. The risk of avascular necrosis varies according to the location of the fracture. Fractures of the middle third of the scaphoid are associated with avascular necrosis in about one-third of cases, whereas fractures of the proximal fifth are associated with avascular necrosis in nearly all cases.
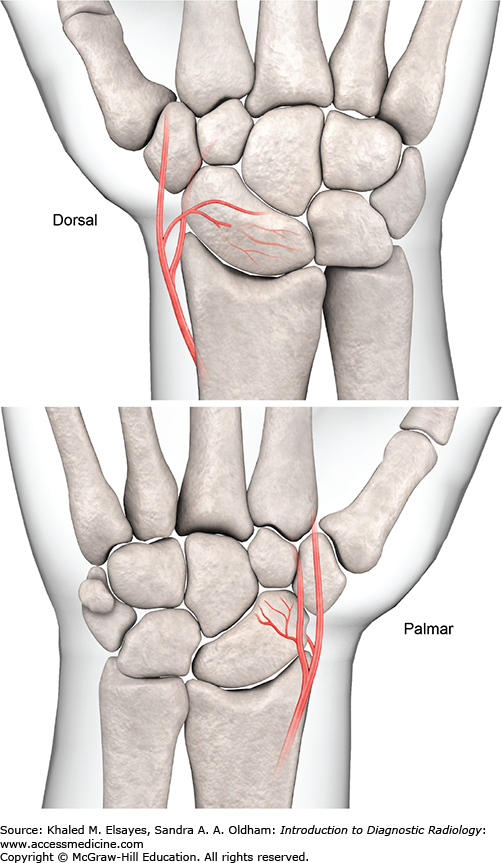
Fig. C12.2
The vascular supply of the scaphoid is distal-to-proximal from two sources: a group of vessels entering the dorsal aspect of the distal pole, and a group of vessels entering the palmar aspect of the distal pole. The dorsal group supplies the proximal two-thirds of the bone, and the palmar group contributes largely to the vascularity of the distal one-third.
This concern results in a rather aggressive management approach: In patients with normal radiographs in whom a scaphoid fracture is suspected, the wrist is either further assessed with noncontrast MRI or immobilized with a cast, and radiography is repeated in 10 to 14 days. The choice depends on patient factors (age, hand dominance, activity level, insurance), as well as local preferences and availability of equipment.
Related posts:


Stay updated, free articles. Join our Telegram channel

Full access? Get Clinical Tree


