Oxygen Effect and Reoxygenation
A number of chemical and pharmacologic agents that modify the biologic effect of ionizing radiations have been discovered. None is simpler than oxygen, none produces such a dramatic effect, and, as it turns out, no other agent has such obvious practical implications.
The oxygen effect was observed as early as 1912 in Germany by Swartz, who noted that the skin reaction produced on his forearm by a radium applicator was reduced if the applicator was pressed hard onto the skin. He attributed this to the interruption in blood flow. By 1921, it had been noted by Holthusen that Ascaris eggs were relatively resistant to radiation in the absence of oxygen, a result wrongly attributed to the absence of cell division under these conditions. The correlation between radiosensitivity and the presence of oxygen was made by Petry in 1923 from a study of the effects of radiation on vegetable seeds. All of these results were published in the German literature but were apparently little known in the English-speaking world.
In England in the 1930s, Mottram explored the question of oxygen in detail, basing his investigations on work of Crabtree and Cramer on the survival of tumor slices irradiated in the presence or absence of oxygen. He also discussed the importance of these findings to radiotherapy. Mottram began a series of experiments that culminated in a quantitative measurement of the oxygen effect by his colleagues Gray and Read, using as a biologic test system the growth inhibition of the primary root of the broad bean Vicia faba.
▪ THE NATURE OF THE OXYGEN EFFECT
Survival curves for mammalian cells exposed to x-rays in the presence and absence of oxygen are illustrated in Figure 6.1. The ratio of doses administered under hypoxic to aerated conditions needed to achieve the same biologic effect is called the oxygen enhancement ratio (OER). For sparsely ionizing radiations, such as x- and γ-rays, the OER at high doses has a value of between 2.5 and 3.5. The OER has been determined for various chemical and biologic systems with different end points, and its value for x-rays and γ-rays always tends to fall in this range. There is some evidence that for rapidly growing cells cultured in vitro, the OER has a smaller value of about 2.5 at lower doses, on the order of the daily dose per fraction generally used in radiotherapy. This is believed to result from the variation of OER with the phase of the cell cycle: Cells in G1 phase have a lower OER than those in S, and because G1 cells are more radiosensitive, they dominate the low-dose region of the survival curve. For this reason, the OER of an asynchronous population is slightly smaller at low doses than at high doses. This result has been demonstrated for fast-growing cells cultured in vitro, for which precise survival measurements are possible, but would be difficult to
show in a tissue. There is some evidence also that for cells in culture, the survival curve has a complex shape for doses less than 1 Gy. What effect, if any, this has on the OER is not yet clear.
show in a tissue. There is some evidence also that for cells in culture, the survival curve has a complex shape for doses less than 1 Gy. What effect, if any, this has on the OER is not yet clear.
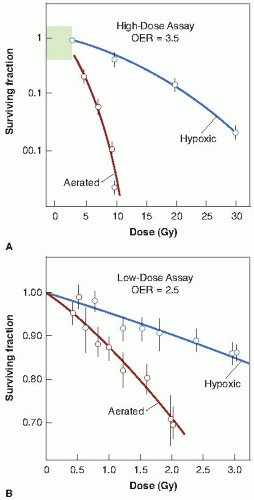 FIGURE 6.1 Cells are much more sensitive to x-rays in the presence of molecular oxygen than in its absence (i.e., under hypoxia). The ratio of doses under hypoxic to aerated conditions necessary to produce the same level of cell killing is called the oxygen enhancement ratio (OER). It has a value close to 3.5 at high doses (A), but may have a lower value of about 2.5 at x-ray doses less than about 2 to 3 Gy (B). (Adapted from Palcic B, Skarsgard LD. Reduced oxygen enhancement ratio at low doses of ionizing radiation. Radiat Res. 1984;100:328-339, with permission.) |
Figure 6.2 illustrates the oxygen effect for other types of ionizing radiations. For a densely ionizing radiation, such as low-energy α-particles, the survival curve does not have an initial shoulder. In this case, survival estimates made in the presence or absence of oxygen fall along a common line; the OER is unity—in other words, there is no oxygen effect. For radiations of intermediate ionizing density, such as neutrons, the survival curves have a much reduced shoulder. In this case, the oxygen effect is apparent, but it is much smaller than is the case for x-rays. In the example shown in Figure 6.2, the OER for neutrons is about 1.6.
In summary, the oxygen effect is large and important in the case of sparsely ionizing radiations, such as x-rays; is absent for densely ionizing radiations, such as α-particles; and has an intermediate value for fast neutrons.
▪ THE TIME AT WHICH OXYGEN ACTS AND THE MECHANISM OF THE OXYGEN EFFECT
For the oxygen effect to be observed, oxygen must be present during the radiation exposure or, to be precise, during or within microseconds after the radiation exposure. Sophisticated experiments have been performed in which oxygen, contained in a chamber at high pressure, was allowed to “explode” onto a single layer of bacteria (and later mammalian cells) at various times before or after irradiation with a 2-µs electron pulse from a linear accelerator. It was found that oxygen need not be present during the irradiation to sensitize but could be added afterward, provided the delay was not too long. Some sensitization occurred with oxygen added as late as 5 milliseconds after irradiation.
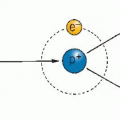
Experiments such as these shed some light on the mechanism of the oxygen effect. There is general agreement that oxygen acts at the level of the free radicals. The chain of events from the absorption of radiation to the final expression of biologic damage has been summarized as follows: The absorption of radiation leads to the production of fast-charged particles. The charged particles, in passing through the biologic material, produce several ion pairs. These ion pairs have very short life spans (about 10-10 second) and produce free radicals, which are highly reactive molecules because they have an unpaired valence electron. The free radicals are important because although their life spans are only about
10-5 second, that is appreciably longer than that of the ion pairs. To a large extent, it is these free radicals that break chemical bonds, produce chemical changes, and initiate the chain of events that result in the final expression of biologic damage; however, it has been observed that the extent of the damage depends on the presence or absence of oxygen.
10-5 second, that is appreciably longer than that of the ion pairs. To a large extent, it is these free radicals that break chemical bonds, produce chemical changes, and initiate the chain of events that result in the final expression of biologic damage; however, it has been observed that the extent of the damage depends on the presence or absence of oxygen.
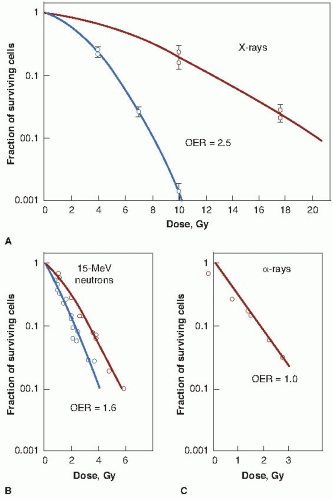 FIGURE 6.2 The oxygen enhancement ratio (OER) for various types of radiation. X-rays exhibit a larger OER of 2.5 (A). Neutrons (15-MeV d+ → T) are between these extremes, with an OER of 1.6 (B). The OER for low-energy α-particles is unity (C). (Adapted from Barendsen GW, Koot CJ, van Kersen GR, et al. The effect of oxygen on impairment of the proliferative capacity of human cells in culture by ionizing radiations of different LET. Int J Radiat Biol Relat Stud Phys Chem Med. 1966;10: 317-327, and Broerse JJ, Barendsen GW, van Kersen GR. Survival of cultured human cells after irradiation with fast neutrons of different energies in hypoxic and oxygenated conditions. Int J Radiat Biol Relat Stud Phys Chem Med. 1968;13:559-572, with permission.) |
If molecular oxygen is present, DNA reacts with the free radicals (R·). The DNA radical can be chemically restored to its reduced form through reaction with a sulfhydryl (SH) group. However, the formation of RO2·, an organic peroxide, represents a nonrestorable form of the target material; that is, the reaction results in a change in the chemical composition of the material exposed to the radiation. This reaction cannot take place in the absence of oxygen; since then, many of the ionized target molecules are able to repair themselves and recover the ability to function normally. In a sense, then, oxygen may be said to “fix” or make permanent the radiation lesion. This is known as the oxygen fixation hypothesis. The process is illustrated in Figure 6.3.
▪ THE CONCENTRATION OF OXYGEN REQUIRED
A question of obvious importance is the concentration of oxygen required to potentiate the effect of radiation. Is the amount required small or large? Many investigations have been performed using bacteria, plants, yeast, and mammalian cells, and the similarities between them are striking.
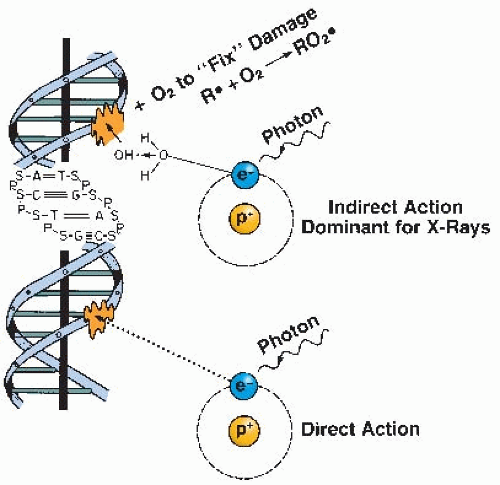 FIGURE 6.3 The oxygen fixation hypothesis. About two-thirds of the biologic damage produced by x-rays is by indirect action mediated by free radicals. The damage produced by free radicals in DNA can be repaired under hypoxia but may be “fixed” (made permanent and irreparable) if molecular oxygen is available. |
The simple way to visualize the effect of oxygen is by considering the change of slope of the mammalian cell survival curve. Figure 6.4 is a dramatic representation of what happens to the survival curve in the presence of various concentrations of oxygen. Curve A is characteristic of the response under conditions of equilibration with air. Curve B is a survival curve for irradiation in as low a level of hypoxia as usually can be obtained under experimental conditions (10 ppm of oxygen in the gas phase). The introduction of a very small quantity of oxygen, 100 ppm, is readily noticeable in a change in the slope of the survival curve. A concentration of 2,200 ppm, which is about 0.22% oxygen, moves the survival curve about halfway toward the fully aerated condition.
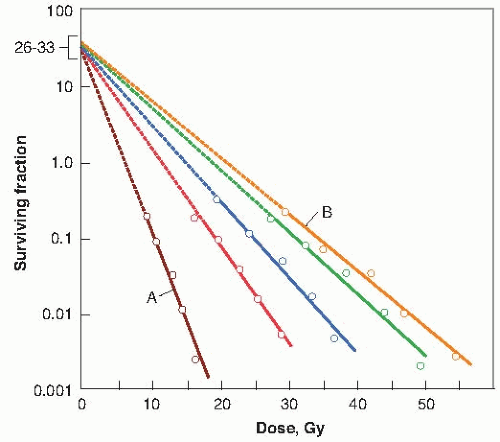 FIGURE 6.4 Survival curves for Chinese hamster cells exposed to x-rays in the presence of various oxygen concentrations. Open circles, air (A); closed circles, 2,200 ppm of oxygen or pO2 of 1.7 mm Hg; open squares, 355 ppm of oxygen or pO2 of 0.25 mm Hg; closed squares, 100 ppm of oxygen or pO2 of 0.075 mm Hg; open triangles, 10 ppm of oxygen or pO2 of 0.0075 mm Hg (B), which corresponded to the lowest level of hypoxia that could usually be obtained under experimental conditions. (Adapted from Elkind MM, Swain RW, Alescio T, et al. Oxygen, nitrogen, recovery and radiation therapy. In: Cellular Radiation Biology. Baltimore, MD: Williams & Wilkins; 1965: 442-461, with permission.) |
Other experiments have shown that, generally, by the time a concentration of oxygen corresponding to 2% has been reached, the survival curve is virtually indistinguishable from that obtained under conditions of normal aeration. Furthermore, increasing the amount of oxygen present from that characteristic of air to 100% oxygen does not further affect the slope of the curve. This has led to the more usual “textbook representation” of the variation of radiosensitivity with oxygen concentration as shown in Figure 6.5. The term used here to represent radiosensitivity is proportional to the reciprocal of the D0 of the survival curve. It is arbitrarily assigned a value of unity for anoxic conditions. As the oxygen concentration increases, the biologic material becomes progressively more sensitive to radiation, until, in the presence of 100% oxygen, it is about three times as sensitive as under complete anoxia. Note that the rapid change of radiosensitivity occurs as the partial pressure of oxygen is increased from zero to about 30 mm Hg (5% oxygen). A further increase in oxygen tension to an atmosphere of pure oxygen has
little, if any, further effect. An oxygen concentration of 0.5% (or about 3 mm Hg) results in a radiosensitivity halfway between the characteristic of hypoxia and that of fully oxygenated conditions.
little, if any, further effect. An oxygen concentration of 0.5% (or about 3 mm Hg) results in a radiosensitivity halfway between the characteristic of hypoxia and that of fully oxygenated conditions.
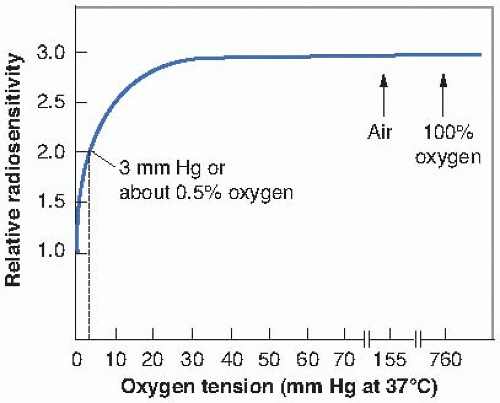 FIGURE 6.5 An idealized representation of the dependence of radiosensitivity on oxygen concentration. If the radiosensitivity under extremely anoxic conditions is arbitrarily assigned a value of unity, the relative radiosensitivity is about 3 under well-oxygenated conditions. Most of this change of sensitivity occurs as the oxygen tension increases from 0 to 30 mm Hg. A further increase of oxygen content to that characteristic of air or even pure oxygen at high pressure has little further effect. A relative radiosensitivity halfway between anoxia and full oxygenation occurs for a pO2 of about 3 mm Hg, which corresponds to a concentration of about 0.5% oxygen. This illustration is idealized and does not represent any specific experimental data. Experiments have been performed with yeast, bacteria, and mammalian cells in culture; the results conform to the general conclusions summarized here. |
It is evident, then, that very small amounts of oxygen are necessary to produce the dramatic and important oxygen effect observed with x-rays. Although it is usually assumed that the oxygen tension of most normal tissues is similar to that of venous blood or lymph (20-40 mm Hg), in fact, oxygen probe measurements indicate that the oxygen tension may vary between different tissues over a wide range from 1 to 100 mm Hg. Many tissues are therefore borderline hypoxic and contain a small proportion of cells that are radiobiologically hypoxic. This is particularly true of, for example, the liver and skeletal muscles. Even mouse skin has a small proportion of hypoxic cells that shows up as a change of slope if the survival curve is pushed to low survival levels.
▪ CHRONIC AND ACUTE HYPOXIA
It is important to recognize that hypoxia in tumors can result from two quite different mechanisms. Chronic hypoxia results from the limited diffusion distance of oxygen through tissue that is respiring. The distance to which oxygen can diffuse is largely limited by the rapid rate at which it is metabolized by respiring tumor cells. Many tumor cells may remain hypoxic for long periods. In contrast to chronic hypoxia, acute hypoxia is the result of the temporary closing of a tumor blood vessel owing to the malformed vasculature of the tumor, which lacks smooth muscle and often has an incomplete endothelial lining and basement membrane. Tumor cells are exposed to a continuum of oxygen concentrations, ranging from the highest in cells surrounding the capillaries to almost anoxic conditions in cells more distant from the capillaries. This is significant because both chronic and acute hypoxia have been shown to drive malignant progression.
Chronic Hypoxia
As already mentioned, radiotherapists began to suspect that oxygen influences the radiosensitivity of tumors in the 1930s. It was, however, a paper by Thomlinson and Gray in 1955 that triggered the tremendous interest in oxygen as a factor in radiotherapy; they described the phenomenon of chronic hypoxia that they observed in their histologic study of fresh specimens of bronchial carcinoma. Cells of the stratified squamous epithelium, normal or malignant, generally remain in contact with one another; the vascular stroma on which their nutrition depends lies in contact with the epithelium, but capillaries do not penetrate between the cells. Tumors that arise in this type of tissue often grow in solid cords that, seen in section, appear to be circular areas surrounded by stroma. The centers of large tumor areas are necrotic and are surrounded by intact tumor cells, which consequently appear as rings. Figure 6.6A, reproduced from Thomlinson and Gray, shows a transverse section of a tumor cord and is typical of areas of a tumor in which necrosis is not far advanced. Figure 6.6B shows large areas of necrosis separated from stroma by a narrow band of tumor cells about 100 µm wide.
By viewing a large number of these samples of human bronchial carcinomas, Thomlinson and Gray recognized that as the tumor cord
grows larger, the necrotic center also enlarges, so that the thickness of the sheath of viable tumor cells remains essentially constant. This is illustrated in Figure 6.7.
grows larger, the necrotic center also enlarges, so that the thickness of the sheath of viable tumor cells remains essentially constant. This is illustrated in Figure 6.7.
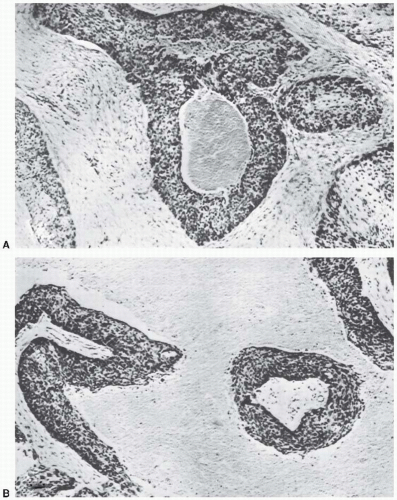 FIGURE 6.6 Transverse sections of tumor cords surrounded by stroma from human carcinoma of the bronchus. A: A typical tumor area in which necrosis is not far advanced. B: Large areas of necrosis separated from the stroma by a band of tumor cells about 100 µm wide. (From Thomlinson RH, Gray LH. The histological structure of some human lung cancers and the possible implications for radiotherapy. Br J Cancer. 1955;9:539-549, with permission.) |
The obvious conclusion was that tumor cells could proliferate and grow actively only if they were close to a supply of oxygen or nutrients from the stroma. Thomlinson and Gray then went on to calculate the distance to which oxygen could diffuse in respiring tissue and came up with a distance of about 150 µm. This was close enough to the thickness of viable tumor cords on their histologic sections for them to conclude that oxygen depletion was the principal factor leading to the development of necrotic areas in tumors. Using more appropriate values
of oxygen diffusion coefficients and consumption values, a better estimate of the distance that the oxygen can diffuse in respiring tissue is about 70 µm. This, of course, varies from the arterial to the venous end of a capillary, as illustrated in Figure 6.8.
of oxygen diffusion coefficients and consumption values, a better estimate of the distance that the oxygen can diffuse in respiring tissue is about 70 µm. This, of course, varies from the arterial to the venous end of a capillary, as illustrated in Figure 6.8.
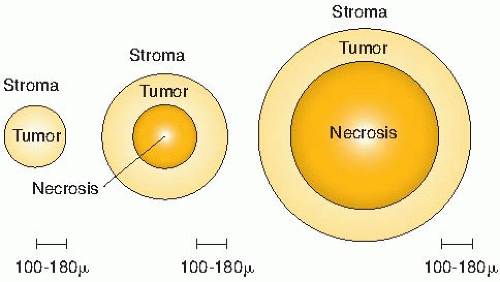 FIGURE 6.7 The conclusions reached by Thomlinson and Gray from a study of histologic sections of human bronchial carcinoma. No necrosis was seen in small tumor cords with a radius of less than about 160 µm. No tumor cord with a radius exceeding 200 µm was without a necrotic center. As the diameter of the necrotic area increased, the thickness of the sheath of viable tumor cells remained essentially constant at 100 to 180 µm. |
By histologic examination of sections, it is possible to distinguish only two classes of cells: (1) those that appear to be proliferating well and (2) those that are dead or dying. Between these two extremes, and assuming a steadily decreasing oxygen concentration, one would expect a region in which cells would be at an oxygen tension high enough for cells to be clonogenic but low enough to render the cells protected from the effect of ionizing radiation. Cells in this region would be relatively protected from a treatment with x-rays because of their low oxygen tension and could provide a focus for the subsequent regrowth of the tumor (Fig. 6.8). Based on these ideas, it was postulated that the presence of a relatively small proportion of hypoxic cells in tumors could limit the success of radiotherapy in some clinical situations.
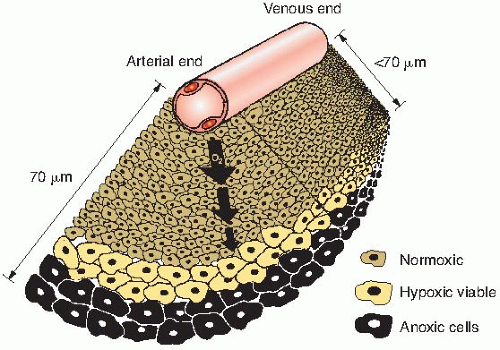 FIGURE 6.8 The diffusion of oxygen from a capillary through tumor tissue. The distance to which oxygen can diffuse is limited largely by the rapid rate at which it is metabolized by respiring tumor cells. For some distance from a capillary, tumor cells are well oxygenated (white). At greater distances, oxygen is depleted, and tumor cells become necrotic (black). Hypoxic tumor cells form a layer, perhaps one or two cells thick, in between (gray). In this region, the oxygen concentration is high enough for the cells to be viable but low enough for them to be relatively protected from the effects of x-rays. These cells may limit the radiocurability of the tumor. The distance to which oxygen can diffuse is about 70 µm at the arterial end of a capillary and less at the venous end. |
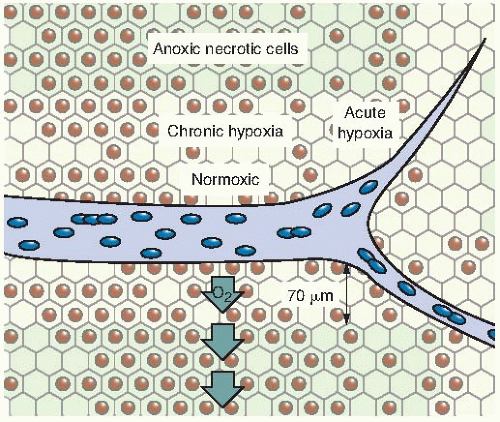 FIGURE 6.9 Diagram illustrating the difference between chronic and acute hypoxia. Chronic hypoxia results from the limited diffusion distance of oxygen in respiring tissue that is actively metabolizing oxygen. Cells that become hypoxic in this way remain hypoxic for long periods until they die and become necrotic. Acute hypoxia results from the temporary closing of tumor blood vessels. The cells are intermittently hypoxic because normoxia is restored each time the blood vessel opens up again. (Adapted from Brown JM. Tumor hypoxia, drug resistance, and metastases. J Natl Cancer Inst. 1990;82:338-339, with permission.) |
Related posts:

Stay updated, free articles. Join our Telegram channel

Full access? Get Clinical Tree


