(10.1)
The smaller numerical values of R o indicate better resolution and vice versa.
Intrinsic Resolution
Intrinsic resolution, R i , is the component of spatial resolution contributed by the detector and associated electronics, and is a measure of how well an imaging device can localize an event on the image. Intrinsic resolution arises primarily from the statistical fluctuations in pulse formation that have been discussed in the section entitled Gamma Ray Spectrometry in Chap. 8. The statistical variations in the production of light photons after γ-ray interaction in the detector and variations in the number of electrons emitted from the photocathode and dynodes in the photomultiplier (PM) tubes have significant effects on the intrinsic resolution. In gamma cameras , the X, Y positioning of the pulses is improved by increasing the number of PM tubes, thus improving the intrinsic resolution. Also, PM tubes with greater quantum efficiency and their improved optical coupling to the detector for greater light collection provide better intrinsic resolution.
Intrinsic resolution improves with higher γ-ray energy and deteriorates with lower energy because greater statistical fluctuations occur in the production of light photons by lower energy photons and vice versa. For example, the 140-keV photons of 99mTc produce almost twice as many light photons in the detector as the 69- to 80-keV photons of 201Tl and thus result in better intrinsic resolution. However, there is little improvement in intrinsic resolution with photon energy above 250 keV because of multiple scattering of photons within the detector that can result in photoelectric absorption (see below). Intrinsic resolution improves with narrow PHA window settings , because scattered radiations are avoided.
Multiple Compton scattering of a γ-ray photon followed by absorption of all scattered photons in the detector causes uncertainty in the X, Y location of the original γ-ray interaction and makes the intrinsic resolution, and hence spatial resolution, worse. This effect is worse with thicker detectors and high-energy photons (> 250 keV) because of the increased chances of multiple scattering. For this reason, thinner detectors (0.63–1.84 cm) are used in gamma cameras.
Most modern cameras have intrinsic resolution of the order of 4-mm full width at half maximum (FWHM) for 140-keV photons of 99mTc.
Collimator Resolution
Collimator resolution, also termed the geometric resolution (R g ), constitutes the major part of the overall spatial resolution and primarily arises from the collimator design. In general, collimator resolution is worse than intrinsic resolution . As already mentioned in Chap. 9, there are four major collimators: parallel-hole, pinhole, converging, and diverging. Of these, parallel-hole collimators are most commonly used in nuclear medicine.
The different parameters of a typical parallel-hole collimator are shown in Fig. 10.1. The spatial resolution for this collimator is given by the geometric radius of acceptance, R g :
Fig. 10.1
A parallel-hole collimator with thickness t, hole diameter d, septal thickness a, and source-to-collimator distance b. The collimator is attached to a detector whose midplane is at a distance c from the back surface of the collimator. R g is the collimator resolution.
(10.2)
where d is the hole diameter of the collimator, b is the distance between the collimator face and the source of radiation, c is the distance between the back face of the collimator and the midplane of the detector, and t e is the effective length of the collimator holes. The t e is empirically given by t e = t − 2µ −1, where µ is the linear attenuation coefficient of the photons in the collimator material (e.g., lead), and t is the length or thickness of the collimator hole. This corrects for the penetration of the two corners of the holes by the photons.
As seen from Eq. (10.2), the collimator resolution is improved by increasing the length, t, of the collimator holes or by decreasing the diameter, d, of the holes. Thus, long narrow holes provide better spatial resolution. Also, the collimator resolution deteriorates with increasing source-to-collimator distance, b, and is best at the collimator face. Therefore, in nuclear medicine studies, patients should be placed as close to the collimator as possible to provide the best resolution. The effects of various features of parallel-hole collimators on spatial resolution and sensitivity are summarized in Table 10.1.
Table 10.1
Effect of various features of parallel-hole collimators on their performance.
Increasing | Resolution | Sensitivity |
|---|---|---|
Number of holes | ↔ | ↑ |
Hole diameter | ↓ | ↑ |
Hole length | ↑ | ↓ |
Septal thickness | ↑ | ↓ |
Source-to-collimator distance | ↓ | ↔ |
The thickness a between the holes is called the septum. Septal penetration of γ-rays plays an important role in the collimator resolution . High energy photons from outside the field of view can cross the septum and yet interact in the detector, thus obscuring the image. In the collimator design, a primary consideration is to have negligible penetration by these extraneous photons from one hole to the adjacent one. However, it is practically impossible to stop all photons from penetration with any reasonable amount of material without substantial loss of counting efficiency. As a trade-off between penetration and collimator efficiency, a compromise value of 5 % penetration is accepted, and the minimum septal thickness of a parallel-hole collimator can be calculated as
Table 10.2
Various parallel-hole collimators and their features and properties.a
Collimator type | Hole diameter (mm) | Hole length (mm) | Septal thickness (mm) | Geometric resolutionb (mm) | Sensitivity (cpm/μCl) | Optimum energy (keV) |
|---|---|---|---|---|---|---|
Low energy all purpose (LEAP) | 1.43 | 23.6 | 0.2 | 9.1 | 360 | ~ 140 |
Low energy high resolution (LEHR) | 1.11 | 23.6 | 0.3 | 7.5 | 230 | ~ 140 |
Medium energy | 3.02 | 40.6 | 1.1–1.4 | 12.1 | 288 | ~ 280 |
High energy | 4.32 | 62.8 | 1.3–3.0 | 13.8 | 176 | ~ 360 |
Ultra high energy | 3.4 | 75.0 | 3.0–4.0 | 10.4 | 60 | ~ 511 |
In another classification, collimators are termed high sensitivity and high resolution collimators. Often, these collimators are made with an identical number of holes with identical diameters, but with different thicknesses. Therefore, the high resolution collimators are made with longer holes and the high sensitivity collimators with shorter holes. The spatial resolution for the high sensitivity collimator deteriorates sharply with the source-to-collimator distance. Low energy all purpose (LEAP) collimators are designed with intermediate values of resolution and sensitivity.
The geometric resolution for pinhole, diverging and converging collimators is expressed by similar but somewhat complex equations, and their details are available from reference books on nuclear physics and instrumentation. In the case of pinhole collimators , the image is magnified and the magnification depends on the ratio of the hole-detector distance to the hole-object distance. The resolution varies over the area of the object along with distortion of the image and the sensitivity falls off with increasing distance from the collimator face. For converging collimators , the image is magnified and the magnification increases with the distance from the collimator face resulting in the deterioration of resolution and an increase in sensitivity, but the image is distorted. For diverging collimators , the situation is opposite to that of the converging collimators. Having the collimator holes diverging away from the detector results in minification of the object to fit into a smaller detector. So distortion occurs, and resolution and sensitivity vary over the object. The fan beam collimator is basically a converging collimator and commonly used for cardiac and brain imaging. It gives better spatial resolution with poorer sensitivity than parallel-hole collimators. The overall system resolutions with different collimators are illustrated in Fig. 10.2.
Fig. 10.2
Effect of source-to-collimator distance on overall system resolution for various types of collimators. (A) High sensitivity parallel-hole. (B) Diverging. (C) All purpose parallel-hole. (D) Converging. (E) High resolution parallel-hole. (F) Pinhole. (From Rollo FD, Harris CC. Factors affecting image formation. In: Rollo FD, ed. Nuclear Medicine Physics. Instrumentation and Agents. St. Louis: Mosby; 1977. 407. Modified from Moyer RA. J Nucl Med 1974, 15:59.)
Scatter Resolution
Radiations are scattered by interaction with tissue in patients and with the detector. It is possible that some of these radiations are scattered without much loss of energy and fall within the field of view, resulting in pulses of amplitude acceptable within the window set by pulse-height analyzer (PHA). This degrades the overall spatial resolution . This component is called the scatter resolution (R s ) and depends on the composition of the scattering medium, the source configuration, and PHA discriminator settings. Scatter increases in heavy patients, and decreasing the PHA window reduces the scatter contribution. The effect of scatter resolution is essentially the same for all collimators (Rollo and Harris 1977) .
Evaluation of Spatial Resolution
Bar Phantom
Qualitative evaluation of the spatial resolution of an imaging device can be made by visual inspection of the images obtained using bar phantoms . Bar phantoms consist of four sets of parallel lead bar strips arranged perpendicular to each other in four quadrants in a lucite holder (Fig. 10.3). The widths and spacings of the strips are the same within each quadrant but differ in different quadrants. In all bar phantoms , the thickness of lead should be sufficient to stop photons of a given energy for which spatial resolution is being estimated.
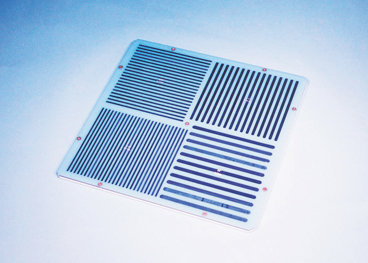
Fig. 10.3
A typical rectangular bar phantom (Courtesy of Biodex Medical Systems, Inc. Shirely, NY).
The bar phantom is placed over the detector of a gamma camera. A 57Co flood source (described later under Quality Control) is placed on the top of it and an image is taken. For evaluation of spatial resolution for different photon energies, flood sources of radiations of respective energies should be used. The image of the bar phantom obtained is visually inspected, and spatial resolution is estimated from the smallest strips or spacings distinguishable on the image (Fig. 10.4). Images also can be taken by placing the source of activity at different distances from the collimator to see the changes in spatial resolution with distance (Fig. 10.5). Obviously, this technique is qualitative and does not give a quantitative measure of the spatial resolution.
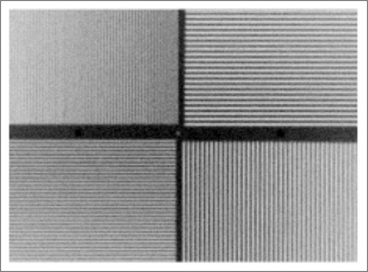
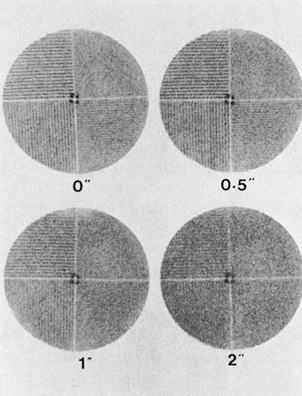
Fig. 10.4
Rectangular bar phantom image obtained using a parallel-hole collimator.
Fig. 10.5
Bar phantom images at different distances from a parallel-hole collimator.
Line-Spread Function
A quantitative method of estimating spatial resolution of a gamma camera is based on the use of a line-spread-function (LSF) . A long plastic tubing with a radioactive solution (e.g. 99mTc) is placed in the field of view at a distance from the detector fitted with a collimator. The gamma camera interfaced with a computer collects and stores the counts (responses) from the line source in a single view, and the computer generates a bell-shaped LSF by plotting the counts at distances from the center of the FOV along the tubing (Fig. 10.6). It shows a distribution of activity with a minimum at the edge of the FOV increasing to a maximum at the center. The FWHM of the LSF gives the spatial resolution of the gamma camera. Similar LSFs can be obtained at different distances from the detector as well as in different media as shown in Figure 10.6. It can be seen that the spatial resolution of a gamma camera deteriorates with increasing source-to detector distance and increasing density of the medium e.g. air versus water. Thus spatial resolution is degraded in patient imaging due to attenuation of photons in body tissues.
Fig. 10.6
Line spread function of a gamma camera equipped with a low-energy all-purpose parallel-hole collimator obtained in a air and b water at different distances using a 99mTc-line source. Note that the resolution deteriorates in water due to attenuation.
Spatial resolution by the LSF method varies with the design of the collimator and is, therefore, different for parallel-hole, converging, and diverging collimators . Also, the FWHM values of the LSF may not represent the true spatial resolution, because the scatter and septal penetration components fall in the tail part of the LSF (i.e., below 50 %) and therefore are not accounted for.
Modulation Transfer Function
A more complete and quantitative assessment of spatial resolution of imaging devices is made by using modulation transfer function (MTF) (Rollo 1977). The concept of MTF is illustrated in Fig. 10.7. Suppose a source of activity (e.g., a patient) has a sinusoidal distribution with peaks (maximum activity, A max) and valleys (minimum activity, A min), as illustrated in Fig. 10.7. Such a distribution gives a spatial frequency (ν) in cycles per centimeter or cycles per millimeter. The contrast, or modulation (M s ), in the source activity is given by
Fig. 10.7
An illustration of the principles of modulation transfer function (MTF) of an imaging system. See text for details.
(10.4)
If a perfect imaging device were to image the source faithfully, it would depict the same distribution of activity in the image with A max and A min as in the source activity. Because the imaging devices are not absolutely perfect, it will portray the distribution of activity in the image with C max for the peak and C min for the valley, which are smaller in magnitude than A max and A min. The modulation in the image (Mi) is then expressed by
(10.5)
The MTF at a spatial frequency ν is then calculated as the ratio of M i to M s :
(10.6)
When M s = M i , MTF = 1. This is true if the sinusoidal cycles are well separated and if the imaging device reproduces the image of each cycle faithfully. Thus, the system with MTF = 1 gives the best overall spatial resolution. When the distribution of activity is such that spatial frequency increases, the peaks and valleys come closer. When the peaks and valleys are too close, the imaging device cannot delineate them, and the MTF tends to 0, yielding the poorest spatial resolution of the system. The values of the MTF between 0 and 1 give intermediate spatial resolutions. It is important to note that small objects are better imaged at higher frequencies and large objects at lower frequencies.
It has been demonstrated that the MTF is a normalized Fourier transform of the LSF discussed previously. In practice, the source activity distribution is assumed to be composed of line sources separated by infinitesimal distances, and the MTFs are then calculated from the LSFs of all line sources . The mathematical expression of these functions is quite complex and can be found in reference physics books.
Plots of the MTFs against spatial frequencies are useful in determining the overall spatial resolution of imaging devices and are presented in Fig. 10.8 for three imaging systems. It is seen that, at very low frequencies (i.e., larger separation of sinusoidal cycles), the MTFs are almost unity for all three systems; that is, they reproduce equally good images of the radiation source. At higher frequencies (i.e., sinusoidal cycles are too close), system A in Fig. 10.8 gives the best resolution, followed in order by system B and system C.