Perfusion and Dynamic Contrast-Enhanced Imaging in Hemorrhage
Didem Aksoy
Andrea Kassner
Jason Hom
Karen Hirsch
Christine Wijman
Chitra Venkatasubramanian
Primary intracerebral hemorrhage (ICH) accounts for 10% to 15% of strokes and is associated with significant mortality and poor functional outcome.1,2 About one-third of all ICH expand and continue to grow within the first 6 hours after symptom onset.3 Hematoma size is an independent predictor of poor outcome. In addition, secondary perihematomal neuronal injury occurs from inflammation incited by blood-derived products, such as thrombin and iron, leading to vasogenic and cytotoxic edema.4,5 This, in addition to hematoma expansion, could contribute to the poor outcome attributed to ICH.6 Currently, there is no therapy for prevention of hematoma expansion or for preventing or attenuating perihematomal injury.
Elevated blood pressure (BP) in the setting of acute ICH is very common, with more than 75% of patients presenting with high BP.7 Blood pressure reduction as a means of attenuating ICH expansion has been considered for many years.8 Although early animal models suggested perihematomal and ipsilateral cerebral blood flow (CBF) reduction to ischemic thresholds for several hours,9 this was not replicated in subsequent animal models that are thought to be more representative of human ICH evolution, even after modest drops in systemic BP.10,11 Further work using xenon computed tomography (CT) and single-photon emission CT showed that although there was a decrease in regional CBF,12 CBF reduction lasted for only a few days with subsequent normalization. This transient drop in regional CBF is thought to be due to perihematomal mitochondrial dysfunction, leading to decreased metabolic demand.13,14 Based on these studies, the existence of an ischemic perihematomal penumbra was highly debated and current guidelines recommend that moderate BP reduction (mean arterial pressure of <110 mm Hg or a systolic blood pressure [SBP] of <160 mm Hg) in the acute phase after ICH is safe.15 It is unclear, however, if more aggressive BP reduction in acute ICH (as is being studied in two large randomized controlled trials) will lower regional CBF and aggravate perihematomal hypoperfusion.16,17
In the past decade, diffusion-weighted imaging (DWI) and perfusion-weighted imaging (PWI) magnetic resonance imaging (MRI) methods have undergone significant improvement, and there is increasing clinical usage of MRI in acute ICH.18 Similarly, CT perfusion (CTP) is also being used clinically to study brain perfusion in acute ICH, particularly after BP reduction acutely.19 These techniques hold the promise of ushering in a new era in ICH diagnosis and management. This chapter will summarize the current state of knowledge regarding cerebral perfusion in acute ICH, using MRI perfusion (PWI) and CTP.
Perfusion-Weighted Imaging in Intracerebral Hemorrhage
In order to obtain perfusion images, T2-weighted echo-planar images are obtained during and after rapid contrast agent injection with a power injector. Signal loss in the tissue as the contrast agent passes through is recorded via serial images.20 Perfusion maps of CBF, cerebral blood volume (CBV), mean transit time (MTT), and the time until the residue function reaches its peak (Tmax) are constructed by deconvolution of tissue and arterial signals.
Studies investigating perfusion in the perihematomal region have produced inconsistent results. Some of the initial studies did not find any significant hypoperfusion in the perihematomal region.21,22,23 Powers et al.21 studied 14 patients with small and medium-sized ICH in the first 6 to 22 hours before and after reduction of mean arterial pressure by 15%. They found that global and perihematomal CBF was preserved after modest BP reduction and concluded that autoregulation was preserved. Kidwell et al.22 imaged six patients in the hyperacute phase (<6 hours) after ICH onset with PWI and DWI. Ipsilateral hemispheric hypoperfusion was present in five of six patients, but no decreased blood flow was observed in the perihematomal region. One of the six patients had a significant rim of decreased apparent diffusion constant (ADC) and the hemispheric hypoperfusion differences were most pronounced in this patient, who also had a poor outcome. In a study with 32 patients, Schellinger et al.23 did not find any significant perihemorrhagic ADC or MTT changes in the hyperacute stage after ICH in the overall cohort; a subset of patients who had more prolonged perihematomal MTT delay and reduced ADC had worse outcomes at 90 days after ICH.24
However, these studies had several limitations in their methodology. All of them studied fairly small cohorts with predominantly small to medium-sized ICH and had considerable variability in time to imaging.
Further, they all used a predefined 1-cm perihematomal ring to assess regional perfusion. By applying this predefined 1-cm region of interest (ROI) to hemorrhages of all sizes, it is quite likely that normal brain tissue was included in the perfusion measurements, particularly when the underlying ICH was small. It is quite possible that due to this technical issue, the actual perfusion abnormalities (as described later in this chapter and in more recent studies) were masked.25,26,27 Other limitations in the early PWI studies include possible failure to meticulously exclude any blood products from the perihematomal ROI. As it is well known, MRI is highly sensitive to hemoglobin and its byproducts, and failure to exclude them can cause incorrect measurements and misinterpretation of the data.
Further, they all used a predefined 1-cm perihematomal ring to assess regional perfusion. By applying this predefined 1-cm region of interest (ROI) to hemorrhages of all sizes, it is quite likely that normal brain tissue was included in the perfusion measurements, particularly when the underlying ICH was small. It is quite possible that due to this technical issue, the actual perfusion abnormalities (as described later in this chapter and in more recent studies) were masked.25,26,27 Other limitations in the early PWI studies include possible failure to meticulously exclude any blood products from the perihematomal ROI. As it is well known, MRI is highly sensitive to hemoglobin and its byproducts, and failure to exclude them can cause incorrect measurements and misinterpretation of the data.
In recent years, as PWI and DWI techniques have improved and larger hematoma volumes were examined, more perfusion and diffusion abnormalities have been reported in the perihematomal region. Butcher et al.28 imaged 21 patients within 110 hours after symptom onset. These authors presented perfusion values relative to contralateral homologous regions, such as relative MTT (rMTT). Despite using a predefined 1-cm perihematomal ring ROI, prolonged rMTT and decreased regional CBF (rCBF) compared with contralateral homologous tissue was observed. No significant changes were found in relative CBF (rCBV). Hypoperfusion normalized spontaneously by 3 to 5 days after symptom onset.28 Pascual et al.29 reported hypoperfusion in the perihematomal region in 18 ICH patients who were imaged within 24 hours of symptom onset. Significantly prolonged MTT was measured at the perihematomal rim compared with the contralateral side. Follow-up scans were done at 1 and 2 weeks. Hypoperfusion completely normalized after the first week. Hypoperfusion was correlated with National Institutes of Health Stroke Scale scores at discharge but was not correlated to hematoma volume. Zhao et al.30 imaged 35 patients with subacute ICH (2 to 28 days) with a 3T MRI and found decreased rCBV and MTT, particularly in larger ICH during the first 2 to 4 days. Such decreases were linearly correlated with relative perihematomal edema volume.
Olivot et al.18 studied 20 patients in the first few days after ICH by using fluid-attenuated inversion recovery (FLAIR) images to generate the perihematomal ROI that included only perihematomal tissue. The ROI was transferred to coregistered perfusion maps and a mean Tmax value for the ROI was calculated. A diffusion lesion was defined as an area that was hyperintense on b = 1000 DWI images and hypointense on ADC maps after excluding any blood on the corresponding gradient-recalled echo (GRE) or FLAIR slices. Presence of diffusion lesions in the perihematomal region was evaluated. They found prolonged Tmax (4.7 to 7.2 seconds) in the perihematomal ROI as compared with the contralateral mirror ROI, particularly in those that were scanned less than 24 hours after ICH onset and in those with larger ICH. Furthermore, patchy areas of restricted diffusion in the perihematomal region were observed, although it did not correlate with the degree of Tmax delay.
In a more recent study of 33 patients imaged within 24 hours, using the above-mentioned methodology, 52% had perihematomal hypoperfusion. This was most pronounced in those who had aggressive BP lowering (i.e., ≥30% of SBP drop from admission, absolute SBP reductions ≥60 mm Hg) and was seen as significantly prolonged Tmax (7.8 seconds) delays. Further, 82% of those with Tmax greater than 6 seconds and all of those with SBP reduction of 30% or more had perihematomal restricted diffusion. Again, those with large ICH had higher Tmax delays.31,32 Emerging evidence also suggests an association between aggressive BP lowering and the presence of post-ICH ischemic injury remote from the actual hematoma. Garg et al.33 found that greater BP reduction from admission to 24 hours was associated with ischemic lesions in a cohort of 95 ICH patients. They suggested a ceiling of 40 mm Hg SBP and 25 mm Hg diastolic BP reduction limit (Figs. 47.1 and 47.2).
While interpreting perfusion data in ICH, the limitations of PWI need to be kept in mind. Perfusion parameters are not well compared to a gold standard like positron emission tomography. Acquired parameters are semiquantitative (relative) measures, and calculations are dependent on arterial input function selection. In cases of ICH imaging, paramagnetic properties of hemoglobin and blood products might introduce susceptibility artifacts. ICH patients, especially in the hyperacute phase, might be more challenging to image with MRI because scan times are relatively long and patient motion decrements image quality. Finally, the definition of ischemic perfusion thresholds based on Tmax and MTT is extrapolated from the ischemic stroke literature and may not be the right thresholds for detecting clinically significant perihematomal ischemia.
In summary, as MRI methodologies have advanced and more hyperacute or acute ICH imaging is being performed, it is becoming evident that there is variability in regional cerebral perfusion among ICH patients. Those with small and moderate-sized ICH may not have any clinically significant hypoperfusion. Similarly, perihematomal hypoperfusion may not be detected if imaged late. However, there does indeed appear to be a subset of patients in whom there exists significant perihematomal hypoperfusion (i.e., those imaged very early and those with large ICH). Aggressive BP reduction seems to aggravate this hypoperfusion and is associated with perihematomal ischemic injury. In the era of aggressive BP lowering, one size may not fit all. Using PWI or DWI, future research is warranted to determine who will benefit and who will be harmed by BP lowering in acute ICH.
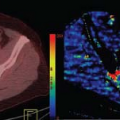
 FIGURE 47.1. A 52-year-old man was transported to a local emergency room with confusion and left-sided weakness. Blood pressure on initial evaluation in the emergency room was 240/130, and a noncontrast head computed tomography revealed a right temporal intraparenchymal hemorrhage. The patient was intubated for poor neurologic status. His medical history was notable for polysubstance abuse including methamphetamine use. In the setting of using intravenous antihypertensive medication and intravenous sedation with propofol needed for patient safety after intubation, the blood pressure dropped to 120/80. The patient was transferred to a tertiary care hospital. (A) Gradient echo (GRE) magnetic resonance imaging (MRI) sequences show a large right temporal hemorrhage, and contrast-based perfusion imaging shows Tmax (time to maximum) delay throughout the hemisphere ipsilateral to the hemorrhage and in the contralateral hemisphere watershed zones. (B) GRE MRI sequences show a lobar hemorrhage, and contrast-based perfusion imaging shows high Tmax in the perihematomal region, throughout the hemisphere ipsilateral to the hemorrhage, and in the contralateral hemisphere. |
 FIGURE 47.2. A 36-year-old man with no significant medical history presented to the emergency room with the acute onset of severe headache, dizziness, imbalance, nausea, and vomiting. His neurologic status deteriorated in the emergency room and he had a witnessed seizure that started with left upper extremity tonic-clonic movements but quickly progressed to a generalized tonic-clonic seizure. He was intubated and treated with intravenous benzodiazepines. Noncontrast head computed tomography showed a right parafalcine intraparenchymal hemorrhage. (A) gradient echo (GRE) magnetic resonance imaging sequences show an irregular appearing right parafalcine hemorrhage, (B) contrast-enhanced MR angiography demonstrates a large arteriovenous malformation with deep venous drainage involving the cortex, with nidus measuring approximately 4 cm, and a large right fetal posterior cerebral artery that is suggested to be a possible feeding vessel, and (C) arterial spin labeling (ASL) perfusion imaging suggesting drainage of the arteriovenous malformation through the left transverse sinus (arrow). COW, circle of Willis; CBF, cerebral blood flow. |
Computed Tomography Perfusion in Intracerebral Hemorrhage
CT perfusion is another modality that has been used to investigate cerebral perfusion in acute ICH, including its response to BP lowering. Patients with ICH are often unstable and critically ill and cannot tolerate long scan times in an MRI. Further, sophisticated MR perfusion technology is available only at a limited number of specialized stroke centers, making CTP a much more attractive modality. CTP imaging in ICH has additional advantages, such as high spatial resolution and freedom from susceptibility artifacts due to paramagnetic effects of blood and blood products, while assessing perihematomal regional perfusion.26 Finally, as discussed later in this chapter, the source images in CTP acquisition are also quite sensitive in detecting ongoing bleeding sites in the hematoma, the so-called spot signs, and therefore serve dual purposes.
CTP is the acquisition of dynamic images from slices placed at the hematoma level following the injection of contrast material via a power injector. Change of contrast enhancement in the artery and brain tissue is obtained via acquisition of repeated images over time (usually one image per second for ∼60 seconds). Perfusion maps are generated by deconvolution of tissue and arterial signals.
In one of the earliest studies to assess the feasibility of CTP in acute ICH patients within 24 hours, Rosand et al.25 measured perfusion (on a single slice through the maximal area of the hematoma) in serially expanding 2-mm rings around the hematoma in five patients. Reduced perihematomal perfusion was observed in all patients, most severe immediately adjacent to hematoma. Perfusion improved beyond 4 to 6 mm from the hematoma, creating a gradient of hypoperfusion. Moreover, the severity of perfusion deficit was negatively correlated with time after symptom onset. These authors concluded that risk for ischemia is greatest within the first hours of ICH onset, precisely during the time during which acute BP lowering is carried out in an effort to limit hematoma expansion.
This was followed by a study by Herweh et al.34 who conducted two CTP studies in ICH. In one, they performed CTP in 17 patients with relatively small hematomas within 3 hours of symptom onset. They manually outlined the perihematomal area based on visual assessment of the zone of reduced CBF around the hematoma and found significantly reduced perfusion in this area as measured by CBF, CBV, and time to peak compared with the contralateral hemisphere. The size of the zone of reduced perfusion was correlated with hematoma size but not with edema. In another study of 36 patients imaged within 24 hours, they also found a zone of perihematomal hypoperfusion and its severity was correlated with hematoma volume. In a subgroup of eight patients who were serially imaged over the first week after ICH, they noted that the size of the perihematomal hypoperfused zone remained unchanged and perfusion parameters normalized over time, but that there was continued perihematomal edema growth. Based on the temporal dissociation between rCBF and edema growth, they concluded that it was unlikely that the hypoperfusion caused ischemic cell damage with cytotoxic edema, because if that were the case, there should have been temporal concordance between the behavior of the volumes of the hypoperfused zone and the edematous areas.26 Instead, they agreed with the positron emission tomography study from Zazulia et al.14 that the hypoperfusion was as a result of decreased oxygen and metabolic demand (i.e., diaschisis) from injured and inflamed perihematomal tissue.
Fainardi et al.27 imaged 89 patients, 23 of whom were in the hyperacute phase (within 6 hours) after symptom onset. Four regions were analyzed for perfusion changes with rCBF, rCBV, and MTT: hemorrhagic core, perihematomal low density rim, 1-cm wide normal appearing tissue surrounding the perihematomal zone and a contralateral mirror ROI similar to the entirety of the above three areas. rCBF and rCBV were significantly lower and rMTT was prolonged in both the hemorrhagic core and the perihematomal rim when compared with other regions. Using a combination of rCBF, rCBV, and rMTT values, the perfusion status of an area was classified into ischemic, penumbral, oligemic, or normal. The dominant profile was ischemia in the hemorrhagic core, oligemia in the perihematomal rim, and hyperemia in the normal appearing rim and contralateral ROI. Based on this, these authors concluded that in the majority of their cohort, there was no evidence for a perihematomal penumbral zone. They did, however, note that the perihematomal hypoperfusion was more pronounced in ICH that was hyperacute, large (>20 mL) ICH, or lobar in location. In about 13% of their cohort, particularly in the hyperacute group, they did find perihematomal ischemic penumbras that were destined to go on to infarct. However, they did not have any longitudinal follow-up on these patients to evaluate if that was indeed the case.
More recently, studies have been conducted using CTP to determine the effects of acute BP lowering and surgical removal of ICH on perihematomal hypoperfusion. Etminan et al.35 studied 20 lobar ICH patients with fairly large hematomas (mean 69 cc), imaging them with CTP before and within 6 hours after clot evacuation. Perfusion was significantly impaired—defined by increased Tmax, decreased CBF, and decreased CBV—in the perihematomal region compared with ipsilateral hemisphere and contralateral mirror ROI regions prior to surgery, and this was correlated with hematoma size. After clot evacuation, perfusion improved around the hematoma such that there remained no difference between any of the ROIs. These authors proposed that
the early reduction observed in Tmax values might be due to decreased local pressure following clot removal.
the early reduction observed in Tmax values might be due to decreased local pressure following clot removal.
Butcher et al.,19 in the ICH-ADAPT (the IntraCerebral Hemorrhage Acutely Decreasing Arterial Pressure Trial), used CTP to determine the state of perihematomal perfusion in response to aggressive BP lowering to either SBP less than 150 mm Hg versus less than 180 mm Hg in the first 24 hours in small to moderate-sized ICH. Prior to BP reduction, perihematomal CBF was lower than in the homologous contralateral regions; however, the absolute reduction in CBF was quite small (∼5 mL/100 g) and did not reach conventionally accepted ischemic thresholds. After BP reduction, the two treatment groups did not differ in perihematomal rCBF even after adjustment for hematoma volume and time to randomization. The 3-month neurologic outcomes were also not different. They did, however, find modest reductions in ipsilateral hemispheric CBF. Limitations of this study include a paucity of patients with less than 30-cc ICH, patients who were imaged at less than 3 hours, multiple CT scanners used to acquire data, and exclusion of unstable patients and those with renal disease (who were more likely to have advanced hypertensive arteriopathy). Although this study does give some reassurance about aggressive BP reduction not aggravating perihematomal hypoperfusion to ischemic levels in small to moderate-sized ICH, it still does not exclude the possibility that there is a subset of patients who will be harmed by excessive BP lowering by aggravating perihematomal ischemia.
Limitations of CTP include inadequate coverage of the entire hematoma due to limited slices, radiation exposure, and potential patient sensitivity to contrast material. Other limitations of CTP are similar to PWI due to bolus injection. Delay, dispersion, and partial volume effects may affect the quantification of perfusion parameters.36 Finally, interpretation of CTP parameters may vary depending on the type of CT scanner and perfusion software used. Despite the above limitations, CTP is fast emerging as a useful modality in acute ICH imaging and may in the future be used to objectively determine how aggressively BP lowering should be in any particular patient based on regional perfusion characteristics.
Computed Tomography Angiography, Postcontrast Computed Tomography, Computed Tomography Perfusion Spot Sign
One of the key factors associated with the acute neurologic deterioration and poor short-term neurologic outcome from ICH is the size of the hematoma.37,38,39 Hematoma expansion is fairly common and occurs due to ongoing oozing from one or (more likely) several small vessels in the area of the ICH. About a third of patients with acute ICH undergo substantial hematoma expansion of more than 33% and most of this occurs within the first 6 hours after ICH.3 Although no definitive therapy for attenuation or prevention of ICH expansion is yet available, the identification of patients who are likely to have hematoma expansion is critical for several reasons: (a) for effective triaging, (b) perhaps more aggressive BP lowering, (c) urgent reversal of any ongoing coagulopathy, and (d) patient selection into acute ICH trials.
The spot sign was first described (as is defined today) by Wada et al.40 on CT angiography (CTA) in 2007 as a focal region of active contrast extravasation. These authors imaged 39 patients with ICH onset of less than 3 hours using CTA. They noted one or many foci of pooling of contrast within the hematoma, typically near the periphery of the ICH. There was a high interobserver agreement in detection of these areas. In their cohort, the presence of the spot sign was an independent predictor of substantial hematoma expansion of more than 30% or greater than 6 mL. Also, those with a spot sign had longer hospital stays and worse functional outcomes. These authors concluded that the “spots” represented active hemorrhage from secondarily sheared or torn perforators, leading to hematoma expansion (Fig. 47.3).
This was followed by a study by Ederies et al.41 who, in a retrospective study of 61 patients with primary ICH imaged at less than 6 hours, described the presence of contrast leakage on postcontrast CT (PCL), including those who had a negative CTA spot sign. Again, those with PCL had more absolute and relative hematoma growth. The inclusion of PCL with CTA spot sign increased the sensitivity (0.94) and negative predictive value (0.97) for hematoma expansion.
Delgado Almandoz et al.42 then introduced a spot sign score calculated by the presence of three or more spot signs, maximum axial dimension of a spot of 5 mm or more, and maximum attenuation of 180 H or more. These authors demonstrated this spot sign score to be the strongest factor for significant hematoma growth in primary ICH, independent of time from ictus to CT evaluation. In a later study of 573 patients, Delgado Almandoz et al.43 found the spot sign score to be an independent predictor of in-hospital mortality and poor outcome at 3 months in survivors. Romero et al.,44 in their CTA study, concluded that those who had a spot sign were more likely to have a faster growth rate of ICH compared with those without (2.8 mL/hr vs. 0.2 mL/hr) and this predicted mortality.
Demchuk et al.,45 in the multicenter observational prospective PREDICT (PREDIcting hematoma growth and outcome in Intracerebral hemorrhage using contrast bolus CT) study, further validated the CTA spot sign in a cohort study of 268 patients imaged at less than 6 hours from onset. They confirmed the observations from the prior single center studies described above and concluded that the CTA spot sign was indeed an independent predictor for significant hematoma expansion and poor 3-month functional outcome in survivors. Even in patients imaged at greater than 6 hours after ICH onset
and in those with unknown time of ICH onset, Brouwers et al.46 found that the CTA spot sign retained a high accuracy in predicting further hematoma expansion.
and in those with unknown time of ICH onset, Brouwers et al.46 found that the CTA spot sign retained a high accuracy in predicting further hematoma expansion.
 FIGURE 47.3. A 55-year-old man with end-stage hepatic failure from hepatitis C was hospitalized for hepatic encephalopathy when he was noted by nursing to have a further decline in neurologic status and new right-sided weakness. A “stroke code” was called and (A) noncontrast head computed tomography (CT) showed a left frontal intraparenchymal hemorrhage. (B) Postcontrast head CT images show a “spot sign” (arrow) within the hemorrhage consistent with contrast extravasation and suggestive of ongoing active bleeding. The patient’s coagulopathy and thrombocytopenia were treated with factor 8, fresh frozen plasma, and platelet transfusions. Despite ongoing aggressive management, his clinical status continued to deteriorate, necessitating intubation. (C) A follow-up noncontrast head CT obtained 4 hours after the initial scan showed expansion of the hemorrhage. The hemorrhage had also progressed to include an intraventricular component and there was worsening mass effect and midline shift. CTP, computed tomography perfusion. |
It should be noted that visualization of spot signs is dependent on CTA parameters, which might vary considerably among different scans and institutions. Delayed images following CTA and postcontrast CT images have been reported to increase the success in detecting spot signs. Koculym et al.47 compared CTA, CTP, and postcontrast CT spot signs in 28 patients presenting within 6 hours of symptom onset. CTP spot sign not only was an independent predictor of hematoma expansion and poor clinical outcome, but it was also associated with final hematoma volume, in-hospital mortality, and had the greatest sensitivity for spot detection among the three methods. Spots on CTP appeared later than CTA but earlier than postcontrast CT. Maximum number of spots was detected by CTP at 50 seconds after bolus injection.
One of the main limitations of the CTA spot sign is that the CTA source image provides enhancement only in the arterial phase and can miss delayed contrast leakage. Acquisition of delayed images is uncommon and factors such as contrast agent concentration and scanner speed still affect sensitivity considerably.48 Furthermore, individual characteristics such as BP, perihematomal tissue pressure, and circulation time make it challenging to determine an optimal window to image the CTA spot sign. on the other hand, CTP source images may provide a longer time window for spot detection as it covers all phases of the circulation along with the possibility of reducing temporal resolution. Higher temporal resolution is not necessary for spot detection, and lower temporal resolution will decrease radiation dose significantly compared with the other two modalities.47 Sun et al.49 demonstrated the utility of CTP spot sign in 112 patients imaged within 6 hours using CTA and CTP source images. Although both CTA and CTP spot signs were predictive of hematoma expansion, CTP spot sign had a higher predictive value and was present even in patients who had a negative CTA spot sign.
Related posts:


Stay updated, free articles. Join our Telegram channel

Full access? Get Clinical Tree


