Perfusion and Dynamic Contrast-Enhanced Imaging in White Matter Disease
Matilde Inglese
Jens Würfel
Glyn Johnson
The white matter of the brain is affected by many disease processes that can be categorized in demyelinating and dysmyelinating disorders.1 The former are caused by loss of myelin in previously normal white matter, and the latter are a result of failure to form normal myelin. Dysmyelinating disorders affect infancy and early childhood and will not be discussed in this chapter. Demyelinating disorders can be classified in primary and secondary. The latter are represented by diseases such as acute disseminated encephalomyelitis, posterior reversible encephalopathy syndrome, viral infections, vascular disorders, postchemotherapy, radiation injury, and toxic lesions. Multiple sclerosis (MS) is by far the most common primary demyelinating disease and, in this chapter, the focus will be on perfusion and dynamic contrast-enhanced (DCE) imaging of MS patients.
MS is the most common inflammatory, demyelinating, and neurodegenerative disease of the central nervous system (CNS) and the most frequent cause of nontraumatic neurologic disability in young and middle-aged adults, affecting 400,000 persons in the United States and 2 million people worldwide.2 Deficits of visual, sensory, motor, cerebellar, brainstem, and autonomic functions are the most common clinical manifestations of patients with MS.
Most patients (85%) experience a relapsing-remitting (RR-MS) course of the disease, characterized by the episodic onset of symptoms followed by residual deficits or by a full recovery within a few weeks. Approximately 20% of patients with RR-MS will remain clinically stable or nearly stable for at least 2 decades (benign MS). Within 25 years, however, most untreated RR-MS patients will evolve into a secondary progressive phase, characterized by a chronic and steady increase of physical symptoms and disability. Approximately 10% to 15% of MS patients experience a primary progressive (PP-MS) course, characterized by steady progression from disease onset. MS is a clinical diagnosis, dependent on a detailed history, careful neurologic examination, and supportive paraclinical investigations, including magnetic resonance imaging (MRI) scans, cerebral-spinal fluid, evoked potentials, and blood tests to exclude confounding diagnoses.2
The pathologic hallmarks of MS are demyelinated plaques within the white matter (WM). In addition to inflammation and demyelination, neuroaxonal damage is another key feature of MS lesions and has a major impact on permanent neurologic deficits. Axonal damage occurs within both acute and chronic plaques, as well as in normal-appearing WM (NAWM), and it is present from the early stage of the disease. It can occur either in parallel with myelin destruction or during a second phase, when the axon is demyelinated and more susceptible to damage.3 In addition to WM plaques and axonal injury, the presence of cortical plaques has long been described in MS.3 A systematic description of these lesions identified seven plaque types depending on the topography within the cortex. Although cortical plaques are considered to be characterized by less lymphocyte infiltration and predominant microglial activation, a recent study has challenged this notion showing that meningeal inflammation is topographically associated with cortical demyelination.3 The involvement of neuroaxonal structures in the disease process is characterized by neuronal apoptosis, loss of dendritic arborization, and transected and demyelinated axons.3
The classic MS diagnostic criteria are the evidence of lesions in the CNS, disseminated in time and space (i.e., more than one clinical episode involving more than one area of the CNS). The use of MRI has had a major impact on the early and more precise diagnosis of the disease. In patients with clinically definite MS, brain MRI reveals multifocal cerebral WM lesions in more than 95% of patients and spinal cord lesions in 75% to 85% of patients. Because the presence of such lesions increases the likelihood of developing clinically definite MS, it is not surprising that formal MRI features for dissemination in space and time have been incorporated within the diagnostic criteria for MS by an international panel in 2001 and have been updated to improve sensitivity and specificity.4
Conventional MRI offers the most sensitive way to detect MS lesions and their changes and plays a dominant role in ruling in or out a diagnosis of MS. Although MS plaques can be found throughout the brain, they have a predilection for periventricular WM and tend to have an ovoid configuration, with the major axes perpendicular to the ventricular surface. In addition to the periventricular region, the corpus callosum, subcortical region, brainstem, U fibers, optic nerves, visual pathway, and the spinal cord are also regions where lesions are frequently located.
Although MS plaques appear hyperintense on T2-weighted and fluid-attenuated inversion recovery images, a minority of them (20% to 30%) are seen as areas of hypointensity on T1-weighted images. Routine MRI studies often employ an intravenous contrast agent, which is a chelate of gadolinium (Gd). Gd is a paramagnetic element and it causes enhanced T1 and T2 relaxation in regions
where it accumulates (see Chapters 6 and 7 for more details). This is seen as contrast enhancement on T1-weighted sequences. Because of their molecular size, Gd chelates do not cross a normal blood–brain barrier (BBB), but in new and inflammatory MS lesions, there is a breakdown of the BBB and thus Gd enhancement. Occasionally, large plaques (also called tumefactive MS) may produce mass effect and simulate other mass lesions. Nevertheless, compared with neoplastic lesions, MS plaques have minimal surrounding edema and relatively less mass effect for the overall size of the WM lesions. The lack of enhancement or the enhancement pattern can assist in further characterization of these unusual plaques. In most cases, additional periventricular plaques increase the level of certainty of MS diagnosis. Perfusion imaging can be very helpful in difficult cases because tumefactive MS invariably shows relatively low cerebral blood flow (CBF) and cerebral blood volume (CBV) compared with enhancing tumors.5
where it accumulates (see Chapters 6 and 7 for more details). This is seen as contrast enhancement on T1-weighted sequences. Because of their molecular size, Gd chelates do not cross a normal blood–brain barrier (BBB), but in new and inflammatory MS lesions, there is a breakdown of the BBB and thus Gd enhancement. Occasionally, large plaques (also called tumefactive MS) may produce mass effect and simulate other mass lesions. Nevertheless, compared with neoplastic lesions, MS plaques have minimal surrounding edema and relatively less mass effect for the overall size of the WM lesions. The lack of enhancement or the enhancement pattern can assist in further characterization of these unusual plaques. In most cases, additional periventricular plaques increase the level of certainty of MS diagnosis. Perfusion imaging can be very helpful in difficult cases because tumefactive MS invariably shows relatively low cerebral blood flow (CBF) and cerebral blood volume (CBV) compared with enhancing tumors.5
MS lesions do occur in gray matter (GM) and are better detected on fluid-attenuated inversion recovery, double inversion recovery, and phase-sensitive inversion recovery imaging.6 In GM, MS lesions are usually small with intermediate high signal intensity and a less severe degree of inflammation, which may explain why these lesions are less visible than WM lesions on MRI.
Subtle pathologic changes that are not visible on conventional MRI are known to occur in the NAWM and normal-appearing gray matter (NAGM) of patients with MS and can account for an important component of MS-related dysfunction, both physical and cognitive.7
A major limitation of T2-weighted MRI is the low pathologic specificity. T2 lesions that are otherwise indistinguishable to the eye can contain a highly variable amount of axonal loss, demyelination or remyelination, inflammation, and gliosis. Also, T2-weighted imaging provides no information on alterations in the cellular components of MS lesions, and it does not detect pathologic abnormalities that exist in the NAWM and NAGM. Thus, the need has emerged to develop MRI measures that are more specific when investigated in focal white matter lesions and more sensitive to the NAWM and NAGM damage.
Perfusion MRI can provide unique information about brain metabolism, oxygen consumption, and tissue integrity. Advances in MRI technology, such as the introduction of multichannel receiver coils and high field strength scanners, have improved both the sensitivity and resolution of perfusion MRI techniques, thus allowing not only regions of GM but also WM regions and smaller lesions to be analyzed. In addition, MRI techniques have several advantages over positron emission tomography and single-photon emission computed tomography, which were initially used to assess brain perfusion: higher signal-to-noise ratio and contrast-to-noise ratio, better spatial and anatomical resolution, shorter acquisition times, and the avoidance of radioactive material.
Blood Flow, Blood Volume, and Blood–Brain Barrier Permeability
The proximity of lesions to the vasculature is a hallmark of MS, and the disruption of the BBB is well recognized as a crucial step in the evolution of the MS lesion,8 causing focal edema in the brain parenchyma from the accumulation of plasma fluids. This process presumably is initiated by autoreactive T lymphocytes, which migrate into the CNS and start an inflammatory immune response. Inflammation may result in microvascular damage by different mechanisms. Cytotoxic T cells can recognize antigens on endothelial cells and activate a clotting cascade, which, in turn, leads to thrombosis. Likewise, specific antibodies can recognize their antigens at the vessel wall and induce vascular damage by complement activation. Furthermore, inflammatory edema can impair microcirculation through focal tissue swelling,9 whereas exudation of inflammatory cells and intravascular fibrin deposition can induce acute and chronic venous obliterations.10 Finally, inflammation is able to modulate the vascular tone and the microcirculation and, as a consequence, trigger local changes in the blood flow.11 This is supported by several experimental studies that have shown a complex and dynamic relationship between vasodilator and vasoconstriction factors in MS. Intraparenchymal injection of interleukin-1β (IL-1β), a proinflammatory cytokine, in experimental rodents caused a neutrophil-dependent transient increase in BBB permeability and CBV.12 Although it has been shown that the presence of neutrophils within the brain parenchyma significantly contributed to the IL-1β-induced changes in CBV, IL-1β apparently had a direct effect on the resident cell populations, which persisted well after all recruited leukocytes had disappeared. Thus, the action of IL-1β alone can give rise to MRI-visible changes that are normally attributed to alterations to cellular homeostasis. Conversely, decreased CBV was observed in response to direct intrastriatal injection of tumor necrosis factor-alpha (TNF-α), demonstrating that elevated TNF expression in MS can lead to adverse events such as vasoconstriction, disrupted tissue homeostasis, and damage to the BBB.13 on the other hand, classical vasodilators, such as nitric oxide or substance P, show an increased expression during neuroinflammation in MS.14 TNF-α and interferon-gamma are known to rapidly induce cultured endothelial cells to synthesize tetrahydrobiopterin, a limiting cofactor for the endothelial nitric oxide (NO) synthetase, converting l-arginine into NO and l-citrulline, thereby increasing NO production by activating endothelial NO synthetase.15 Elevated levels of NO, TNF-α as well as IL-10 were also described in the cerebral spinal fluid of MS patients.16
In addition to NO and cytokine-mediated changes in cerebral perfusion, disturbed glial cell homeostasis can
contribute to a heightened susceptibility for vascular changes in MS patients (i.e., a rise in calcium levels within astrocytes induces constriction of blood vessels and consequently reduces CBF).17 The absence or reduction of astrocytic factors causes BBB endothelial cells to carry a reduced number of mitochondria. A decreased mitochondrial content in endothelial cells in MS postmortem tissue is hypothesized to be a primary event in the disruption of the BBB.18 on the other hand, early vascular endothelial cell activation was identified prior to brain parenchymal reaction and demyelination,19 which, in combination with discrete microglial activation and perivascular cellular infiltrates, is a frequent finding in postmortem tissue of MS patients.20 Microglial activation coincided with abnormal endothelial tight junctions in active lesions and NAWM, leading to putatively open junctions in microscopically inflamed blood vessels.
contribute to a heightened susceptibility for vascular changes in MS patients (i.e., a rise in calcium levels within astrocytes induces constriction of blood vessels and consequently reduces CBF).17 The absence or reduction of astrocytic factors causes BBB endothelial cells to carry a reduced number of mitochondria. A decreased mitochondrial content in endothelial cells in MS postmortem tissue is hypothesized to be a primary event in the disruption of the BBB.18 on the other hand, early vascular endothelial cell activation was identified prior to brain parenchymal reaction and demyelination,19 which, in combination with discrete microglial activation and perivascular cellular infiltrates, is a frequent finding in postmortem tissue of MS patients.20 Microglial activation coincided with abnormal endothelial tight junctions in active lesions and NAWM, leading to putatively open junctions in microscopically inflamed blood vessels.
Although an ischemic mechanism has long been acknowledged in histologic studies of MS,21,22 it is only recently that advances in MRI techniques have allowed for investigations of this phenomenon in vivo.23,24,25,26 Early measurements of global perfusion in MS using radioactive 133-xenon,27 positron emission tomography,23 or single photon emission computed tomography techniques28 reported lower regional perfusion in both GM and WM of MS patients compared with healthy individuals, more prominent in PP-MS than RR-MS patients.
Diagnosis, Outcome Prediction, Classification, and Early Detection
The research conducted so far suggests that perfusion and DCE imaging of MS does not yield diagnostic information except for the differential diagnosis of tumefactive demyelination lesions (see “Protocol Recommendation and Index Cases” later in the chapter) but can be useful for early detection of prelesional damage and for a better characterization of lesional and NAGM and NAWM damage.
The first perfusion MRI studies focused on investigation of MRI visible T2 lesions (Fig. 73.1) and, subsequently, as more sophisticated technical methods became available, on the assessment of NAWM and NAGM. Major findings are reported accordingly.
Lesions
The development of new lesions in relapse-onset MS is associated with breakdown of BBB, an event detected on Gd-enhanced T1-weighted scans. Biopsy and postmortem studies have correlated Gd enhancement with histopathologic features of active inflammation, perivascular cuffs of lymphocytes and extensive macrophage infiltrates, in association with active myelin degradation.29 Although most new lesions show a nodular Gd enhancement, some of them present with a ring enhancement that is hypothesized to account for a more destructive disease course.
The acute T2 lesion normally waxes and wanes in association with the appearance and then disappearance of Gd enhancement. There is usually a permanent residual T2 abnormality, but this may be smaller in size than the maximum focus of enhancement. Edema and inflammation probably account for the reversible component of T2 lesions. Approximately 20% to 30% of chronic T2 lesions also exhibit T1 hypointensity on T1-weighted spin-echo MRI. At histologic examination, chronic hypointense lesions are characterized by a greater amount of tissue matrix destruction and axonal loss.30 Such lesions, known as “black holes,” have been regarded as markers for axonal loss. In 2000, Lucchinetti et al.31 proposed a new classification of demyelinating lesions based on histopathologic evidence, separating MS lesions into four categories. The authors highlighted that although MS is characterized by high interindividual heterogeneity, single patients show a strong intraindividual consistency of the acquired lesion morphology. Considering the cerebral blood perfusion, the lesion pattern type III may be of special interest as it seems associated with hypoxia-like tissue injury resembling white matter stroke. Lesions of this pattern also express a marker of hypoxic tissue damage; the hypoxia-inducible factor-12α.9
Using perfusion MRI to investigate different MS lesion subtypes, Haselhorst et al.24 found significantly higher
CBV in acute Gd-enhancing plaques and a lower CBV in T1-hypointense lesions in comparison with NAWM. More recently, Ge et al.32 found increased blood perfusion not only in active MS plaques characterized by BBB disruption, but also in a subgroup of nonenhancing lesions. These authors speculated that this increase of lesional CBF might reflect new or reactivated vascular inflammatory changes on the background of generally decreased perfusion and ischemia-like microvascular changes of the brain parenchyma in MS patients. Wuerfel et al.33 studied the longitudinal development of lesional perfusion and demonstrated that the initial prominent increase in CBV and CBF weeks prior to lesion detection on T1-, T2-, or diffusion-weighted MRI was followed by a gradual decline over 20 weeks. Remarkably, the CBF and CBV remained below baseline in those lesions that developed a persistent T1 hypointensity (i.e., black hole) caused by severe tissue damage. These authors hypothesized that the initial elevation could be explained by inflammation-related vasodilation in the acute stage, whereas the decreased lesional perfusion in later stages reflected the development of a hypometabolic gliotic scar, indicated by reduced N-acetyl-aspartate in MR spectroscopy in T1-hypointense lesions.30
CBV in acute Gd-enhancing plaques and a lower CBV in T1-hypointense lesions in comparison with NAWM. More recently, Ge et al.32 found increased blood perfusion not only in active MS plaques characterized by BBB disruption, but also in a subgroup of nonenhancing lesions. These authors speculated that this increase of lesional CBF might reflect new or reactivated vascular inflammatory changes on the background of generally decreased perfusion and ischemia-like microvascular changes of the brain parenchyma in MS patients. Wuerfel et al.33 studied the longitudinal development of lesional perfusion and demonstrated that the initial prominent increase in CBV and CBF weeks prior to lesion detection on T1-, T2-, or diffusion-weighted MRI was followed by a gradual decline over 20 weeks. Remarkably, the CBF and CBV remained below baseline in those lesions that developed a persistent T1 hypointensity (i.e., black hole) caused by severe tissue damage. These authors hypothesized that the initial elevation could be explained by inflammation-related vasodilation in the acute stage, whereas the decreased lesional perfusion in later stages reflected the development of a hypometabolic gliotic scar, indicated by reduced N-acetyl-aspartate in MR spectroscopy in T1-hypointense lesions.30
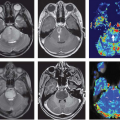
 FIGURE 73.1. Dynamic susceptibility contrast perfusion measurement in a patient with relapsing-remitting multiple sclerosis. Multiple sclerosis plaques are visible as hyperintense regions in T2* raw data bilaterally in the centrum semiovale. Mean transit time (MTT), time-to-peak (TTP), relative cerebral blood flow (CBF), and blood volume (CBV) maps are presented. Plaques show lower perfusion values compared with normal appearing white matter. |
Interestingly, ring Gd-enhancing lesions present with increased perfusion in the enhancing ring but with significantly reduced CBV and CBF in the center of the lesion.33 A previous MRI study employing magnetization transfer ratio, a measure of tissue damage,34 demonstrated a gradient of severity from the periphery to the lesion center with the lowest magnetization transfer ratio values inside the T1-hypointense center. Therefore, it could be speculated that the reduced blood supply in such lesions accounts for a higher probability of permanent tissue destruction, which might explain the worse clinical outcome in patients associated with this lesion type. The observed heterogeneity of perfusion and permeability parameters in MS lesion suggests a potential use of this method for the classification and differentiation of lesions; however, to further investigate this potential, more data need to be collected, either in cross-sectional or in longitudinal studies.
Related posts:
 Dose Considerations in CT Perfusion
 Confounding Effects in Arterial Spin Labeling
 Arterial Spin Labeling Acquisition Protocols
 Pediatric Stroke and Congenital Disease
 Clinical Applications of Dynamic Contrast-Enhanced Magnetic Resonance Imaging in Musculoskeletal Tumors
 Cerebral Perfusion Studies in Substance Abuse and Dependence
Stay updated, free articles. Join our Telegram channel

Full access? Get Clinical Tree


